If changes keep coming in at this rate, I may need to move to a once a week update format, at least until we get a bit closer to the election. In any case, with today’s batch of new polls, we get a couple of status changes in Iowa, which in turn shift the national picture a bit.
Click on any of the charts to see more detail.
Clinton vs Paul
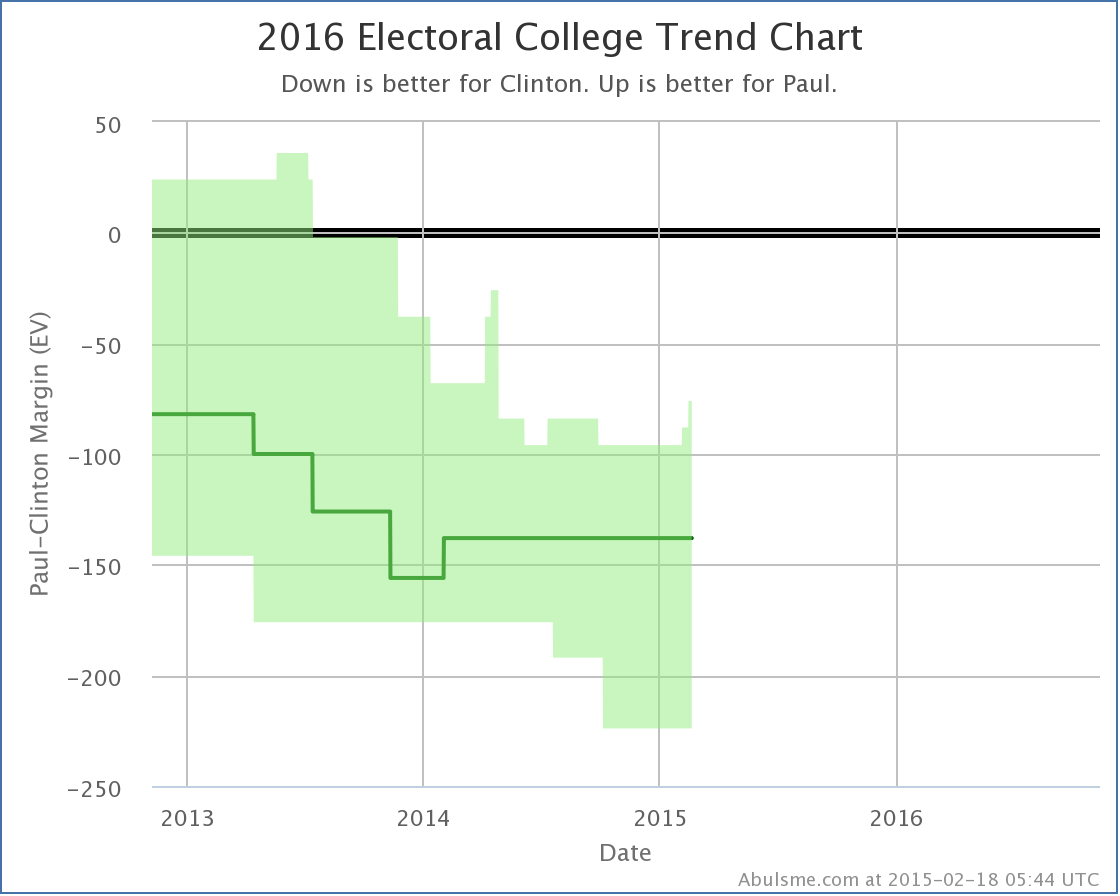
With today’s update, Iowa moves into the “Weak Clinton” zone, meaning that I consider it to be close enough to allow for the possibility of Paul winning. This improves Paul’s best case against Clinton to losing by 76 electoral votes. A couple of weeks ago, Paul’s best case was to lose by 96 electoral votes. So there does seem to be some movement here.
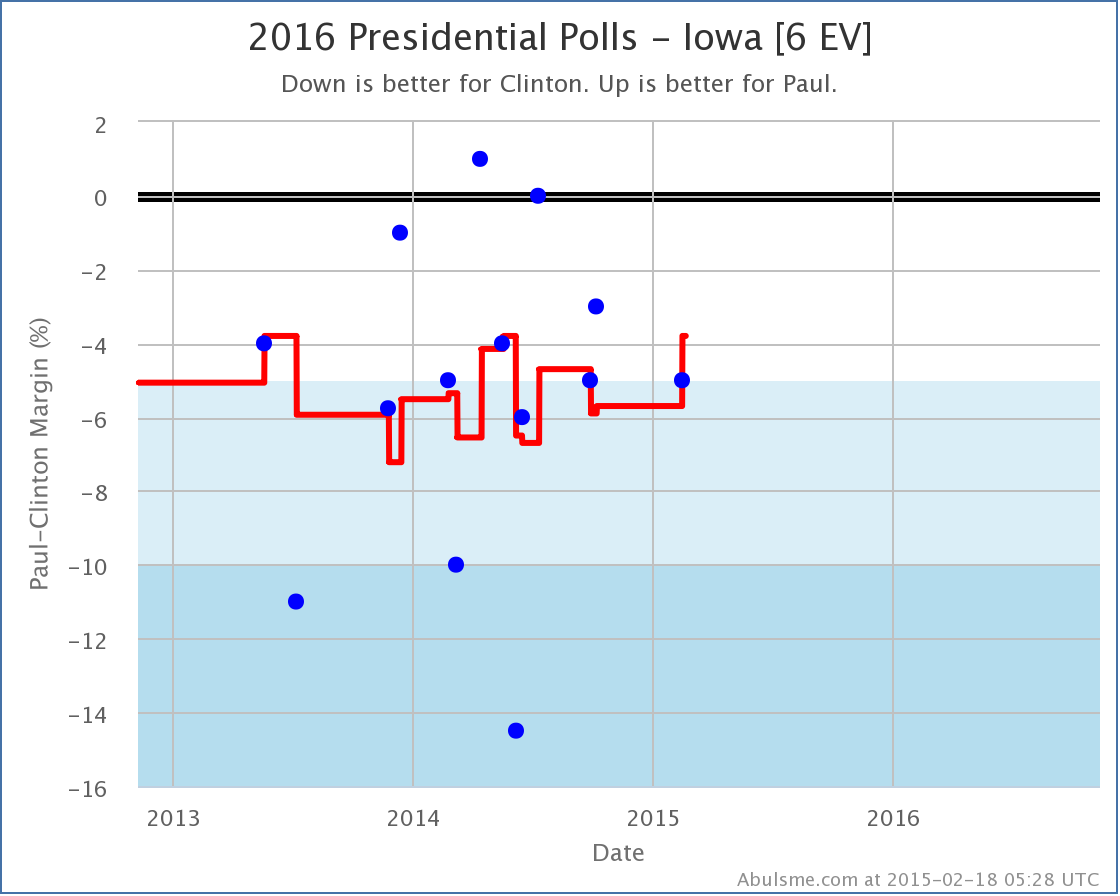
Looking at the actual polls in Iowa though, this trend is a little less clear. Iowa seems to have been bouncing back and forth over the 5% Clinton lead line for the last two years, spending more time with Clinton further ahead than 5%, but with occasional temporary movement toward Paul. Can we say that this time is a real “trend” rather than just another short term bump? Nope. Or maybe the average being further in Clinton’s direction is really just the result of a handful of outlier polls and really this “should” have been closer all along. Maybe. We’ll have to wait for more polls to see.
For now though, my charts show movement toward Paul.
Clinton vs Huckabee
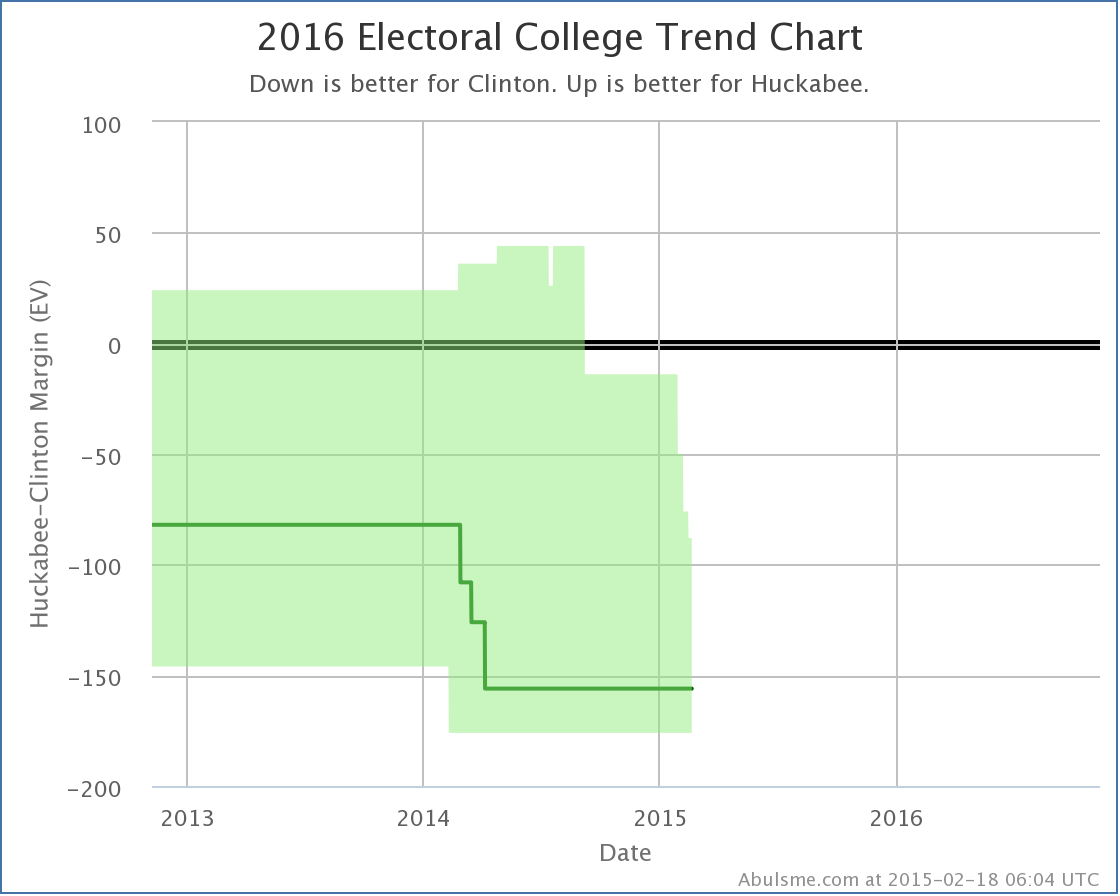
While Paul’s picture is improving, Huckabee’s continues to decline. In the latest update, Iowa slips out of Huckabee’s best case. Huckabee’s best case is now to lose to Clinton by 88 electoral votes. A month ago, his best case was losing by only 14 electoral votes, but states keep slipping away. Now, there has been a lot less Clinton vs Huckabee polling than there has been Clinton vs Paul polling, so there is a good chance a lot of this has simply been getting enough polling to get a good picture, rather than actual movement.
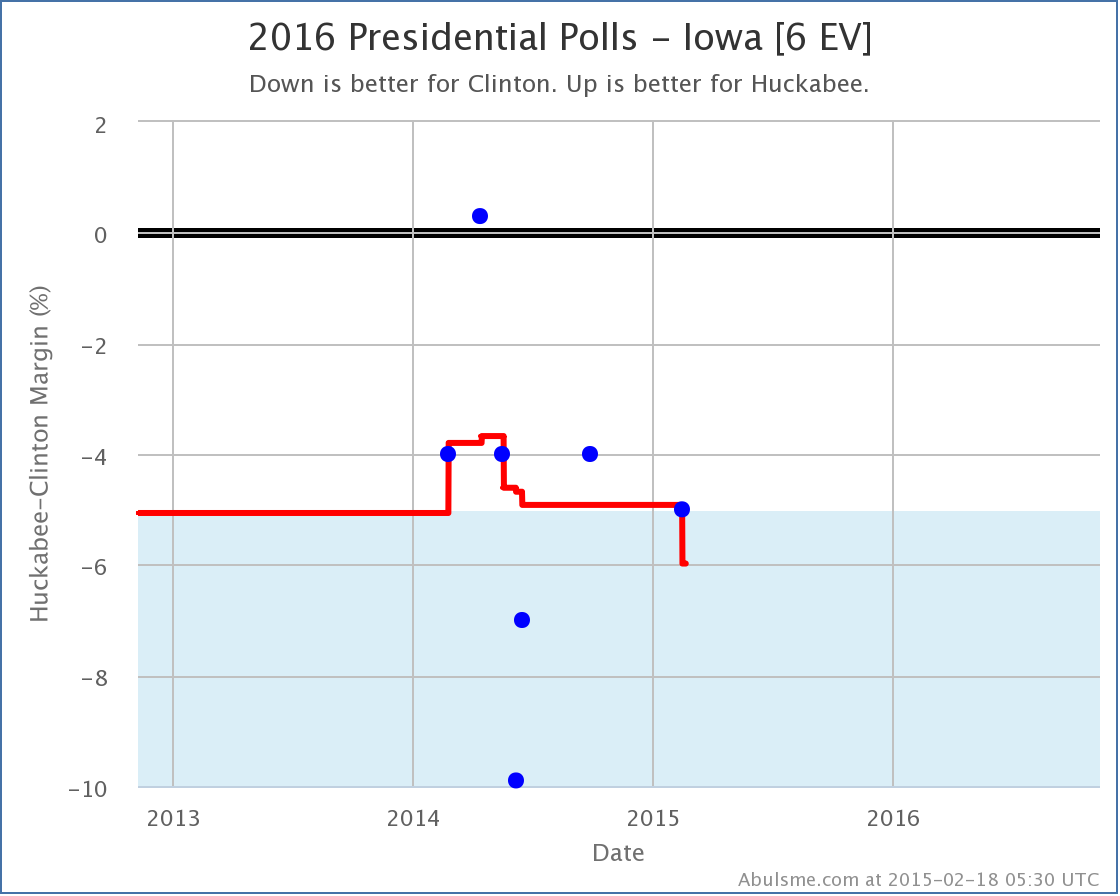
Specifically looking at the individual Iowa polls, you can see that we already did have five polls in Iowa, so the picture wasn’t dependent on previous election results, but there have only been 7 polls compared to the 14 for Clinton vs Paul. And there is quite a scatter between those polls (as there also was with Clinton vs Paul). The “movement” here is basically one extreme poll (the one showing Huckabee actually ahead in Iowa) falling out of the average, while another extreme point (the one showing Clinton ahead by 10%) remains in the average.
As with the Paul situation, it is far from clear that this is a real trend as opposed to just a temporary bump in this direction, and the next polls could change the picture again. It is well within the realm of possibility that the “real situation” for both of these candidates is that Clinton is just about 5% ahead of them, and they will just bounce back and forth between my categories as new polls come in.
Comparison
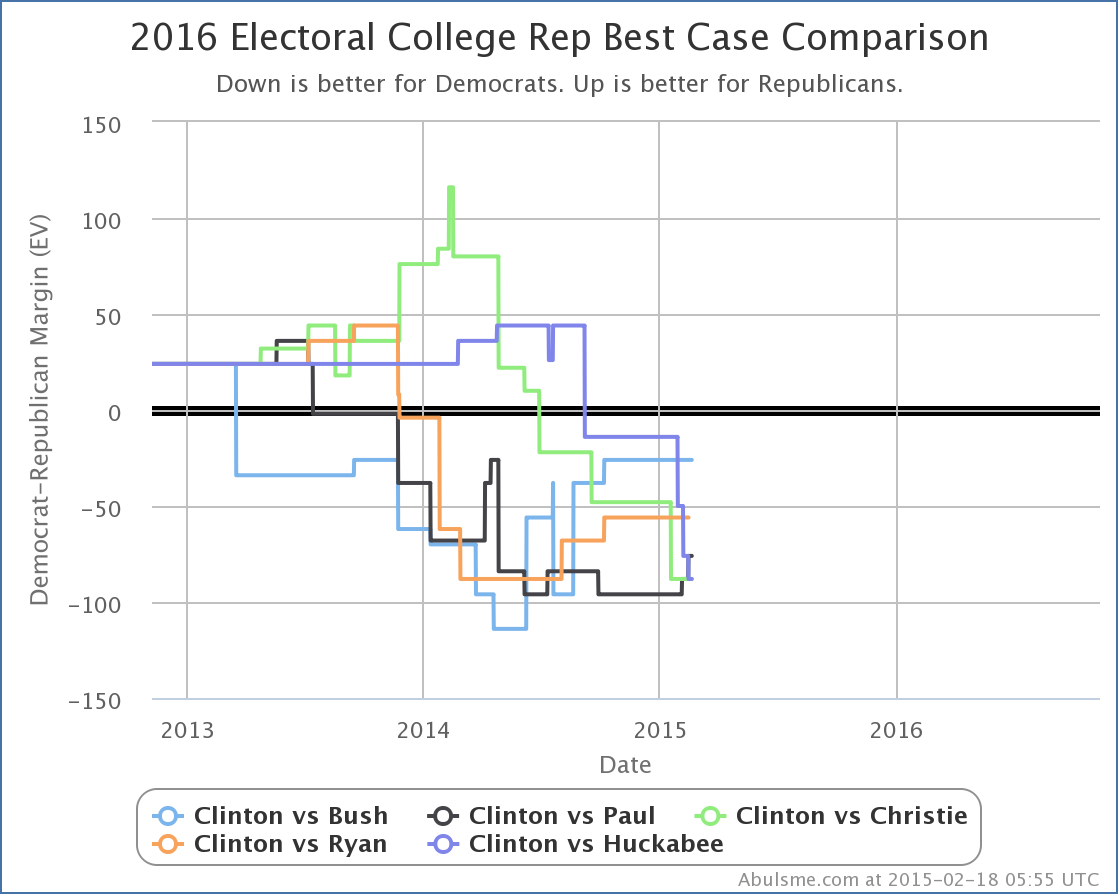
Since in both cases today, what has changed is the Republican best case, lets look at the trends there with the five best polled candidate combinations. Looking just since the 2014 elections, the movement on this specific metric has been Paul improving, Bush and Ryan flat, Christie and Huckabee declining. Other metrics show slightly different trends, but when all of the Republicans here are losing even when you give them all the close states, the first step is just to start making states close, and this chart measures that process.
But wait, Ryan has said he isn’t running, and what about this Walker guy? A bunch of people have been talking about him lately. Well, I recently introduced this new chart on where the candidate combinations stand in my “polling quality” metric:
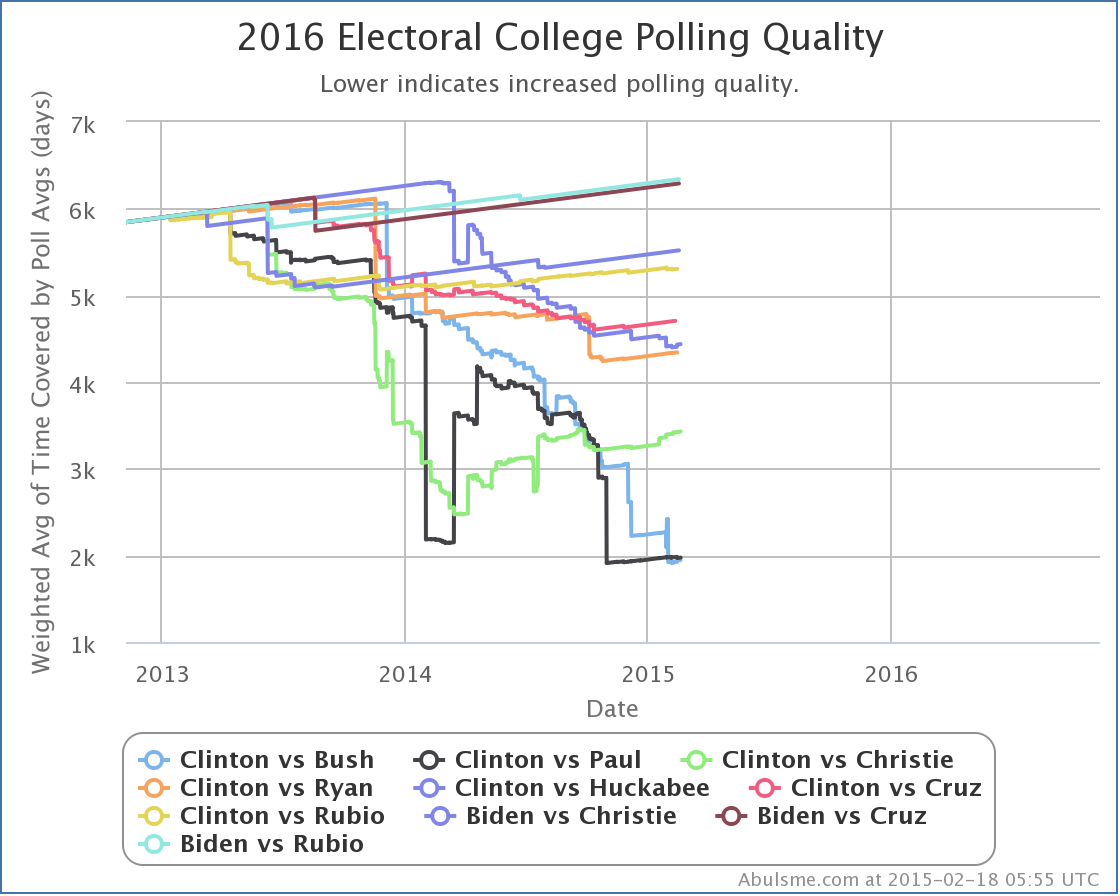
This shows the best TEN polled candidate combinations, not just the top five, so we can see if new candidate pairs are heading toward the top five.
On this chart the lower the line, the better the polling quality. Poling quality is measured by the average amount of time used in the polling averages across the 56 jurisdictions that have electoral votes, weighted such that close states count a lot more than states where one candidates lead is large. A new poll may or may not improve polling quality, since if new poll makes a state less competitive than it was, the weight of that state also decreases in this metric. If there are no new polls for a candidate pair, the polling quality slowly gets worse as each day passes.
Anyway, what do we see here? Well, if trends continue, looks like Clinton vs Huckabee may soon pass Clinton vs Ryan, and Clinton vs Bush and Paul are very close to each other so easily could flip back and forth, but Clinton vs Cruz hasn’t shown any signs lately of much life. Nor any of the others in the 6-10 zone. So we may not get any new combinations in the top five for a little while yet.
How about Clinton vs Walker? Oh, yeah. that combination is still way out at #18 on this ranking. He stands at about 6616 on this metric, compared to 6340 for the worst of the top ten shown in the chart above and 4437 for the worst of the top five. We need a lot more state level polls of that combination before we have enough polls to meaningfully compare that scenario to the five we’re showing in the analysis here.