This is probably the most significant update I’ve posted since launching this analysis in November. For the first time, one of the Republicans with significant amounts of polling is actually leading Clinton. Specifically, in Clinton vs Rubio, the “expected result” where each candidate wins all the states where they currently lead in my polling average, is now Clinton 268 to Rubio 270. That is a narrow win, but that is a win.
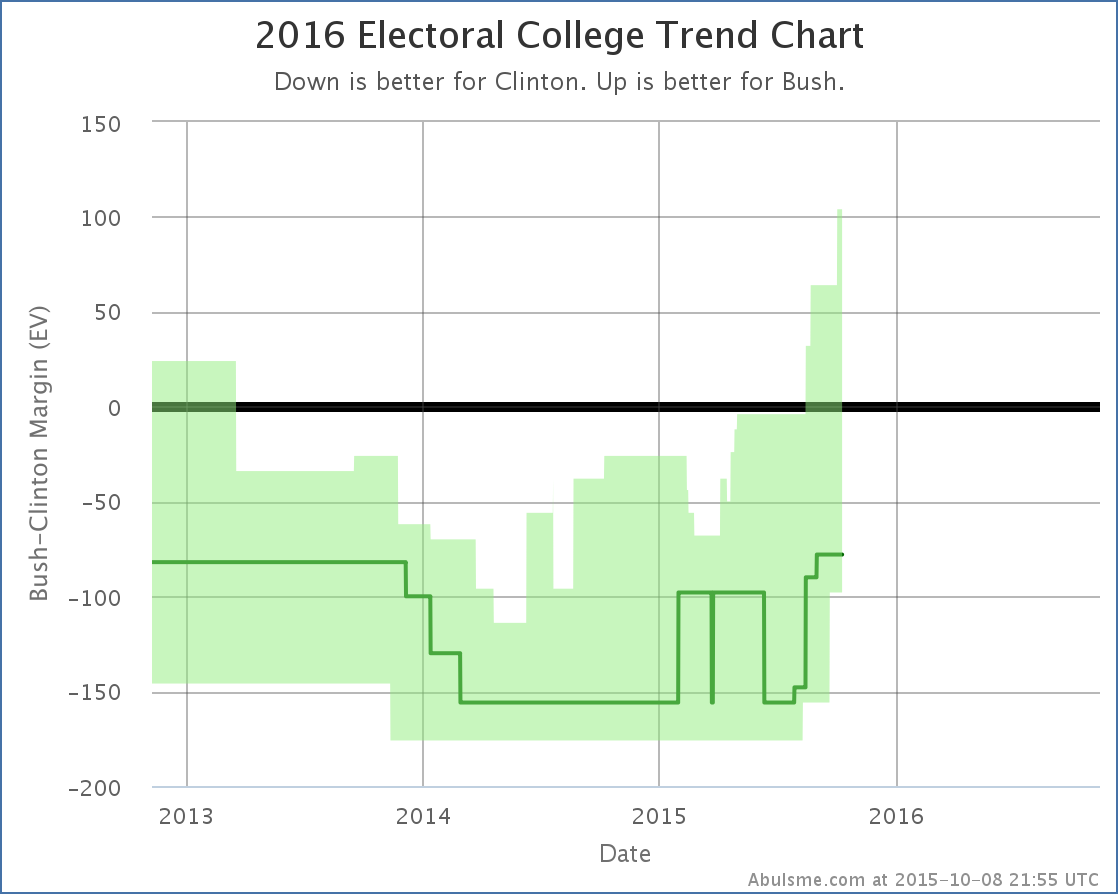
Since the spring, almost every update has been bad news for Clinton, but the collapse here has been more rapid than that. As recently as July, Clinton was leading Rubio by 156 electoral votes in my analysis. In less than three months, this lead completely evaporated. It is a long way until the election still. And some deterioration was expected. But this trend for Clinton is dramatic. Has she reached the bottom yet? Absent additional major negative revelations, she must be close to a floor… but there is no slowing of this trend visible yet. Things just get worse and worse for Clinton. (At least vs Rubio and Bush… for other opponents, either the trend is less dramatic, or there is just not enough recent state level polling data to draw good conclusions yet.)
Clinton vs Rubio
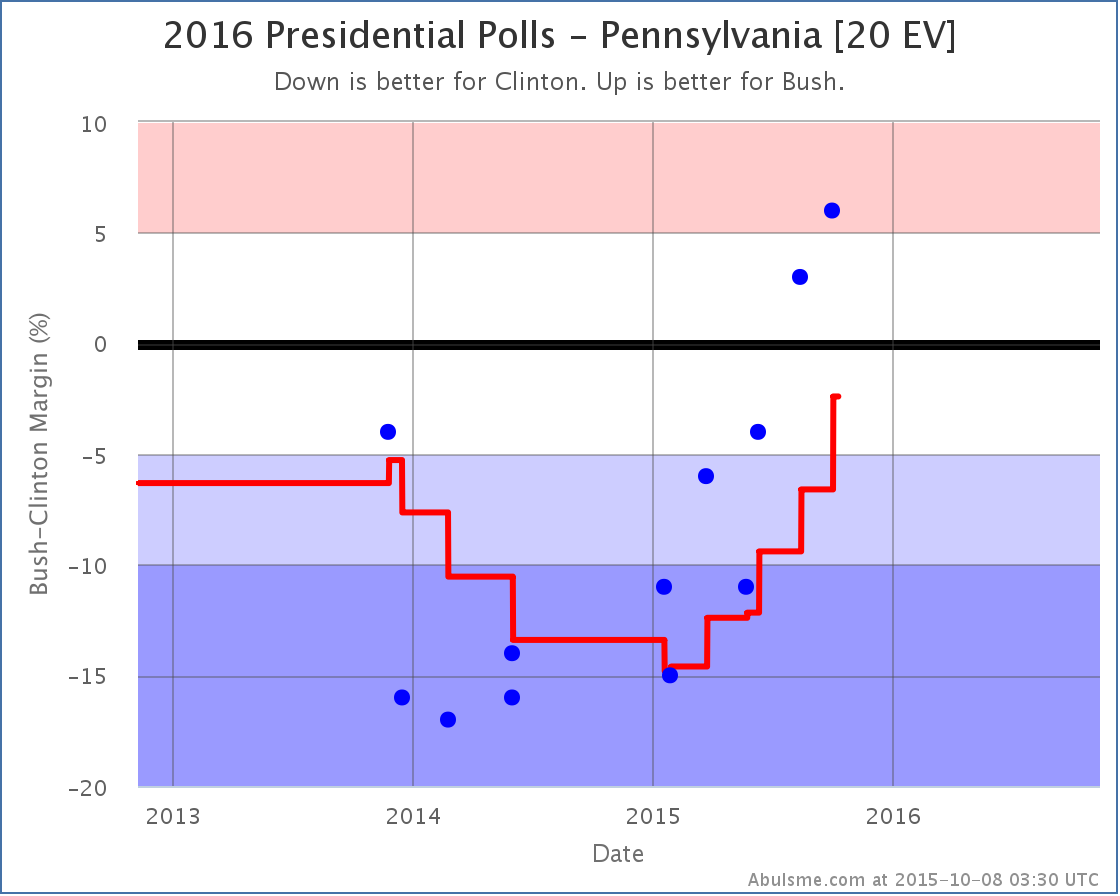
Lets look into the details. First of all, Pennsylvania:
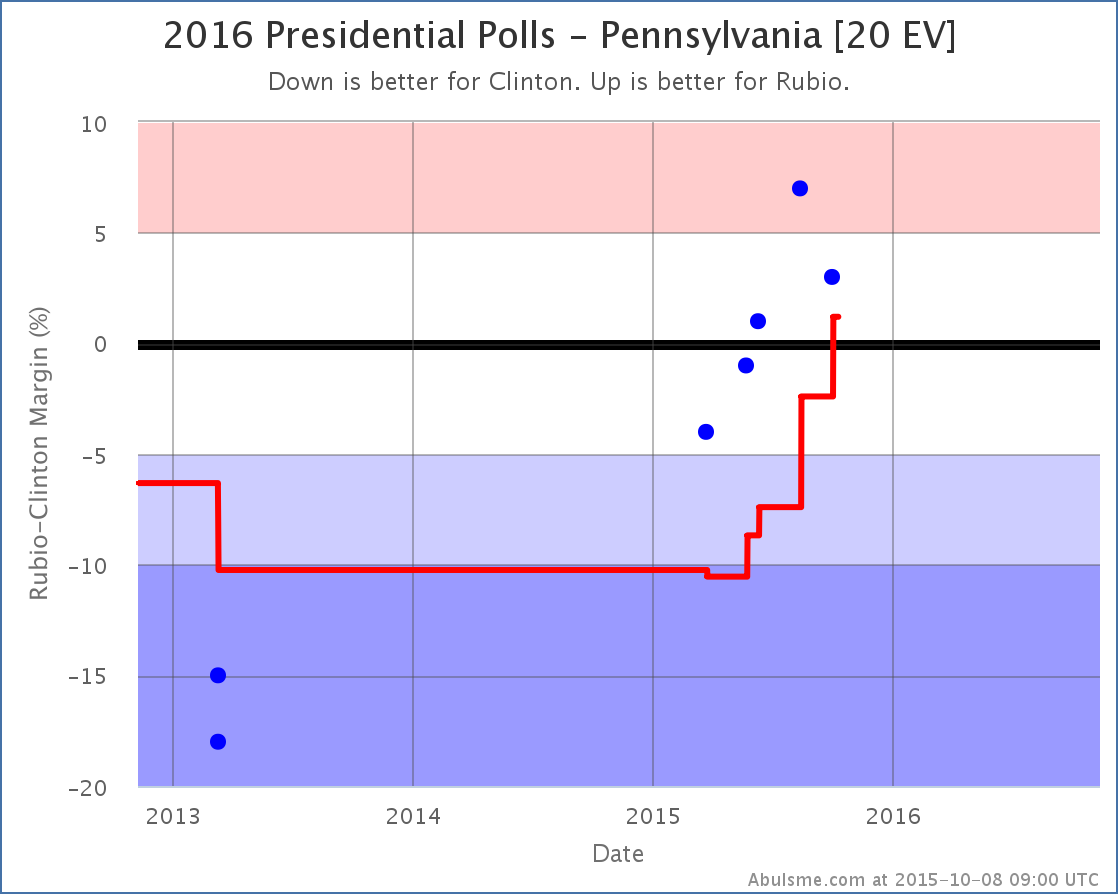
Pennsylvania has not been as heavily polled as some other states, the poll average still covers 6.6 months, but the trend here resembles the trend in many other states, with Clinton losing ground with almost every poll. With this last poll, the average was pulled over to Rubio’s side of the center line. Pennsylvania’s 20 electoral votes was enough to make Rubio the overall winner. This was the big change that caused today’s headline.
Between Pennsylvania’s move, and a smaller move in Ohio that didn’t cross category lines, the tipping point of course moved too:
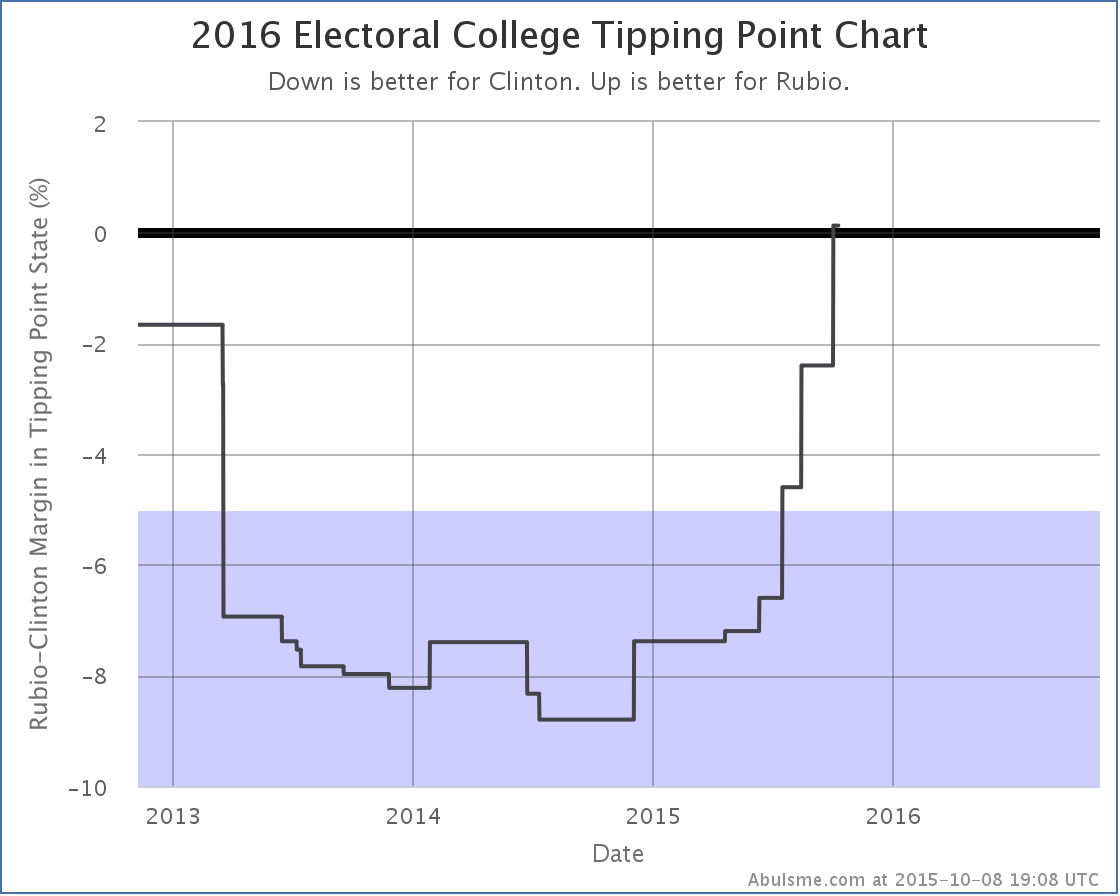
A year ago the tipping point was at 8.8% in Clinton’s favor. It is now Rubio by 0.1%. That is a razor thin margin, but it is a Rubio win.
Which brings us to the fact that there actually was one positive thing for Clinton in the latest Clinton vs Rubio results. Florida.
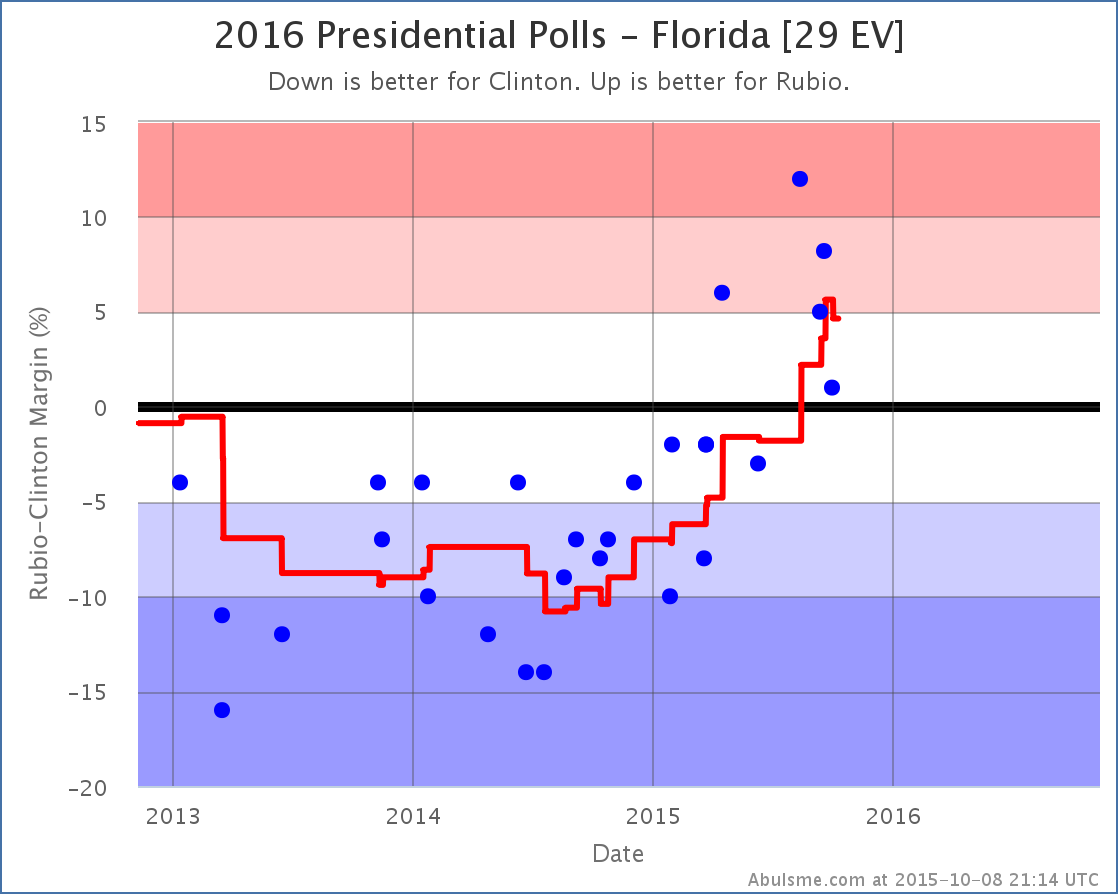
The poll average in Florida actually moves a little toward Clinton with the latest poll, bringing it to a 4.6% Rubio lead. This once again puts Florida in the “could go either way” category based on my classifications, and so improves Clinton’s best case.
With all of these changes, here is the new “bubble”:
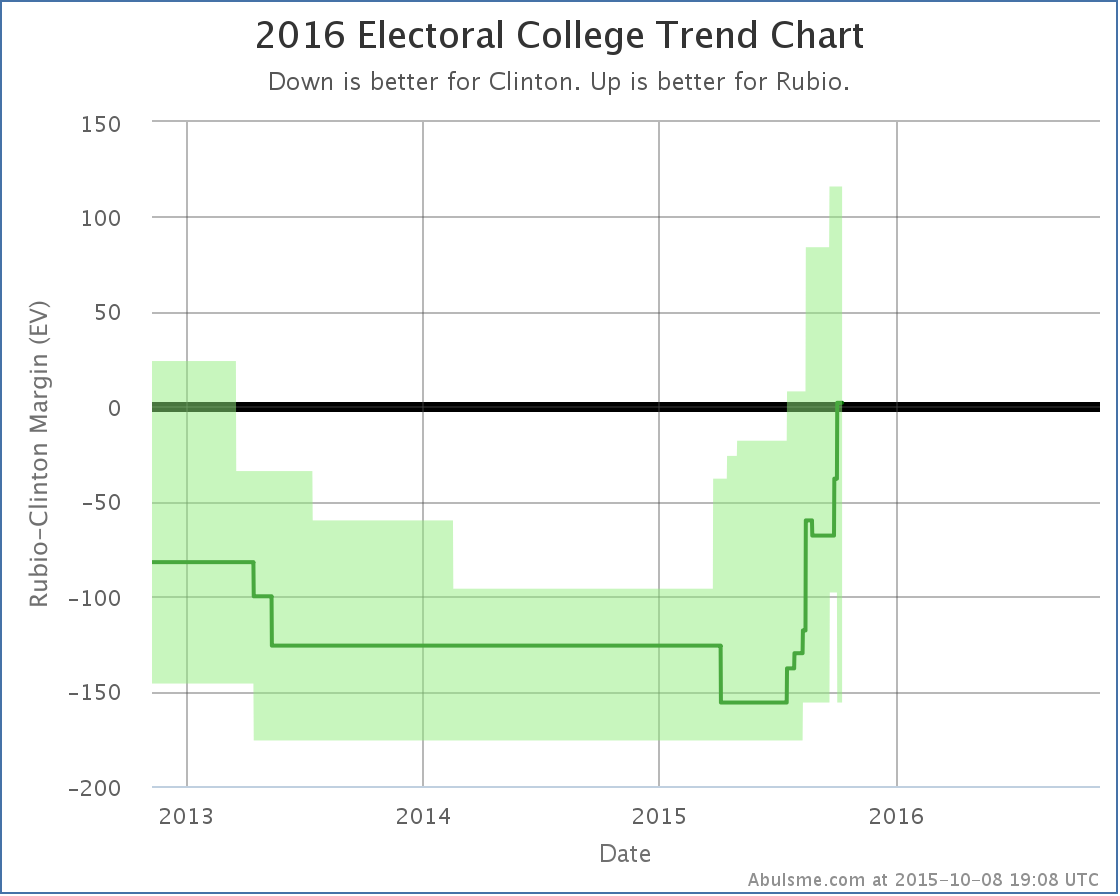
One of the most surprising things about this chart, especially compared to how things looked a year ago, is just the height of that bubble… the range of possible outcomes that are reasonable given the current state of polling. Right now the summary looks like this:
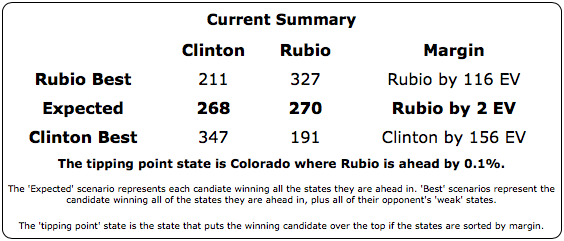
And the state spectrum:
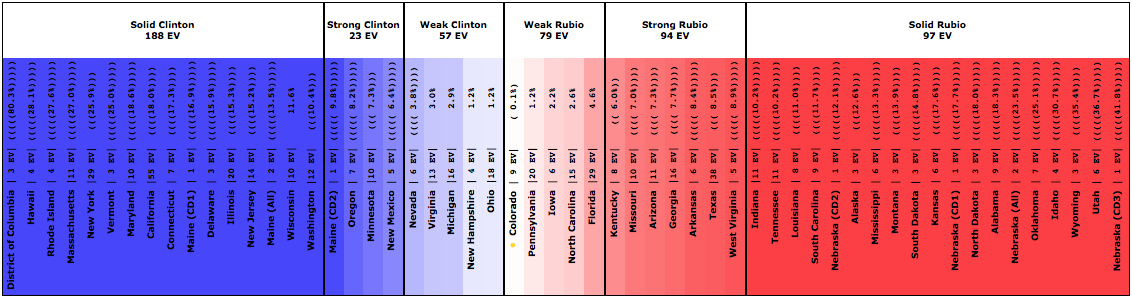
There are now TEN states where the polling is close. 136 electoral votes. Everything from Clinton winning by 156 to Rubio winning by 116 is plausible given only minor moves in the polls. This is a huge range of possible outcomes here.
Right now, the tipping point is right smack in the middle of those states, five on each side of the line… with a margin in the tipping point state of only 0.1% and Rubio ahead by only TWO electoral votes. The only way this could be closer is if we were actually looking at a 269-269 tie.
Right now, 13 months from the election, Clinton vs Rubio is as close to an even race as you could possibly imagine. But with the huge number of close states, it is “close” in the sense of too close to call, but we can’t rule out the possibilities of either candidate winning by a significant margin! There are just too many states that could go either way. (Having said that, results closer to the middle of the range are indeed more likely than those at the edges. Having ALL the close states go to one candidate or the other is extremely unlikely.)
A lot can and will happen in the next year… it is certainly possible that neither of these two candidates end up as the nominees. But this can’t be where Clinton hoped to be at this point. She wanted to be seen as not just inevitable for the Democratic nomination, but with a very healthy lead in the general election.
That is not what is happening.
The question now is if Rubio is able to start strengthening this into a clear lead, instead of just a toss up. Can he start flipping Ohio? New Hampshire? Michigan? If current trends continue, it would not be surprising…
Clinton vs Bush
Although the big news was in Clinton vs Rubio, there was also a change in Clinton vs Bush. It also favored the Republican.
Bush is a bit behind Rubio in his Pennsylvania polling against Clinton, but it has also been consistently improving for months. With today’s new poll, Clinton’s lead drops to 2.4%, putting Pennsylvania in the swing state category, and improving Bush’s best case.
Pennsylvania moving into the realm of the possible is that spike in the upper right. Bush’s best case is now to win by 104 electoral votes. The range of possibilities isn’t quite as wide as with Rubio, but at 101 electoral votes in play, it is still pretty wide.
None of this is a prediction of what will happen in November 2016. We are still too far away for that. It is just a snapshot of where we are today.
397.1 days until polls start to close. A lot of drama yet to come in those days.
Note: This post is an update based on the data on ElectionGraphs.com. All of the charts and graphs seen here are from that site. Graphs, charts and raw data can be found there for the race nationally and in each state for every candidate combination that has been polled at the state level. In addition, comparisons of the best polled candidate combinations both nationally and each in each state are available. All charts above are clickable to go to the current version of the detail page the chart is from, which may contain more up to date information than the snapshots on this page, which were current as of the time of this post. Follow @ElecCollPolls on Twitter for specific poll details as I add them. And like Election Graphs on Facebook!