New polls since last update: Iowa, Florida, New York, North Carolina, Nevada, Arizona, Ohio, New Hampshire, Pennsylvania, Wisconsin, Michigan.
This is now the sixth day in a row that there has been movement in the Election Graphs models. I didn’t expect this kind of pace until September or October. Hopefully it won’t be this way the entire time until November, or your faithful commentator will be a burned out cinder by then.
In any case, in today’s update two changes contribute to the changes:
Iowa [6 EV]
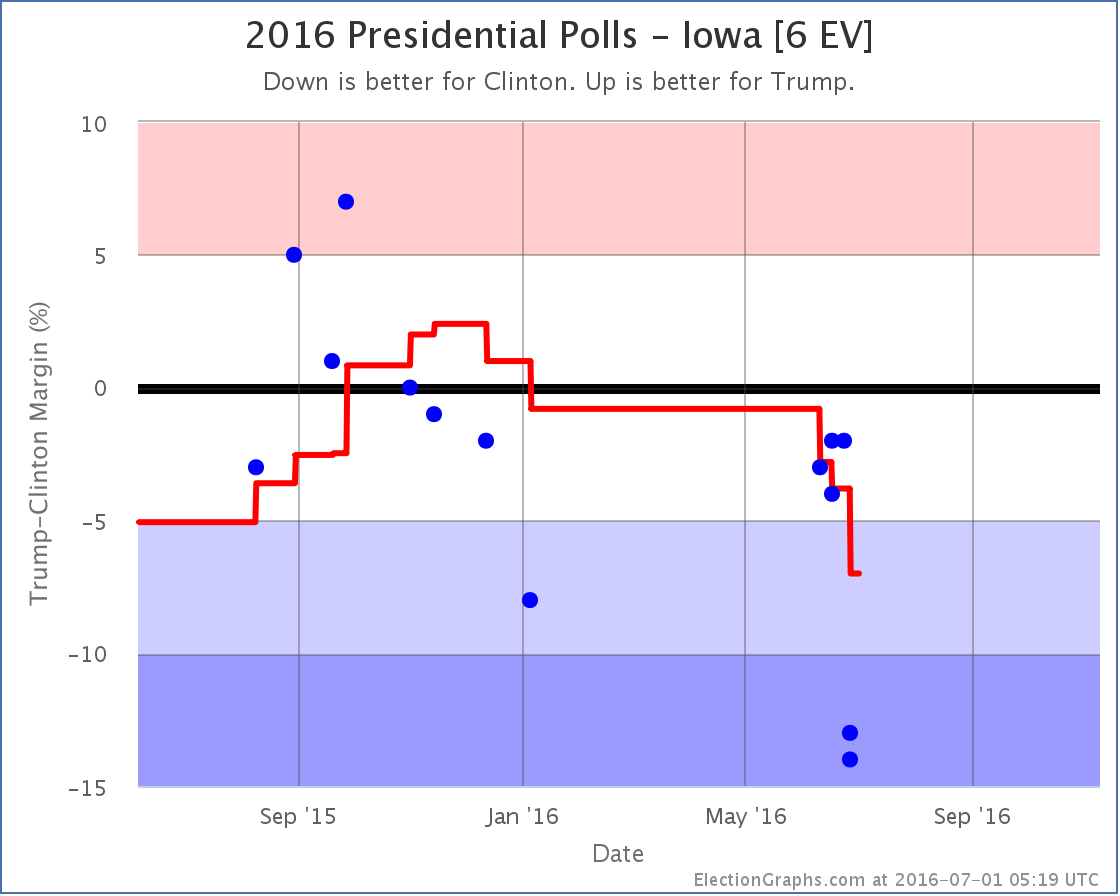
The new Iowa polls by Loras (one with Johnson and Stein, one without) initially look like outliers. But there has been a wave of these polls showing bigger Clinton leads than we had seen previously this week. Are they all outliers? There will be no way to tell for sure until there is more polling. But do not be surprised if this “movement” reverses once these particular polls roll off of the average.
In the mean time though, we include all the polls in the average, and Iowa moves from Weak Clinton to Strong Clinton, which means it is no longer included in Trump’s best case.
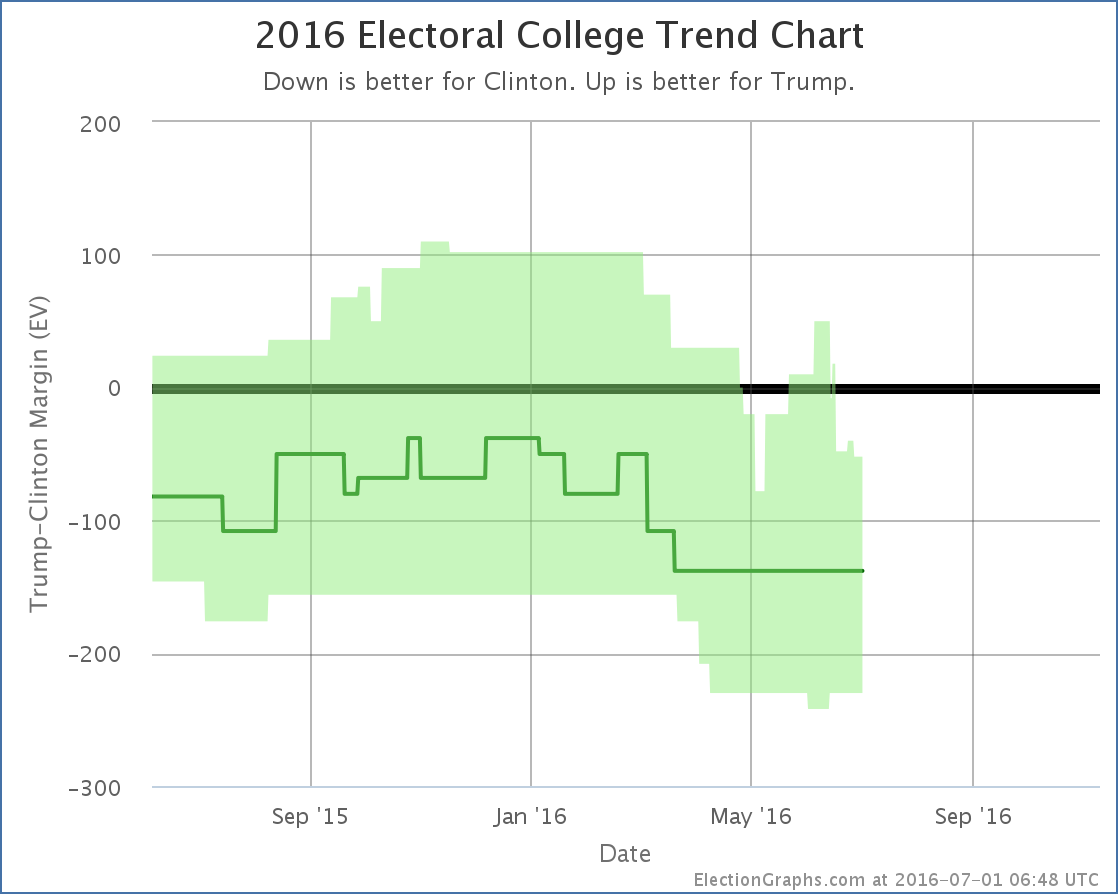
With Iowa not in play, Trump’s best case moves from losing by 40 electoral votes to losing by 52 electoral votes. This is still better than the picture was at the beginning of May, which Trump’s best case was to lose by 78 electoral votes, but even so, this isn’t a pretty picture for Trump.
After weeks of saying here that a Trump collapse was not yet visible in the state polls, you can now clearly see a Trump bump, followed by a collapse. Notable though is the fact that this is only visible in Trump’s “best case”, not the “expected case”. Trump made a number of states look close, but aside from some transitory short term changes that were erased as more polls were added, Trump has not moved any states over to his side of the line.
The expected electoral college result has been static at Clinton 338, Trump 200 since March.
Florida [29 EV]
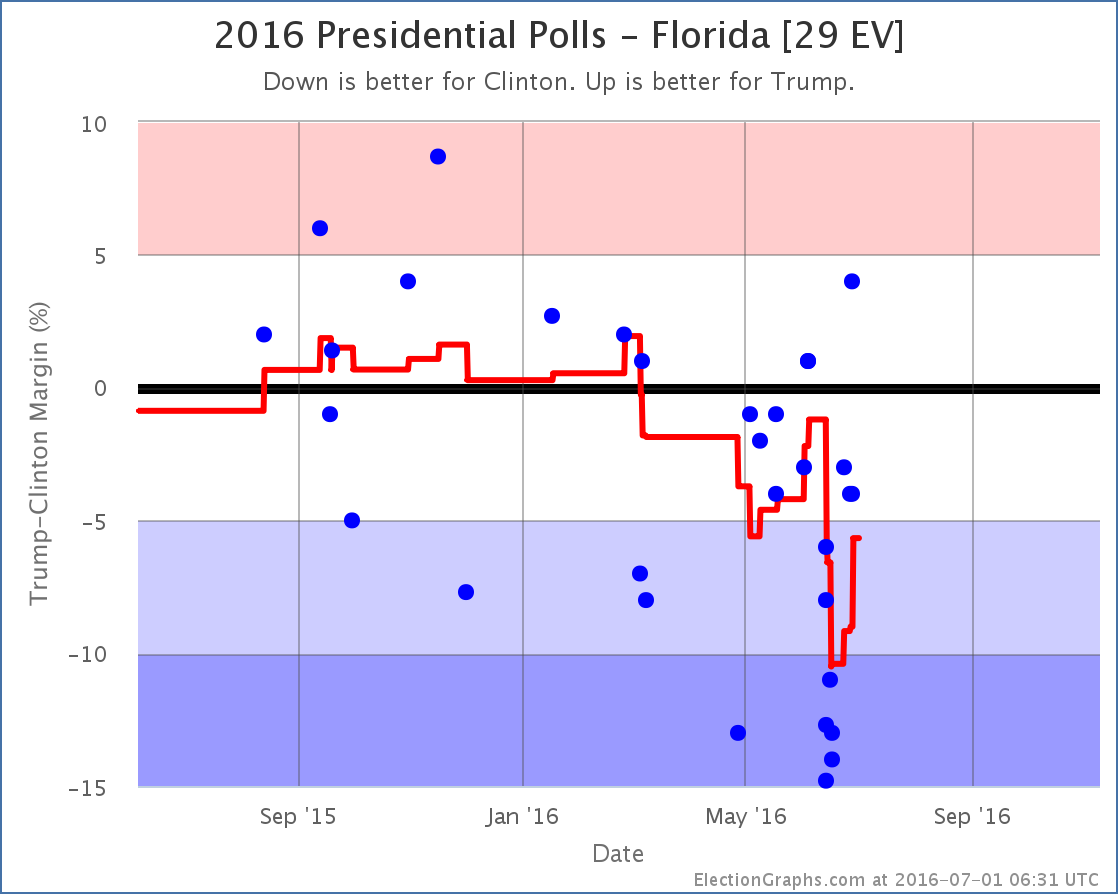
Florida does not change categories this time, but along with Iowa moves the tipping point.
Iowa moved toward Clinton. The Iowa poll covered a slightly earlier timeframe than the Florida poll. Iowa moved the tipping point from Clinton by 5.5% in Minnesota to Clinton by 6.5% in New Mexico.
But then Florida moved a bit toward Trump and almost immediately moved the tipping point back to Clinton by 5.7% in Florida.
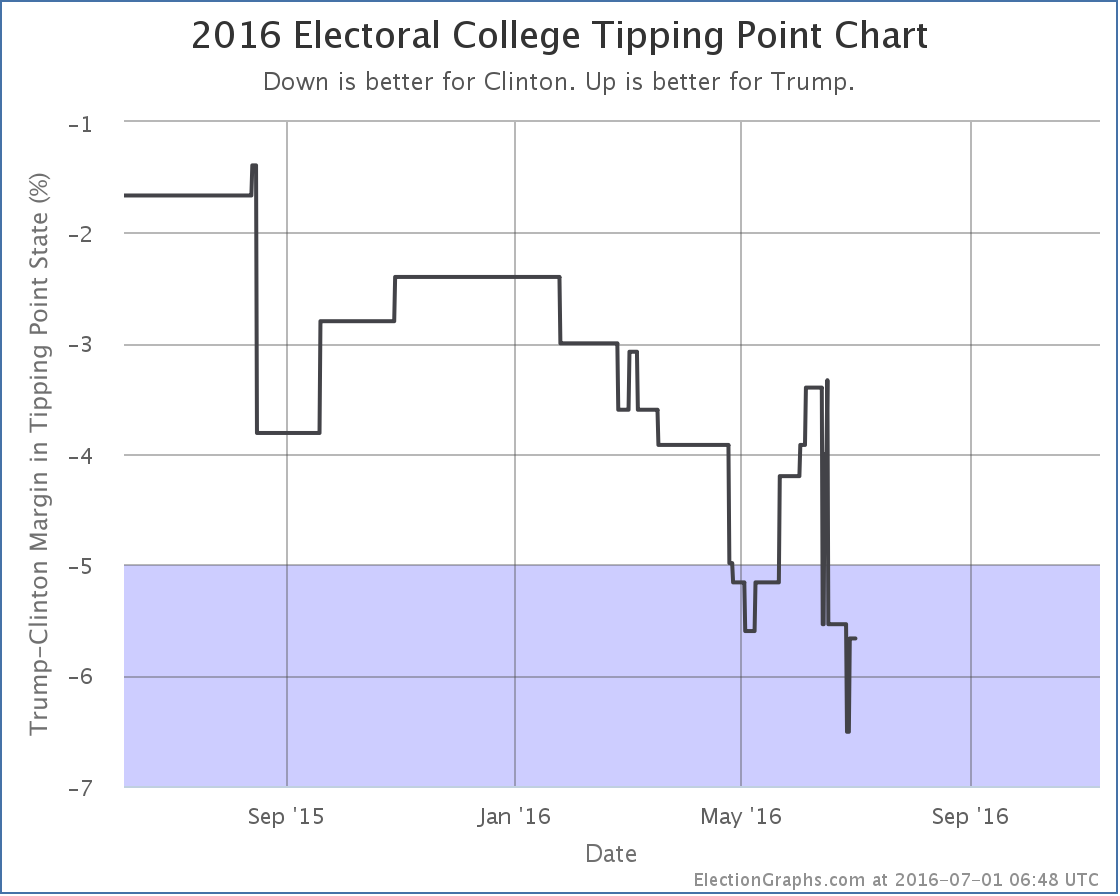
You can see the spike down to 6.5% then immediate movement back to 5.7% on the chart. Net change is still a 0.2% movement toward Clinton.
The Trump bump followed by a collapse is now clearly visible on the tipping point chart as well. Note that the “bump” only moved Trump to the zone he was in back in March. It never completely reversed the negative trend of the primary months. And this entire graph is on the blue side of the center line. Trump has never had a lead.
On this metric, with the recent collapse just hit his worst level ever (then bounced back a bit).
The way to read this trend along with the flatness in the expected electoral college result is that while Trump hasn’t fallen further behind in the electoral college, the states he would need to flip in order to win are moving further away from him, making the task of catching up with Clinton look harder and harder.
The picture has changed dramatically in just the last two to three weeks though, so it is important to keep in mind how volatile these numbers can be. Especially since a number of the polls that caused these changes initially look like they might be outliers.
It would not be surprising at all to see some movement back in the trump direction in the two weeks prior to the Republican convention. And of course the “usual” pattern is a bump after the Convention.
So keep watching. 130.3 days until polls start to close on election day.
Note: This post is an update based on the data on ElectionGraphs.com. Election Graphs tracks both a poll based estimate of the Electoral College and a numbers based look at the Delegate Races. All of the charts and graphs seen in this post are from that site. Additional graphs, charts and raw data can be found there. Follow @ElectionGraphs on Twitter or like Election Graphs on Facebook to see announcements of updates or to join the conversation. For those interested in individual general election poll updates, follow @ElecCollPolls on Twitter for all the polls as they are added. If you find the information in these posts interesting or useful, please consider visiting the tip jar.
[Blog Post] Electoral College: Clinton now strong in Iowa https://t.co/EK2hh4LNPc
RT @ElectionGraphs: [Blog Post] Electoral College: Clinton now strong in Iowa https://t.co/EK2hh4LNPc