States with new poll data since the last update: Georgia, Ohio, Nevada, Michigan, Missouri, New Hampshire, Kansas.
The quick answer to the question in the subject of this post is “not yet”, at least in terms of what can be detected in state poll averages like we track here. Plenty has been written elsewhere on the Trump bump in national polling averages such as Pollster and RCP. There does appear to be a bump after the Republican convention. It takes a lot longer for these effects to show up at the state level, so we are unlikely to see individual effects for the two conventions. Instead we’ll see the net effect after both.
In the meantime, there are indeed two changes from the latest batch of polls, and they both are in Trump’s direction. In one case the data is from before the convention, and in the other the movement is small, so it isn’t enough to call out as a bump yet. Looking at them individually:
Michigan
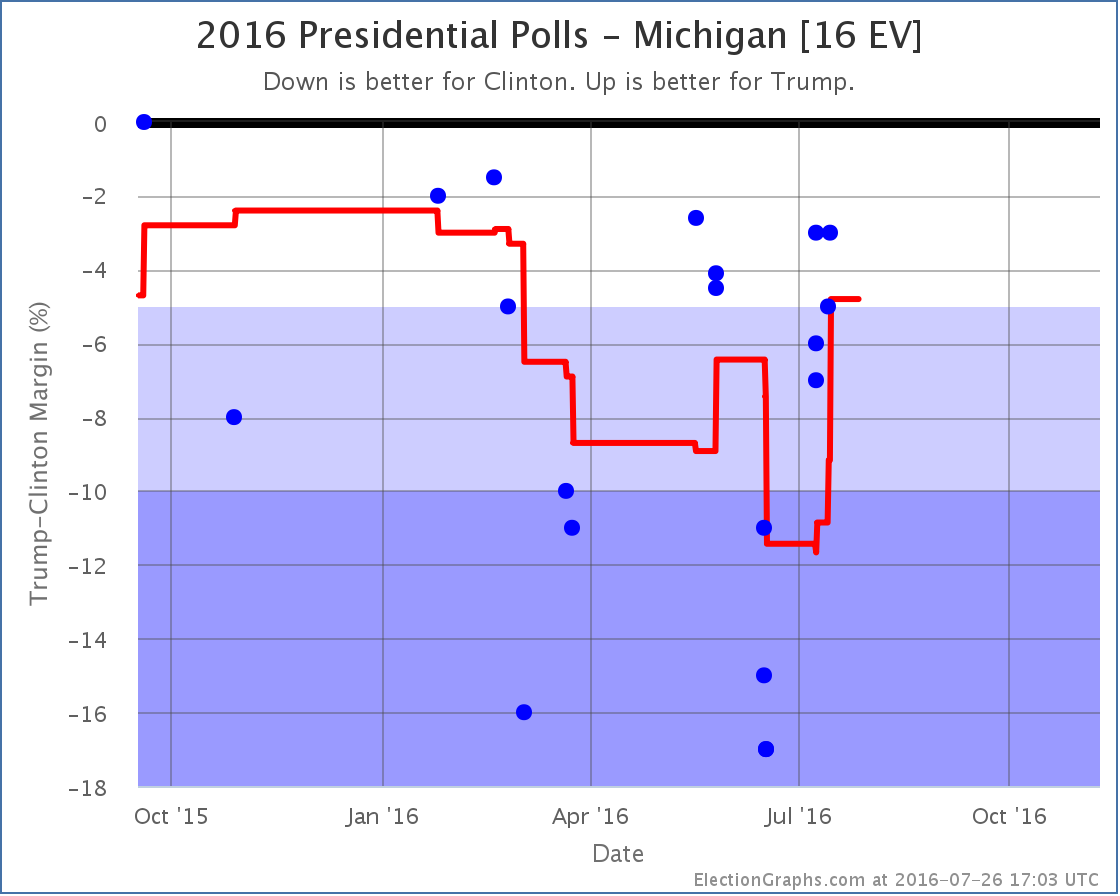
Even though one poll was just added, the most recent poll in Michigan is still from before the Republican convention, so we can’t read anything about a bump into it. But it did cause some polls that were very favorable to Clinton to roll off the poll average, so the average spikes up in Trump’s direction.
There haven’t been any polls actually showing Trump ahead in Michigan in almost a year, but with this Clinton’s lead drops to 4.8%, so we consider it a potential pickup for Trump.
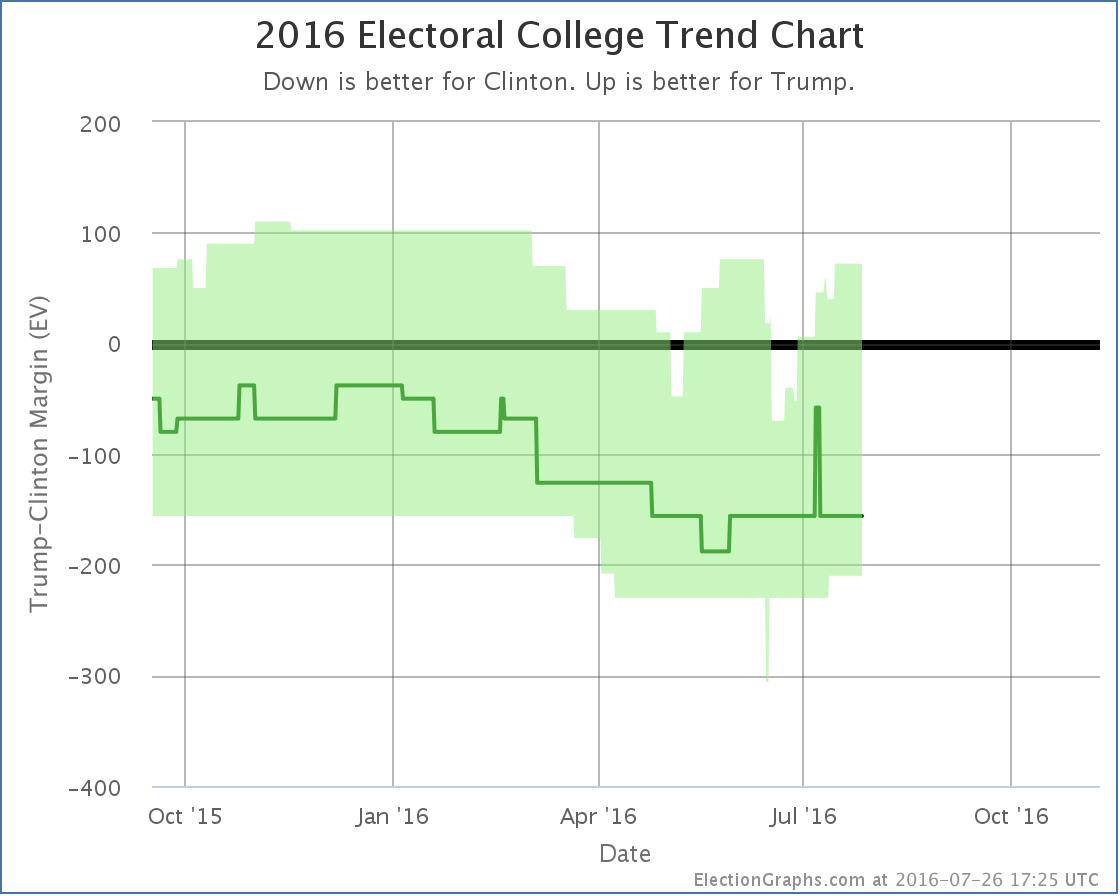
Trump’s best case moves from winning by 40 electoral votes to winning by 72 electoral votes. To get there he still has to flip Nevada, New Hampshire, Iowa, Florida, Ohio, Pennsylvania, North Carolina and Michigan. Clinton is still ahead in all of those states, but by less than 5%. The “expected” result where everybody wins the states they are ahead in is still a 156 electoral vote victory for Clinton.
But Trump doesn’t need to flip ALL of those states to win, only some of them. How close is he really? That is where Ohio and the tipping point come in…
Ohio
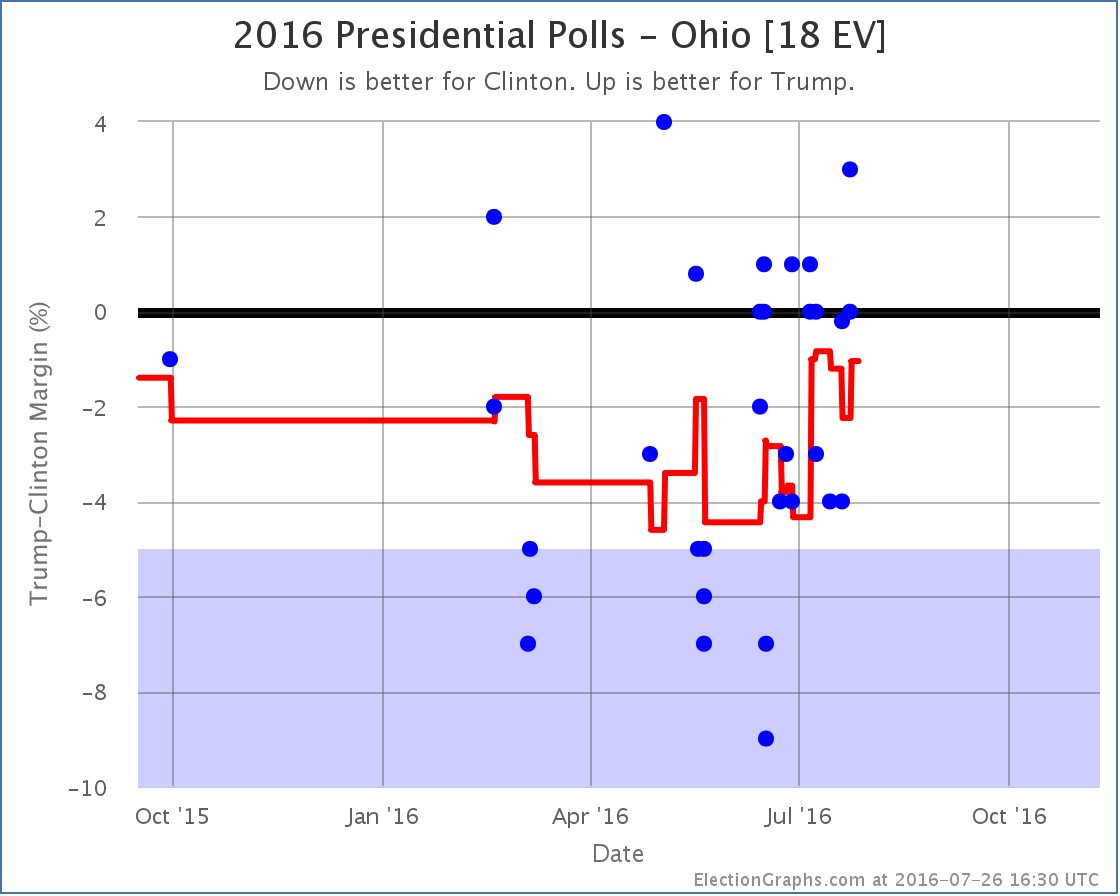
New results from PPP, which ARE from after the Republican convention move the average from a 2.2% Clinton lead in Ohio to a 1.0% lead. Either way, the state is “Weak Clinton”, but because Ohio was the tipping point, this impacts the tipping point:
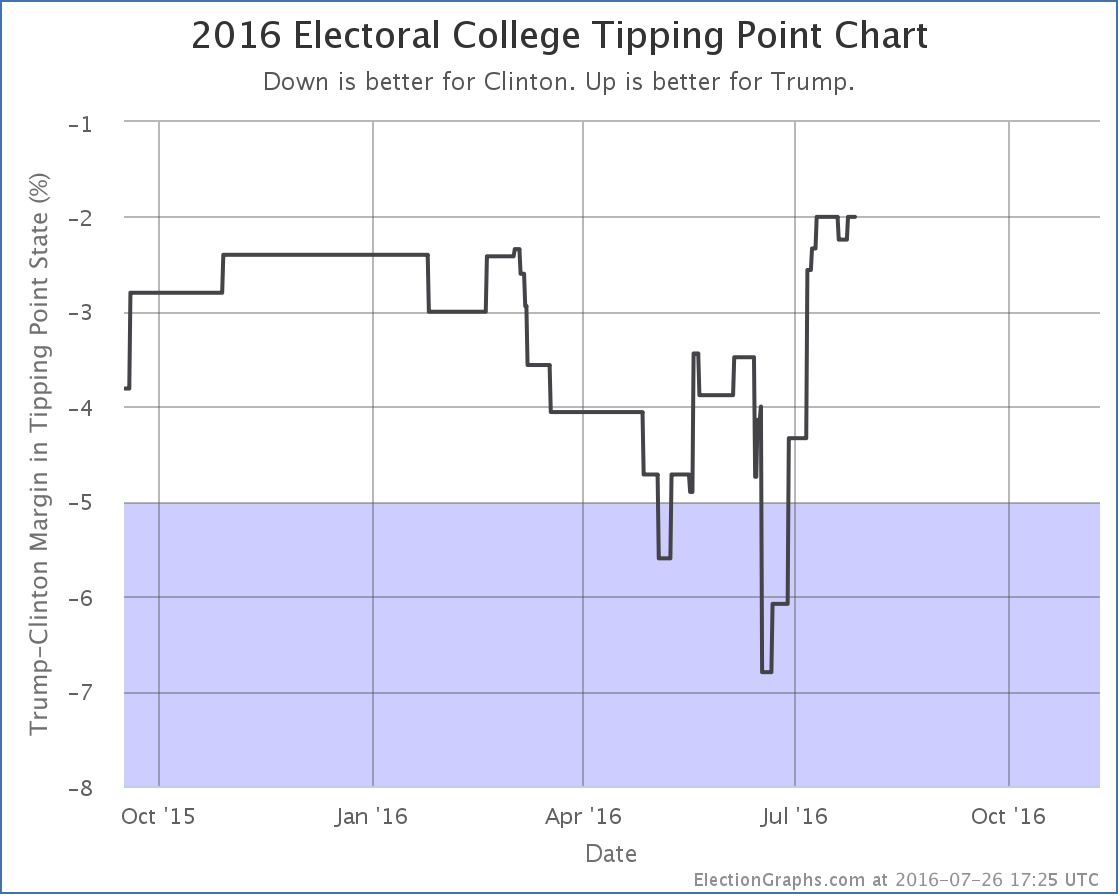
The tipping point moves from Clinton by 2.2% in Ohio to Clinton by 2.0% in Pennsylvania… so back to where it was right before the Republican National Convention started.
National View
Looking at the center part of spectrum of states… only those where the margin is under 10%, we now have this:
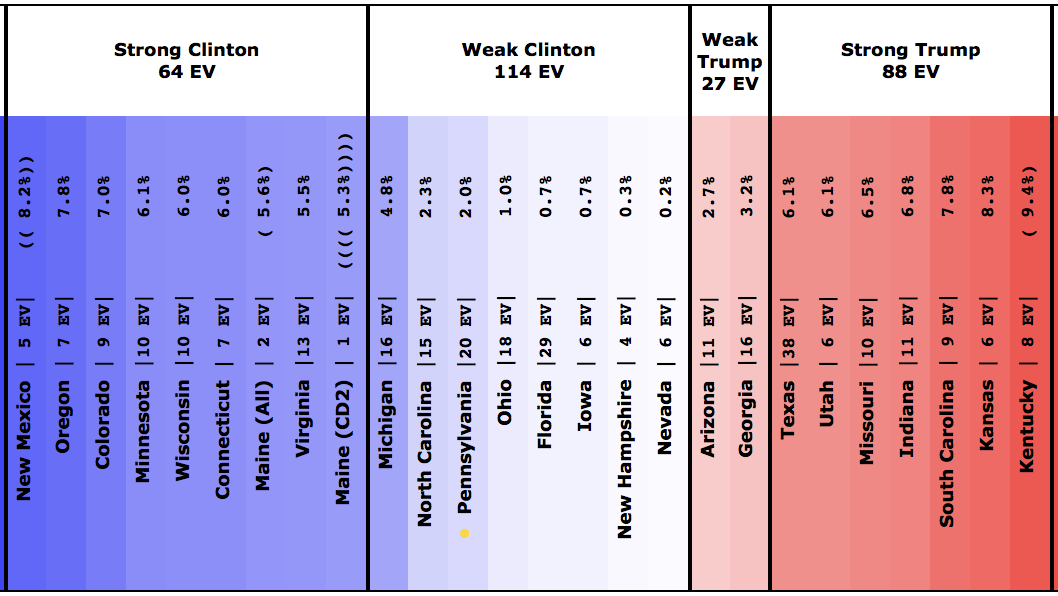
And the map:
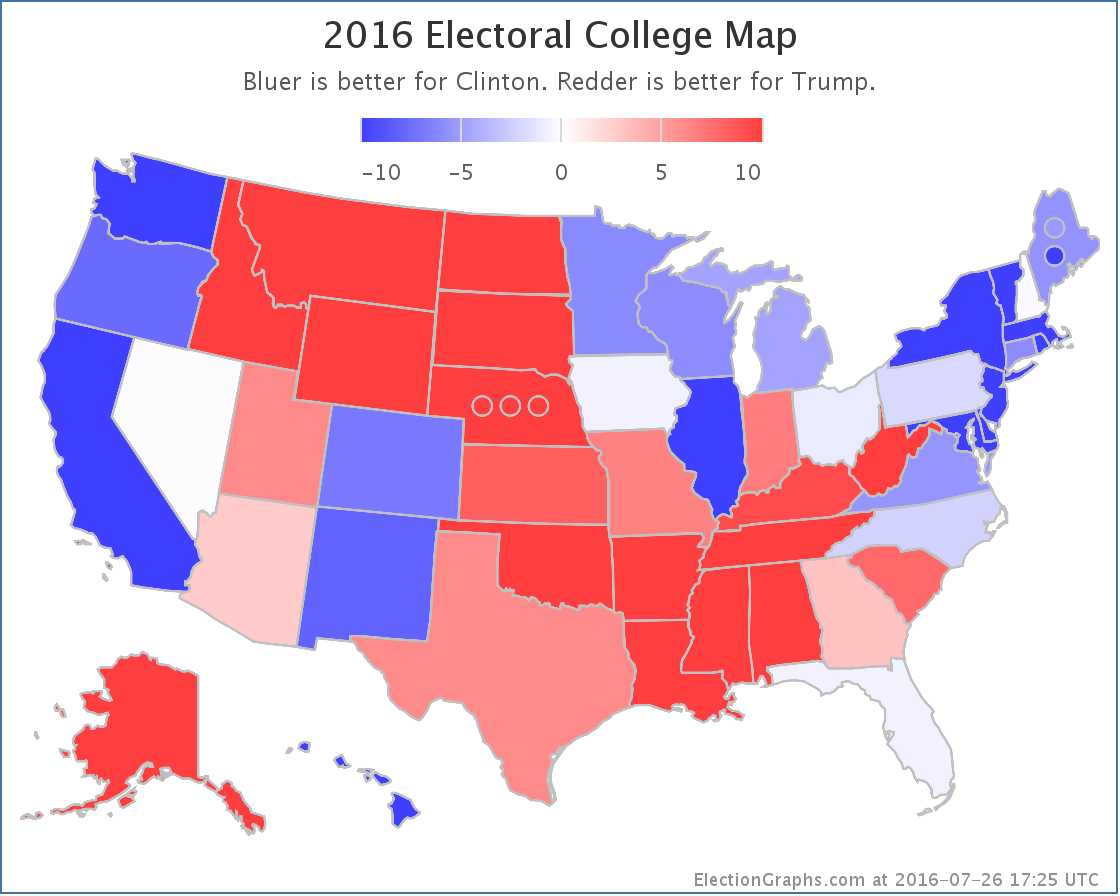
That is a lot of close or almost close states.
105.2 days until polls start to close on election day 2016.
Note: This post is an update based on the data on ElectionGraphs.com. Election Graphs tracks both a poll based estimate of the Electoral College and a numbers based look at the Delegate Races. All of the charts and graphs seen in this post are from that site. Additional graphs, charts and raw data can be found there. Follow @ElectionGraphs on Twitter or like Election Graphs on Facebook to see announcements of updates or to join the conversation. For those interested in individual general election poll updates, follow @ElecCollPolls on Twitter for all the polls as they are added. If you find the information in these posts interesting or useful, please consider visiting the tip jar.
[Blog Post] Electoral College: Bump? Bump? Is there a bump yet? https://t.co/a8EsyYnnW3
RT @ElectionGraphs: [Blog Post] Electoral College: Bump? Bump? Is there a bump yet? https://t.co/a8EsyYnnW3