This is the website of Abulsme Noibatno Itramne (also known as Sam Minter).
Posts here are rare these days. For current stuff, follow me on Mastodon
|
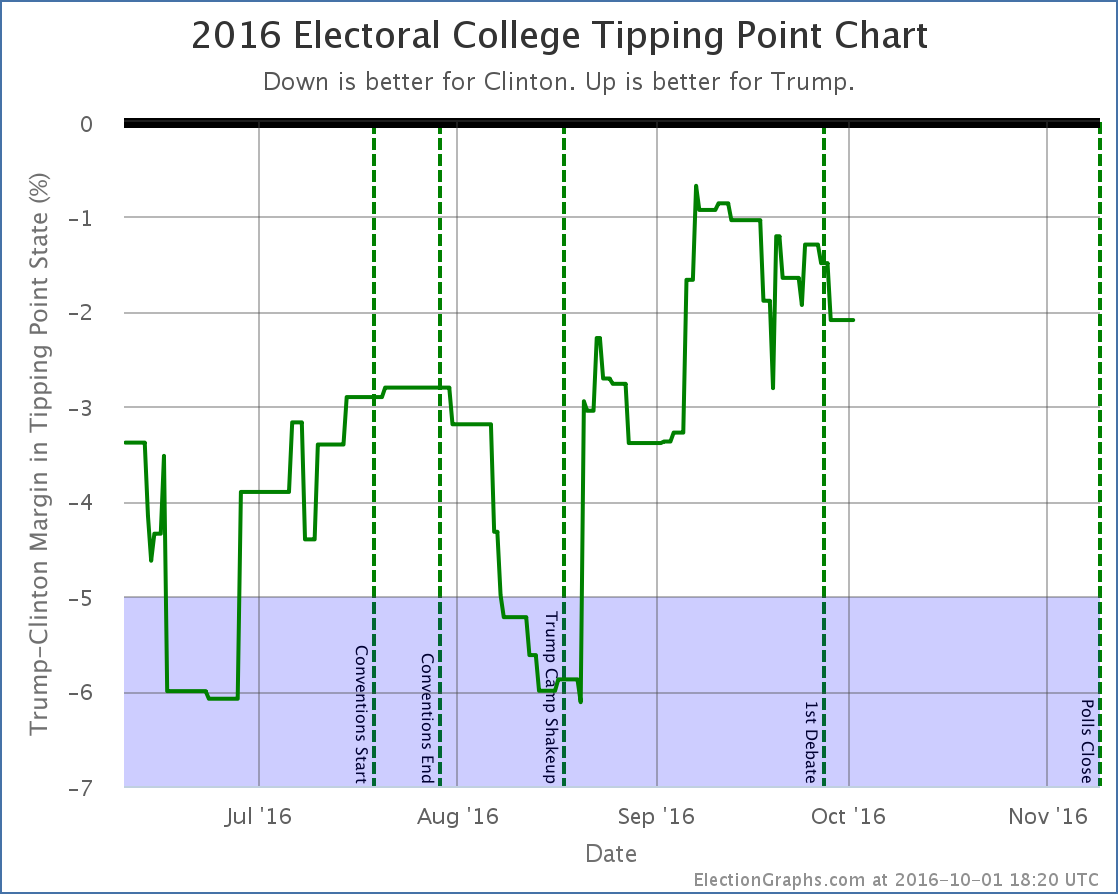
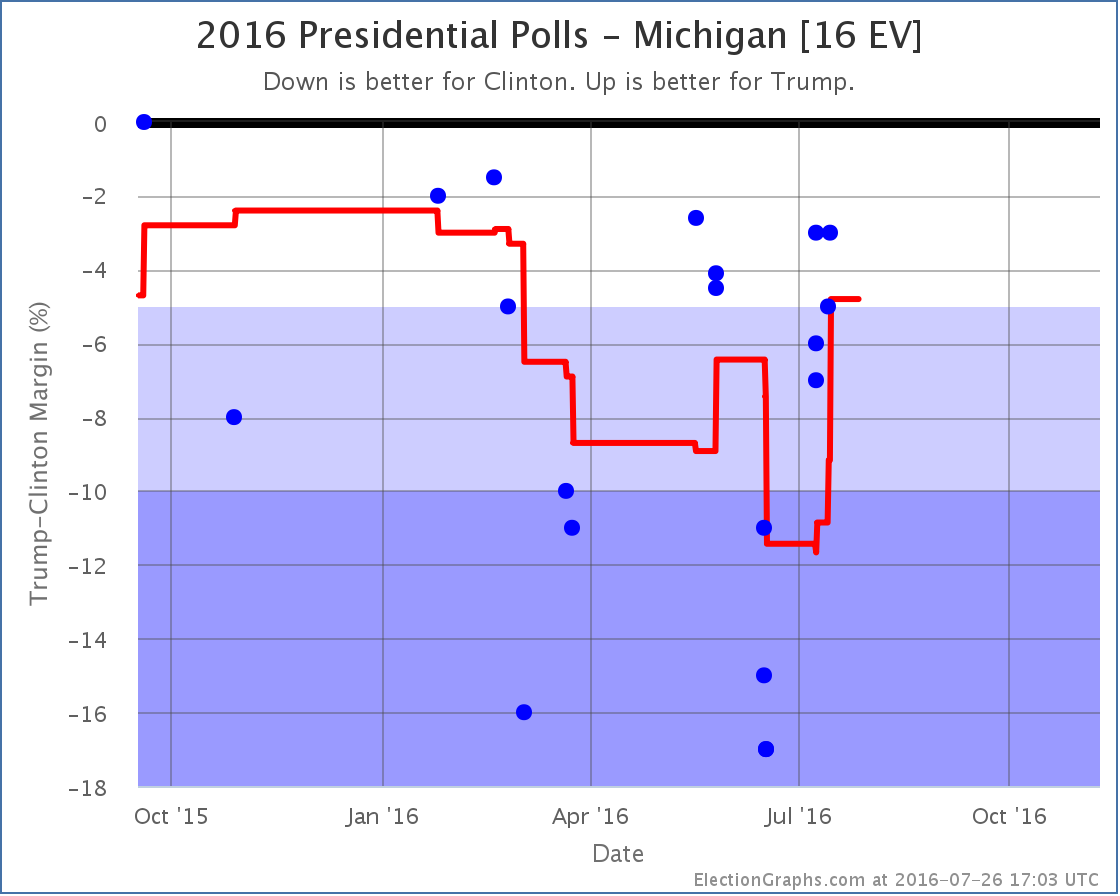
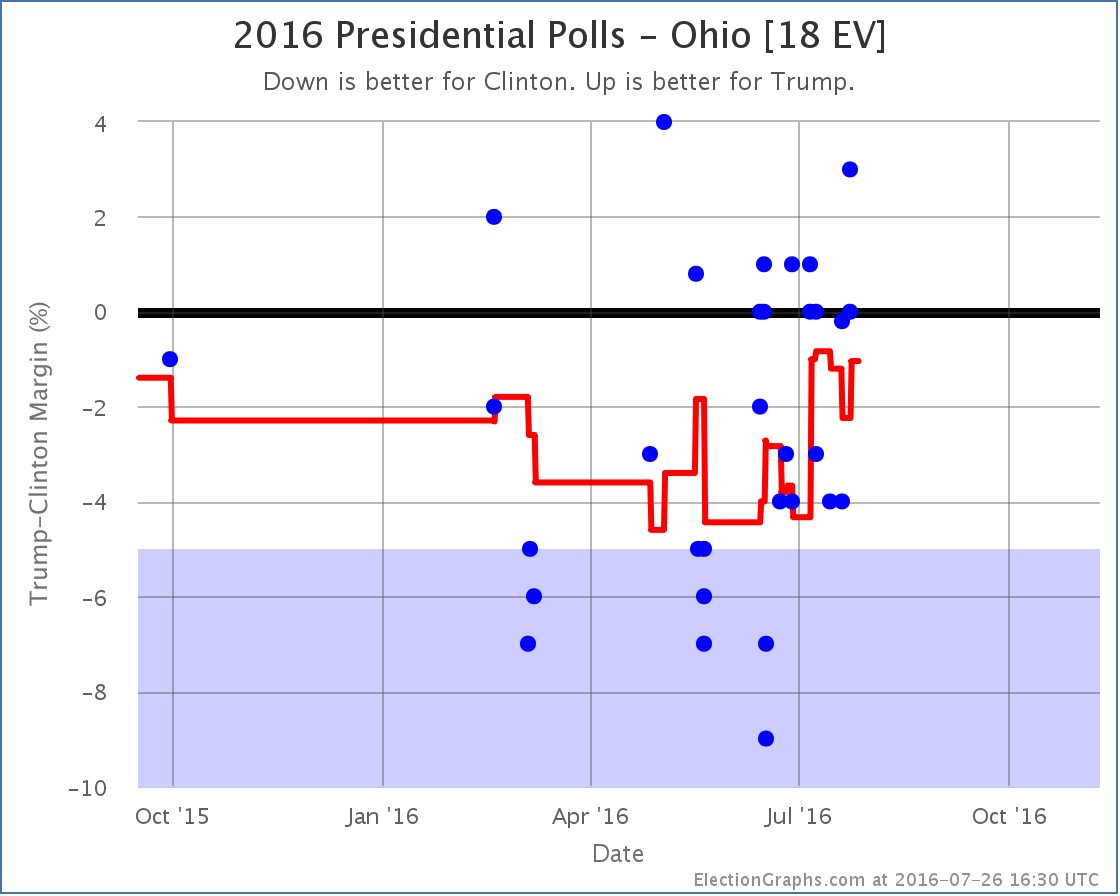
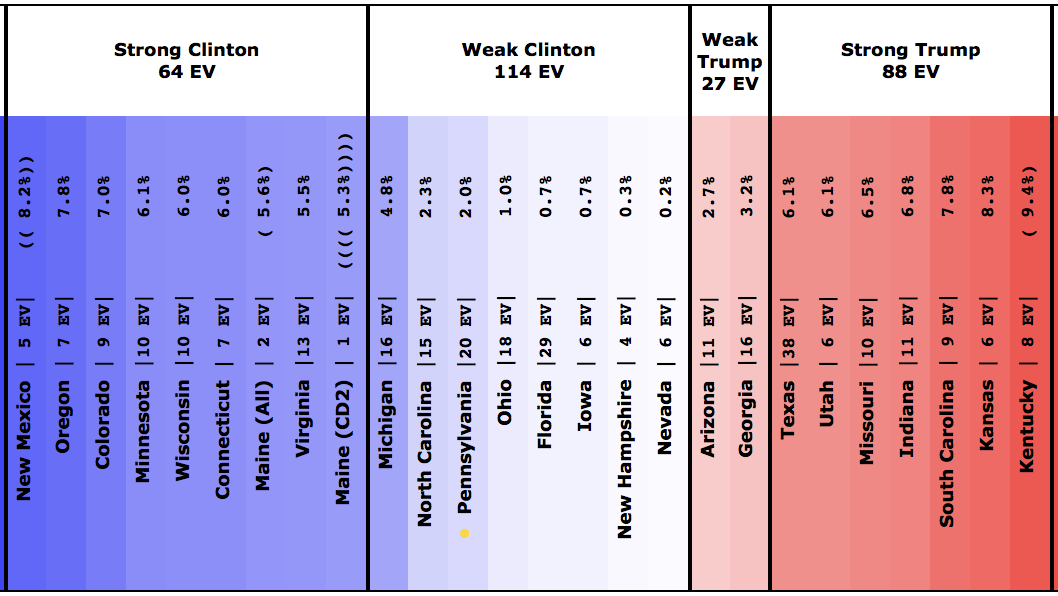
States with new poll data added since the last update: All 50 states, DC, the Maine congressional districts, and the 2nd congressional district in Nebraska.
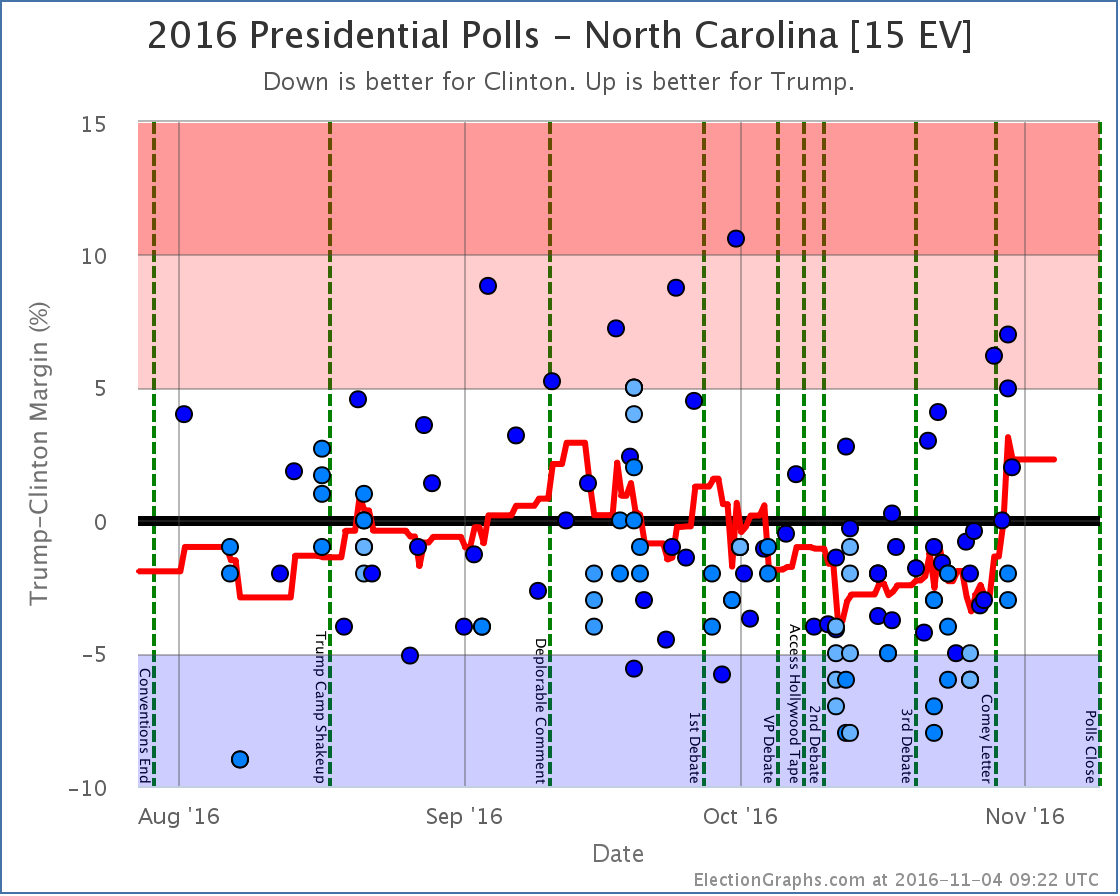
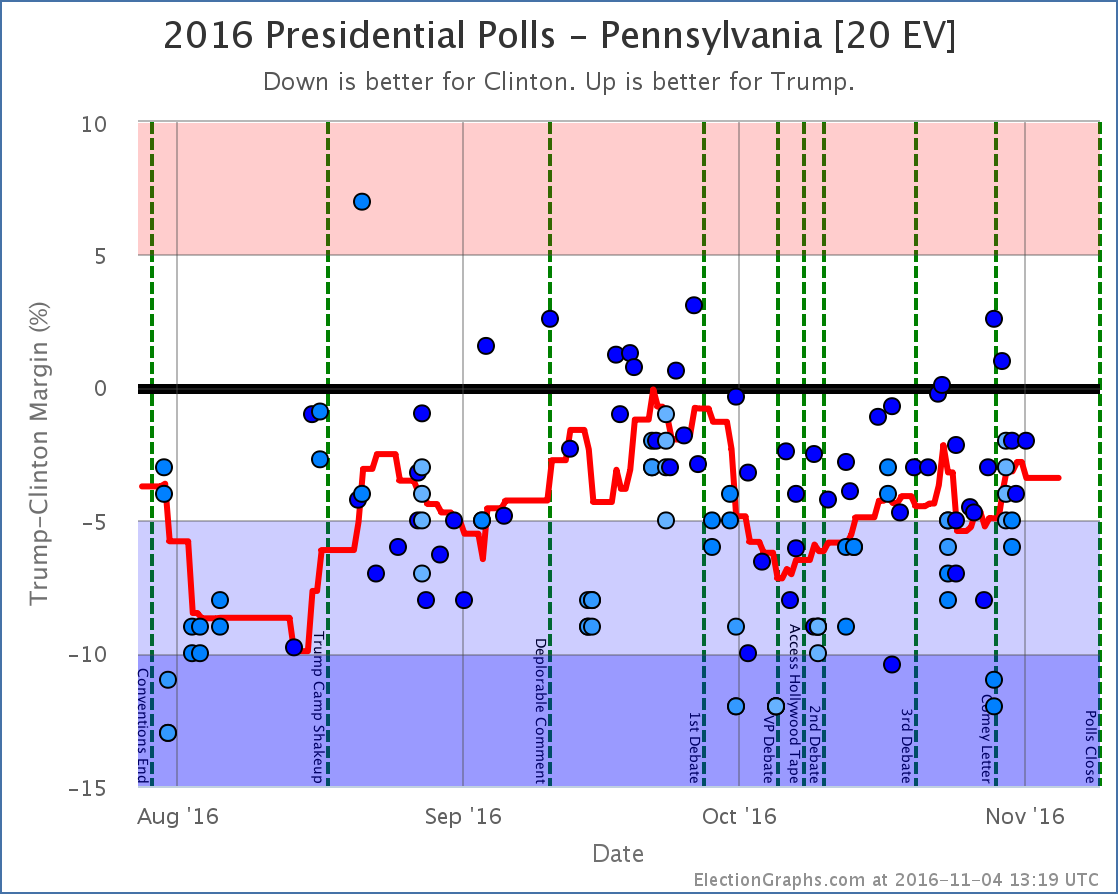
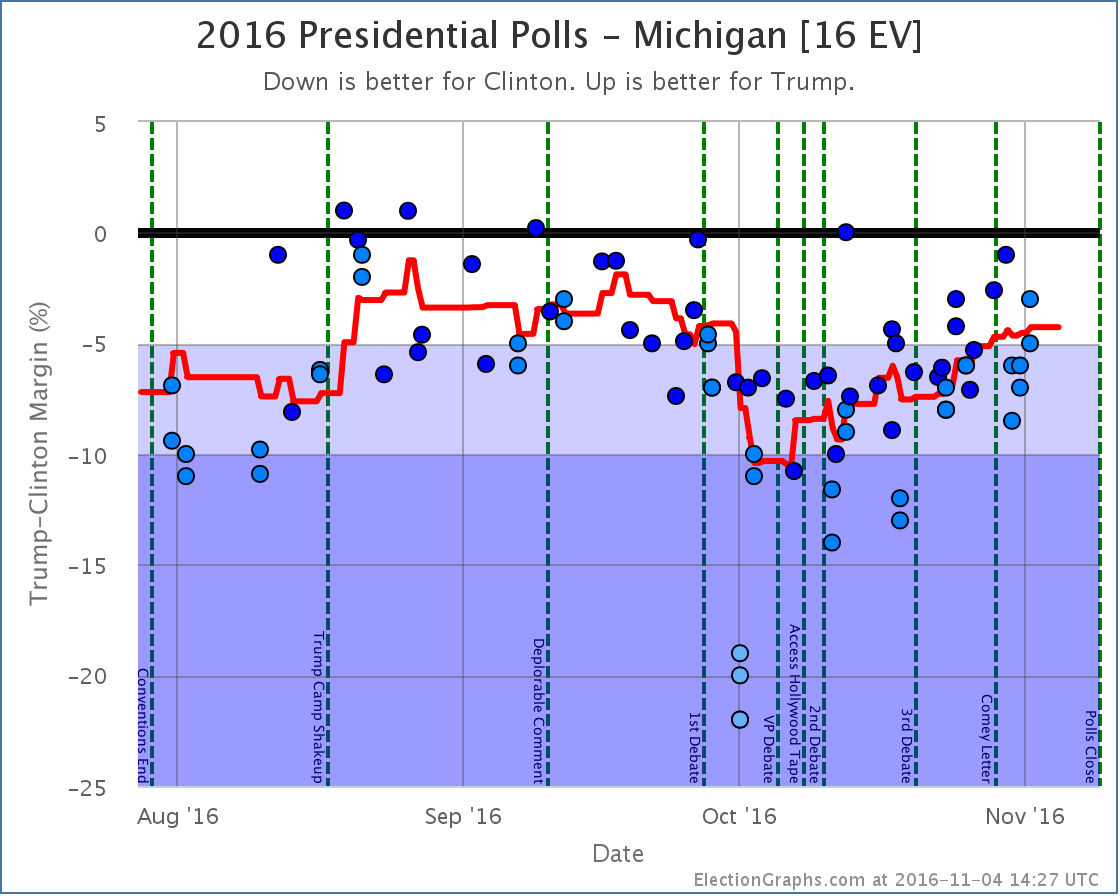
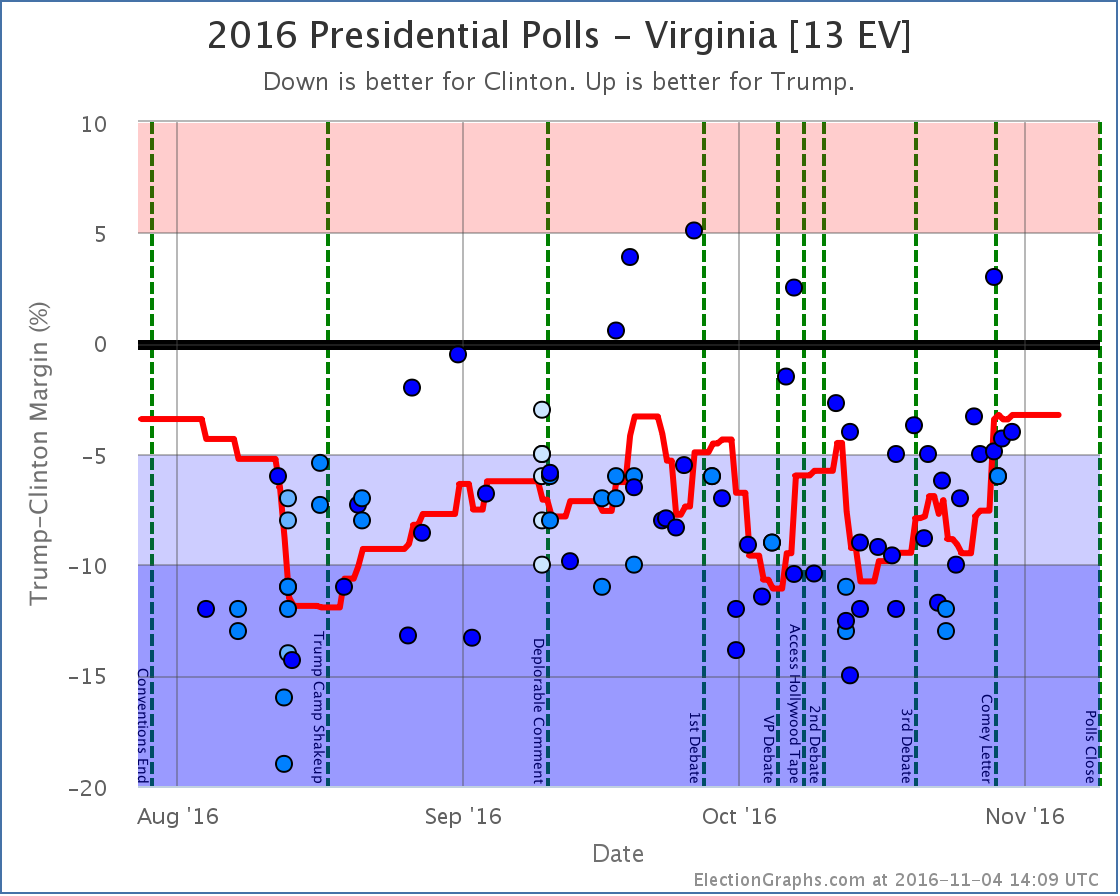
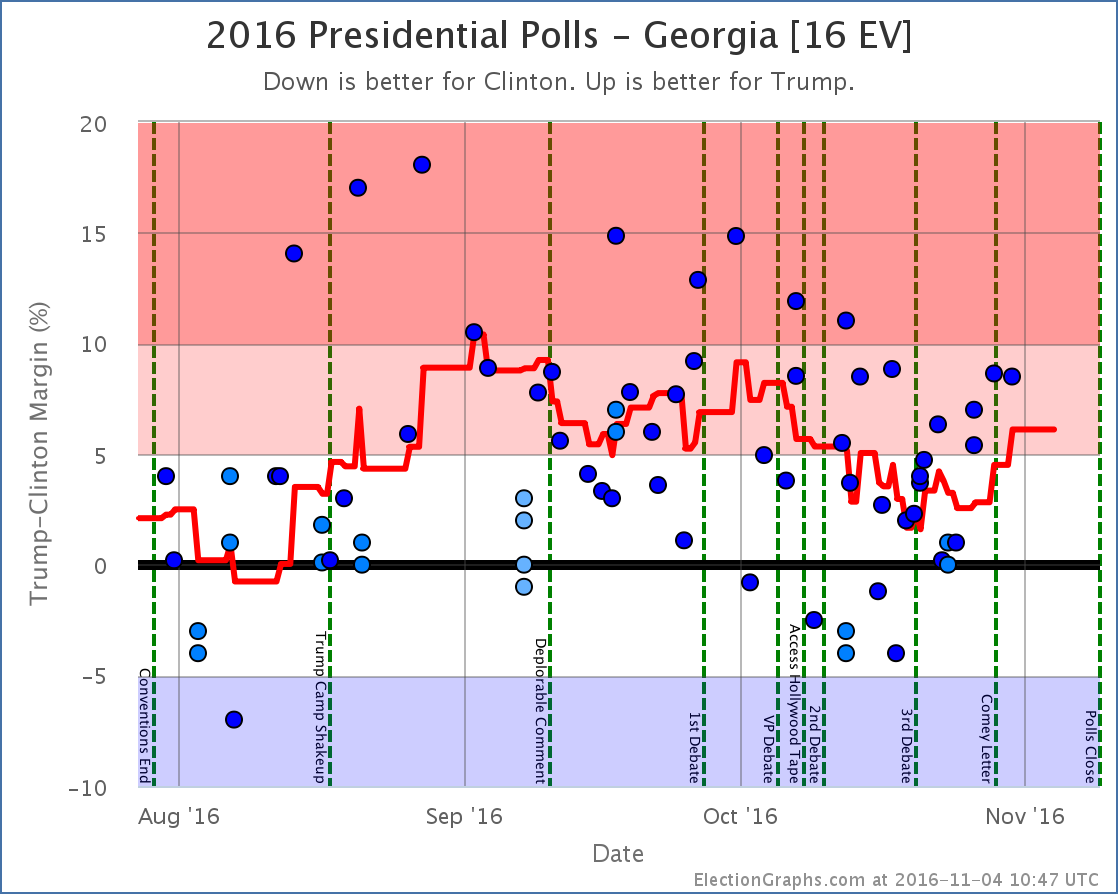
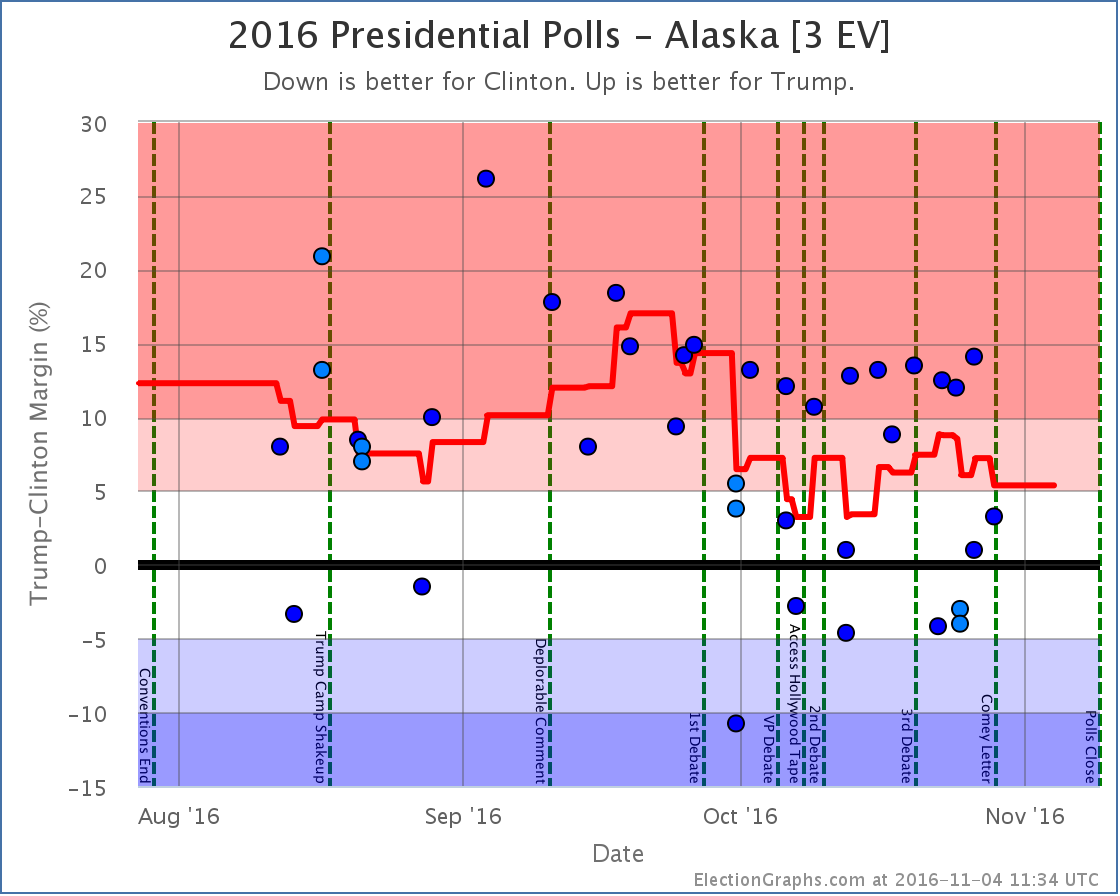
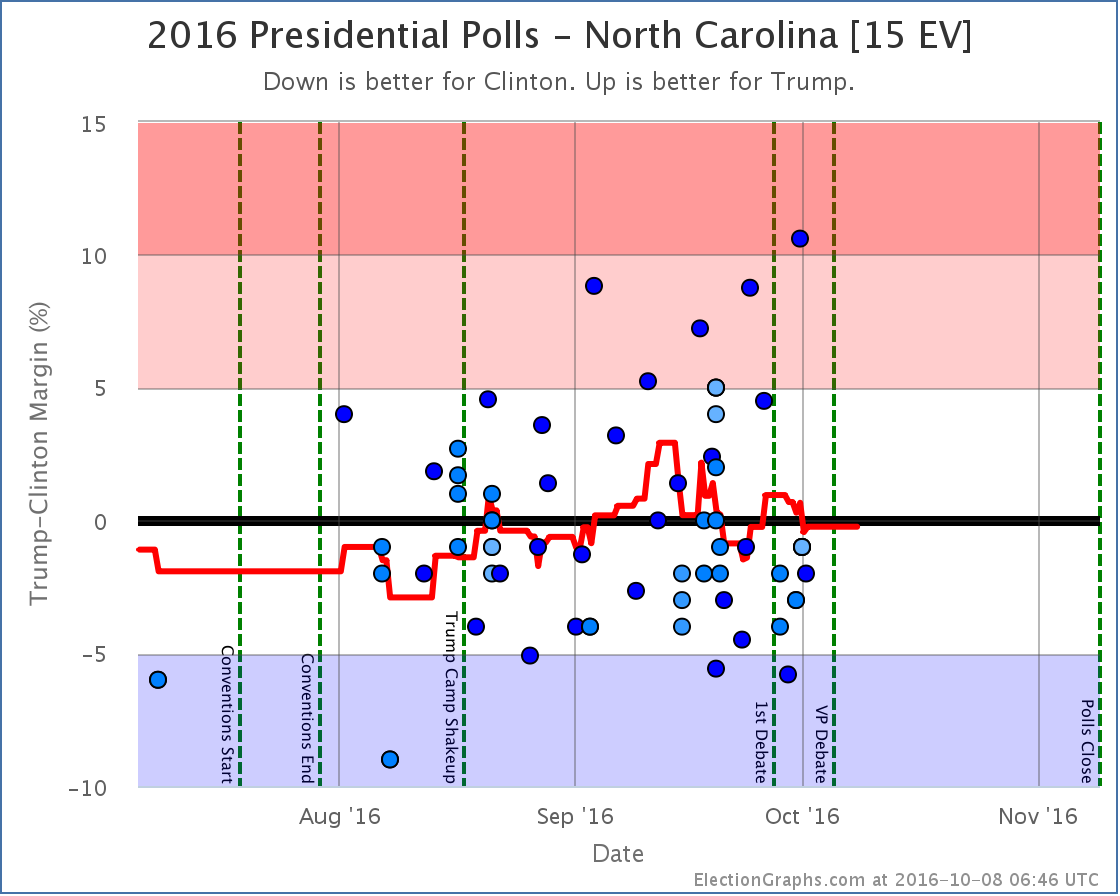
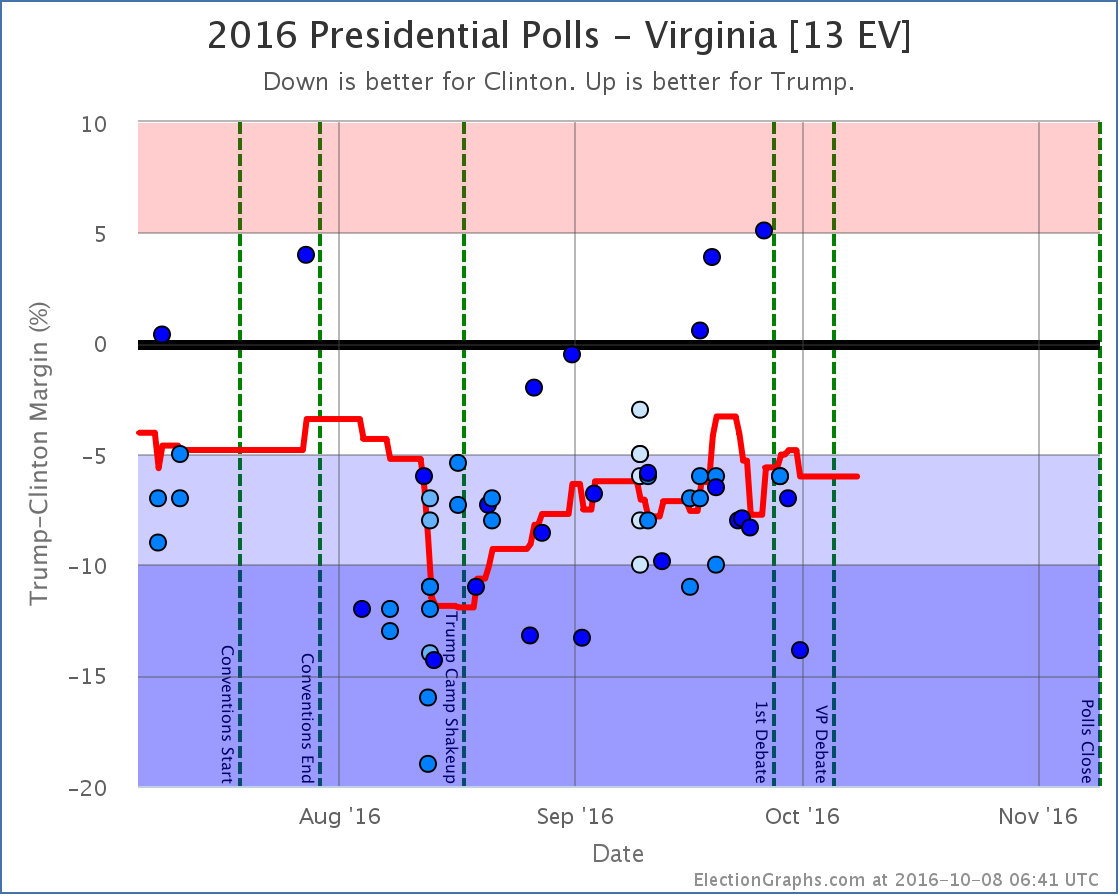
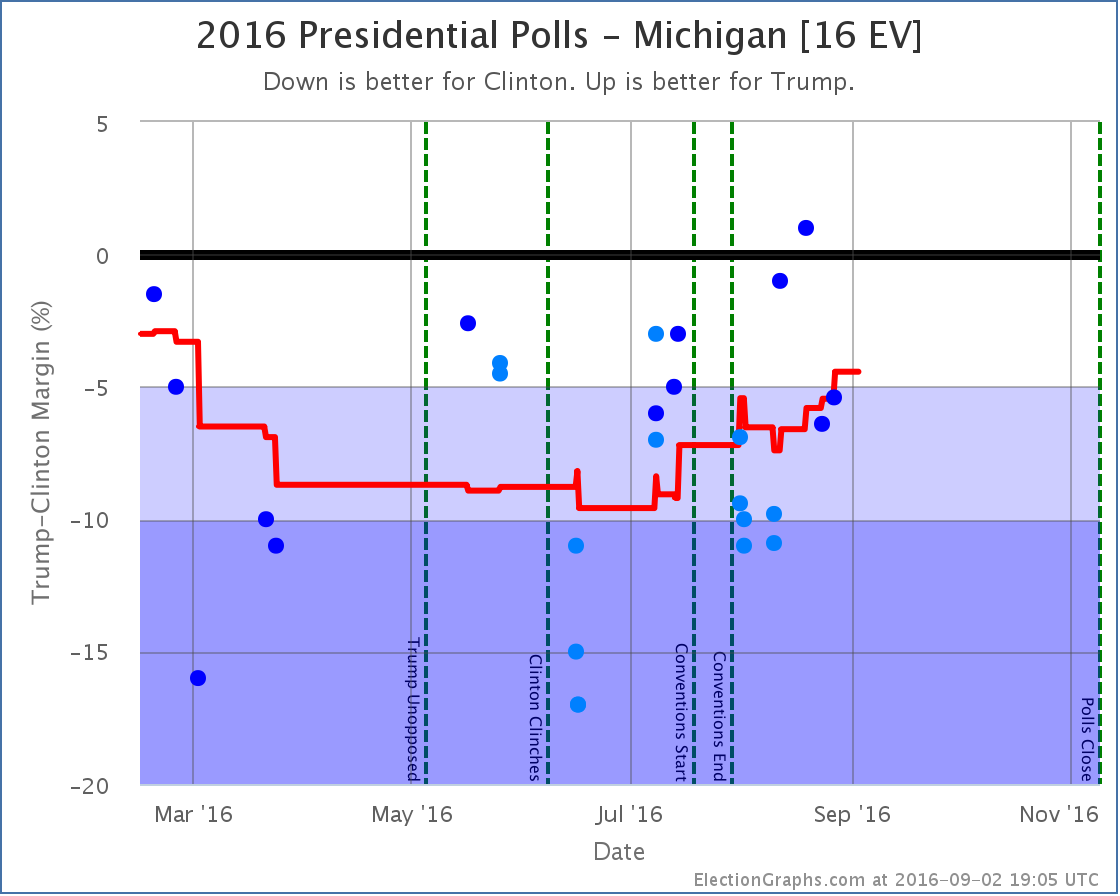
Notable changes in: Pennsylvania (20), Georgia (16), Michigan (16), North Carolina (15), Virginia (13), New Hampshire (4), Alaska (3), and the tipping point.
With the current pace of polling, there are already a number of new polls out since the line was cut for this update. They will of course be included in the next update.
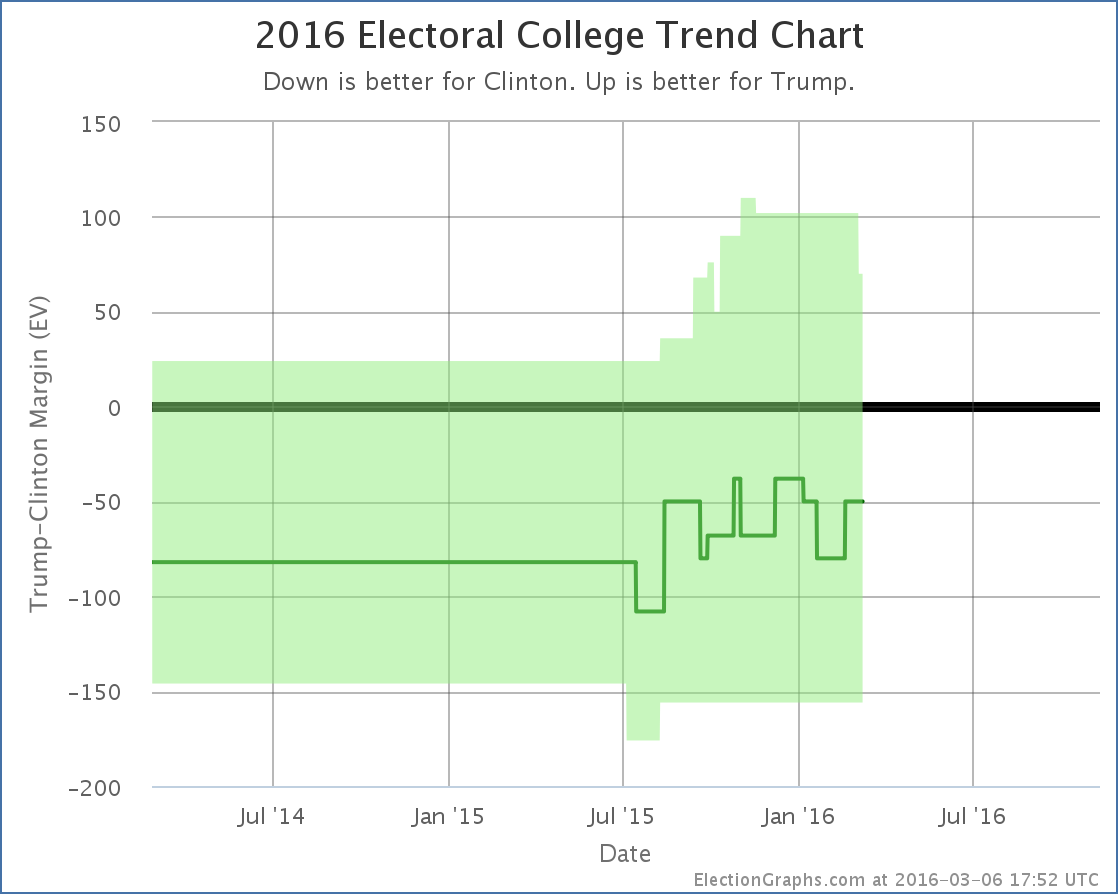
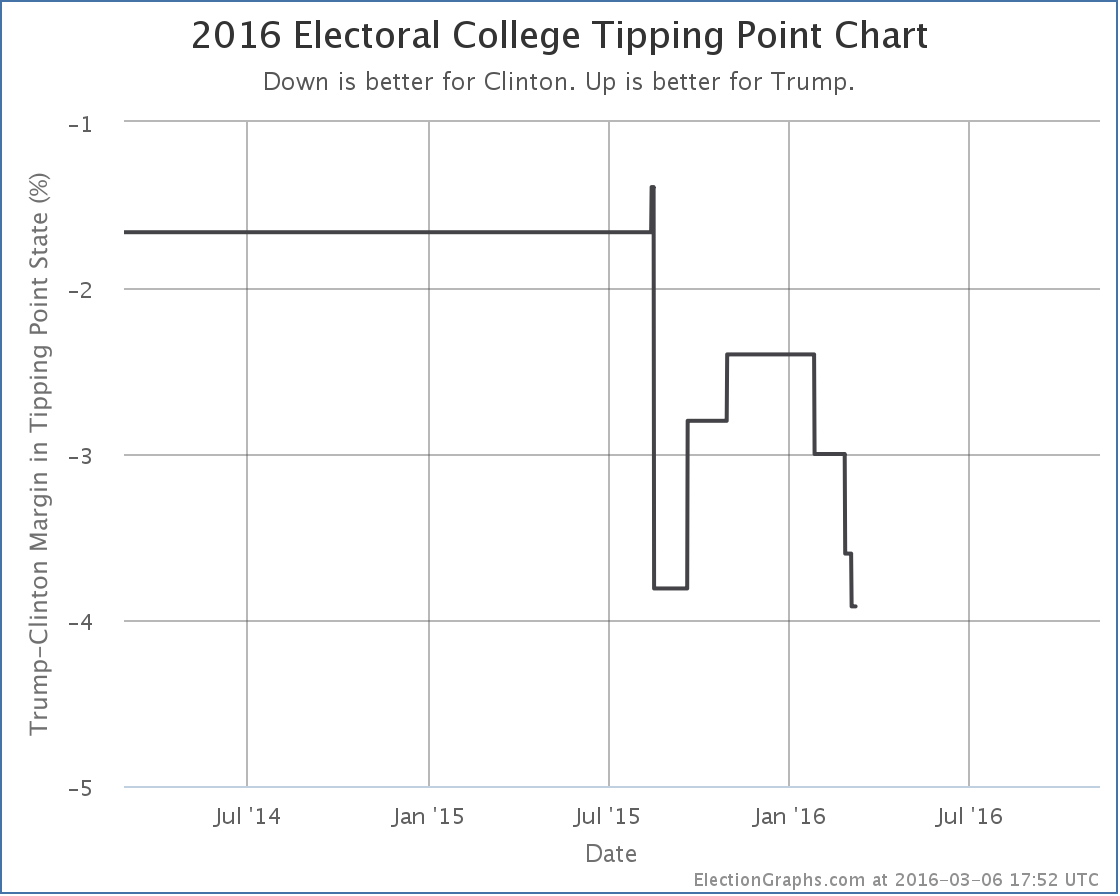
National Summary
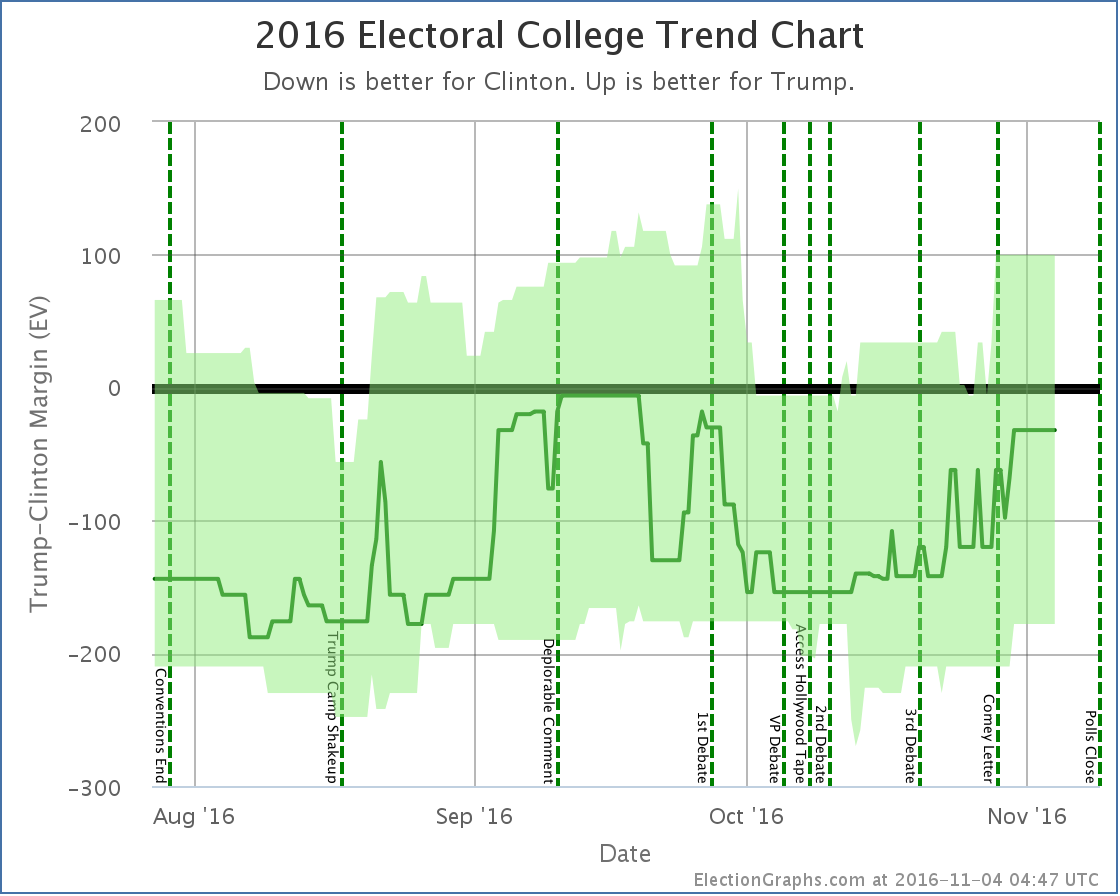
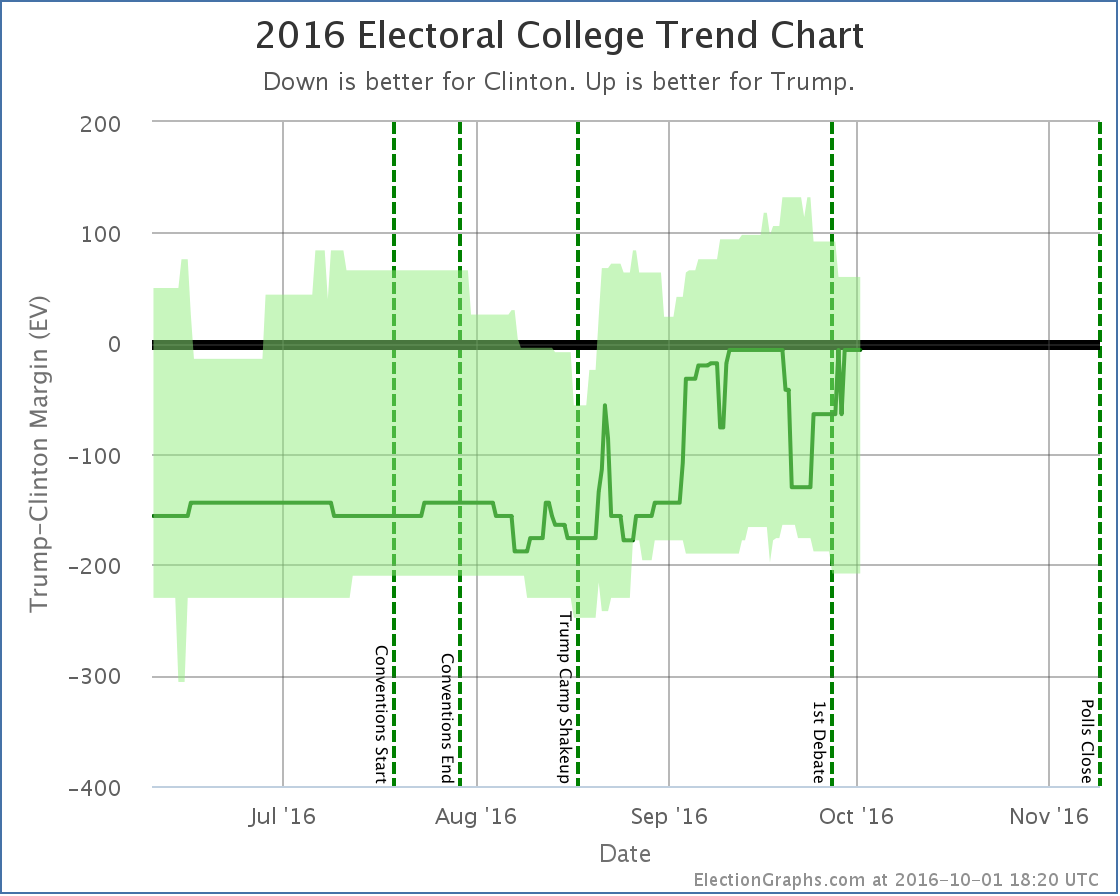
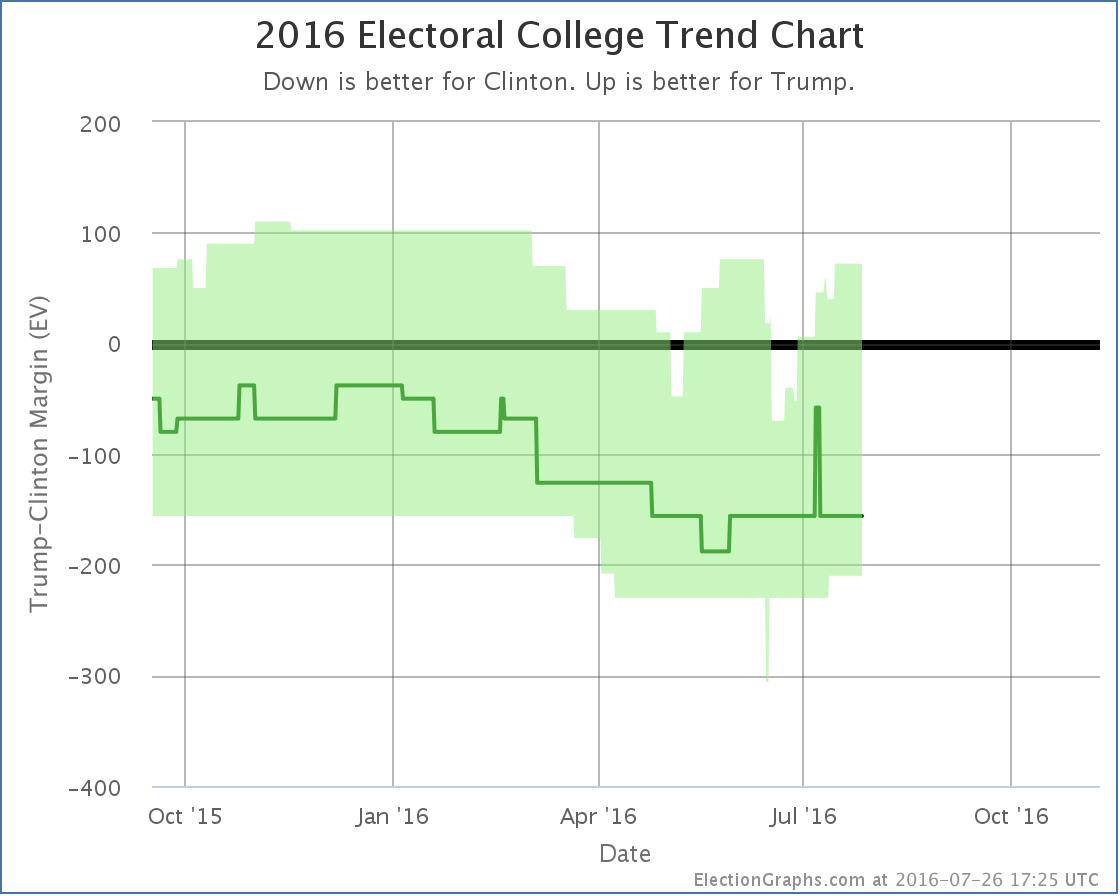
It has been about four days since the last update. Since then the movement has all been towards Trump. Some of this has been movement from polls taken primarily after the Comey letter, but a some of it also represents movement that was already happening when that news broke.
Good for Trump:
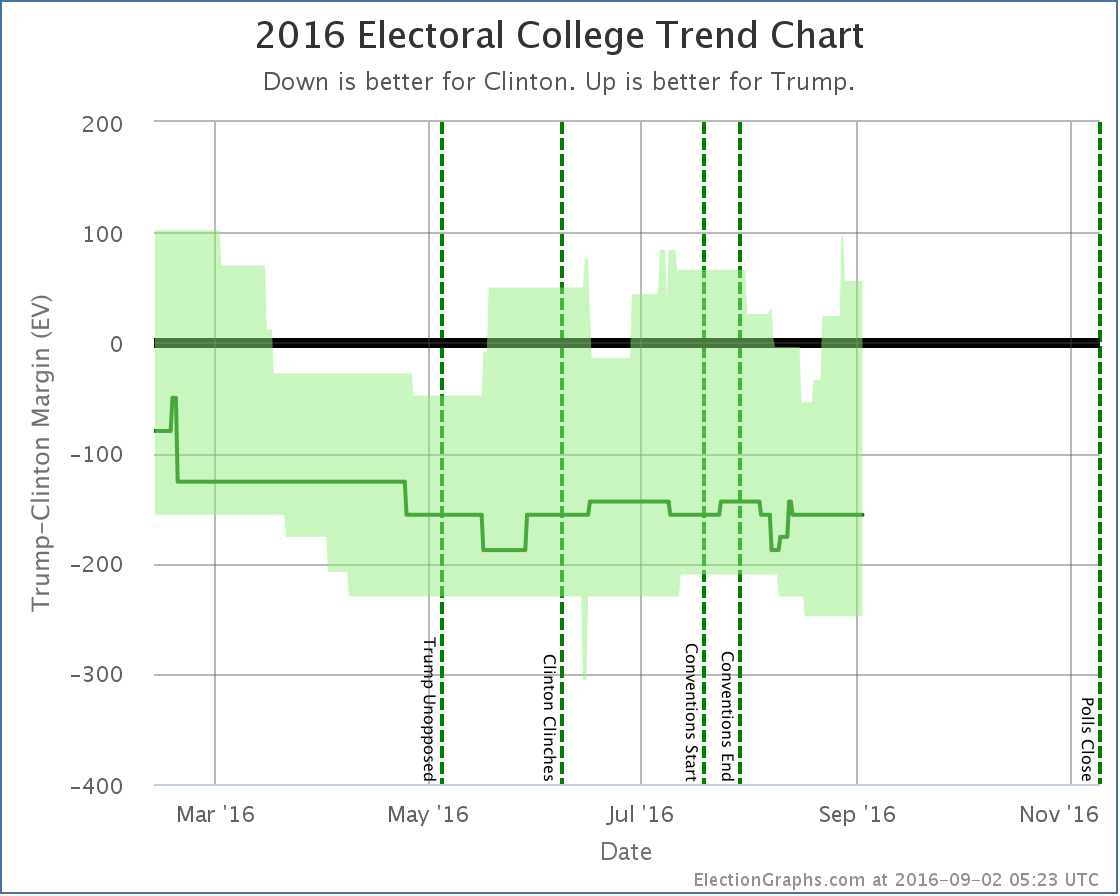
- The expected result has moved from a 62 EV Clinton win to only a 32 EV Clinton win
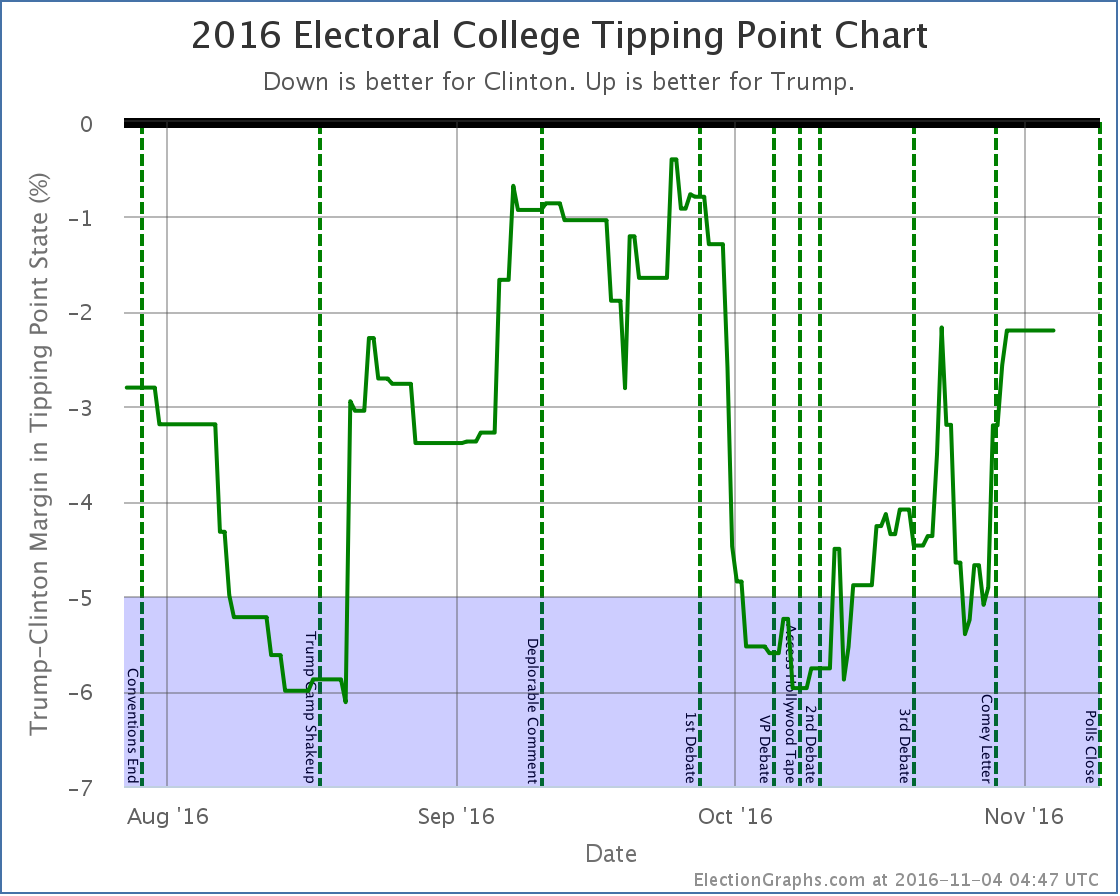
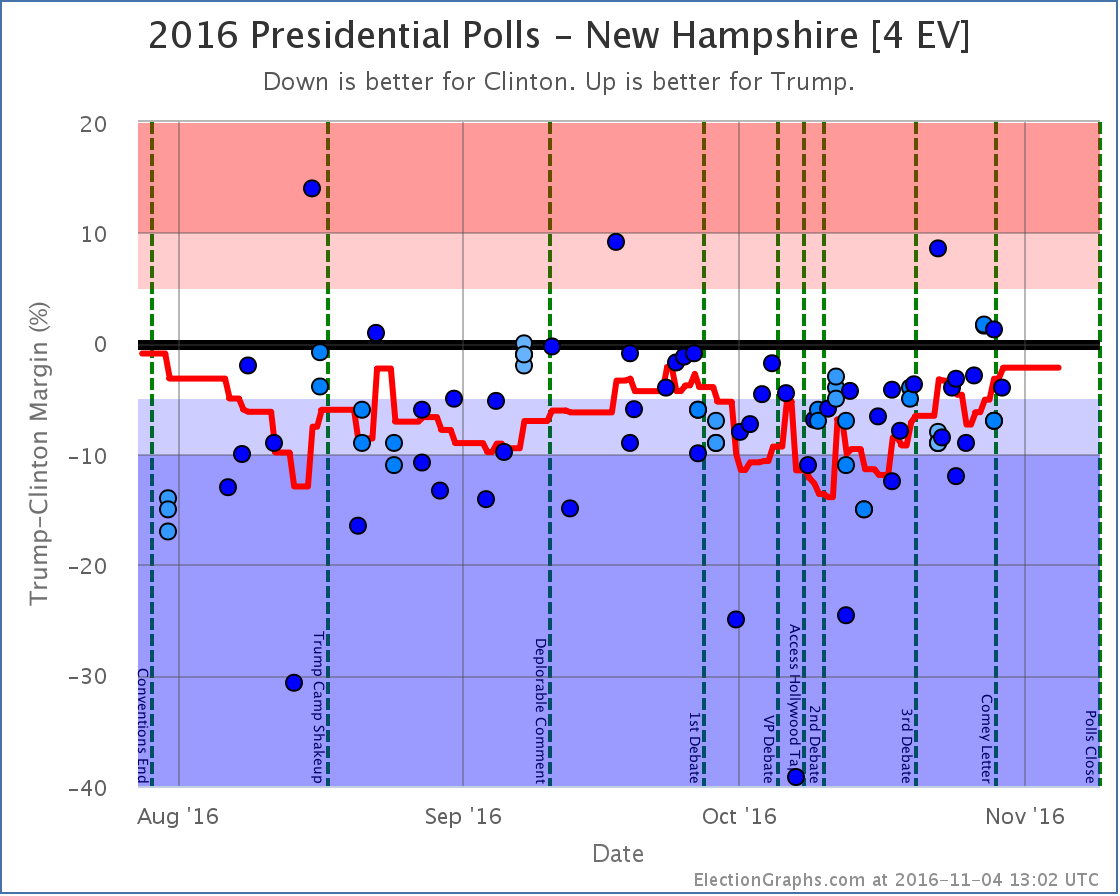
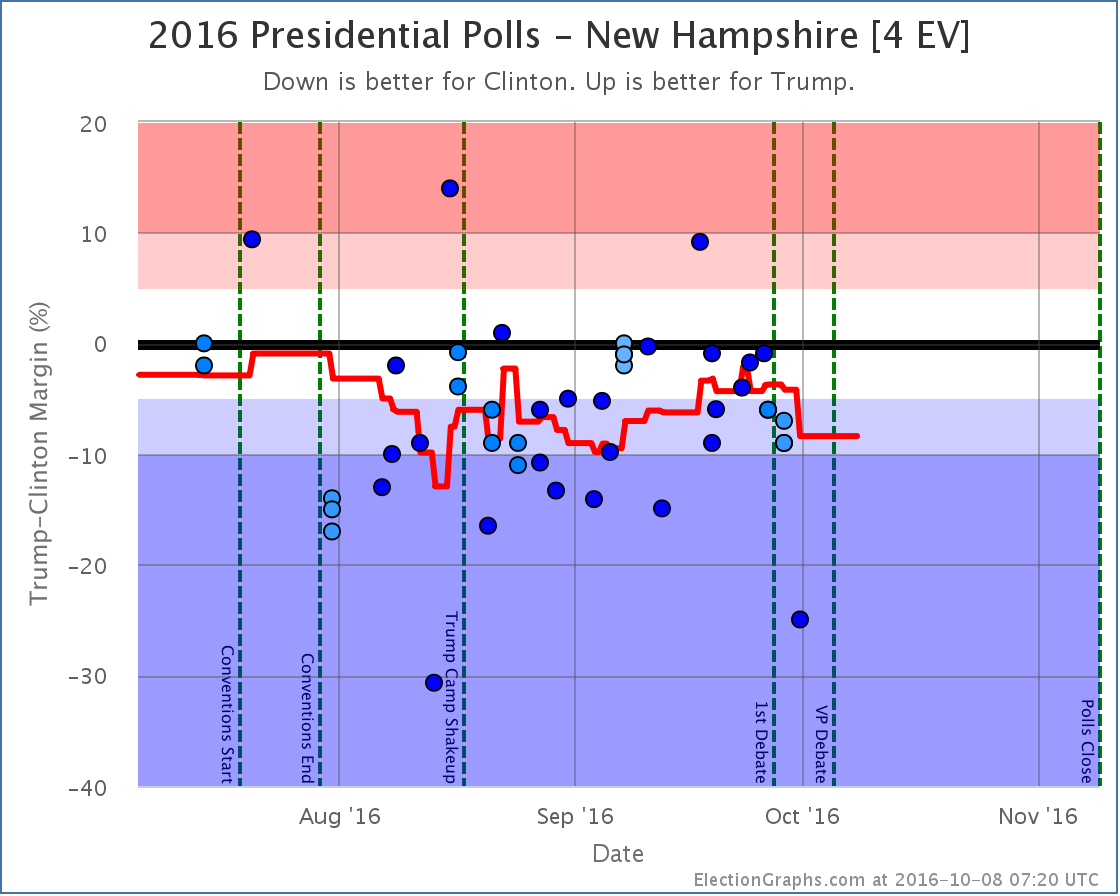
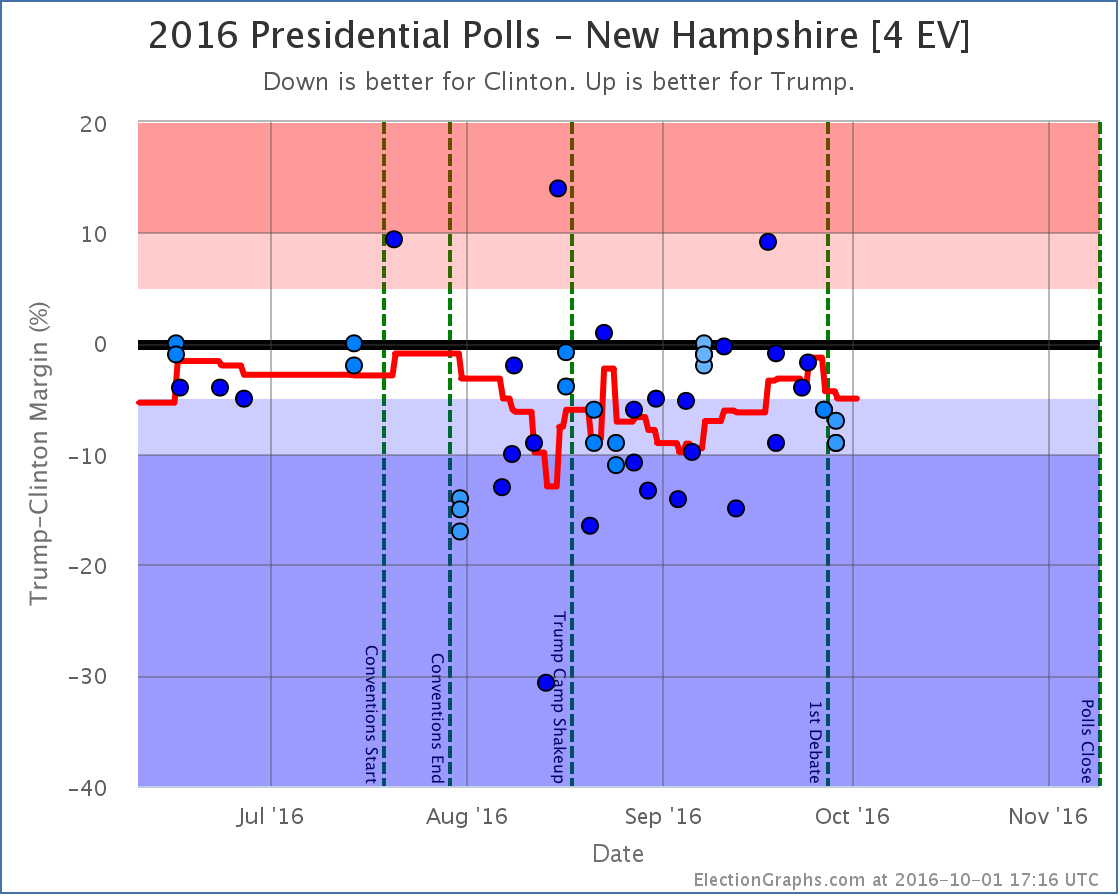
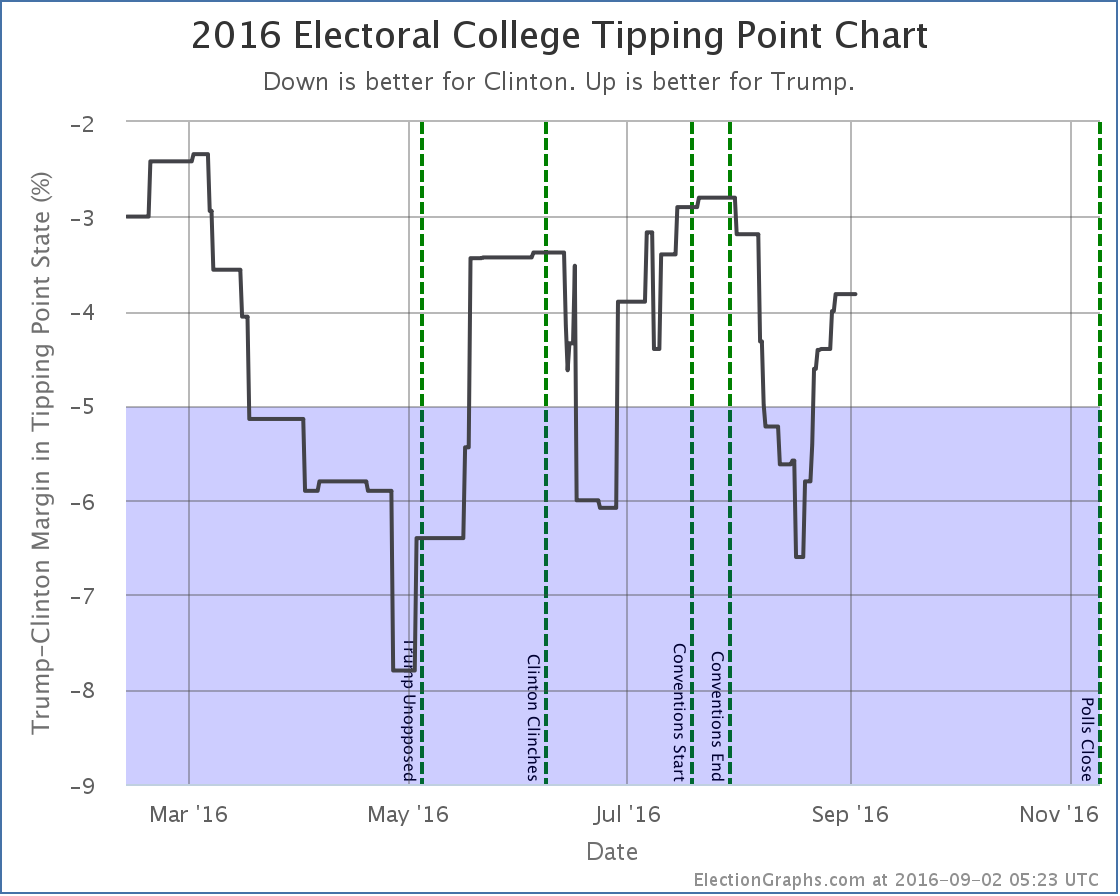
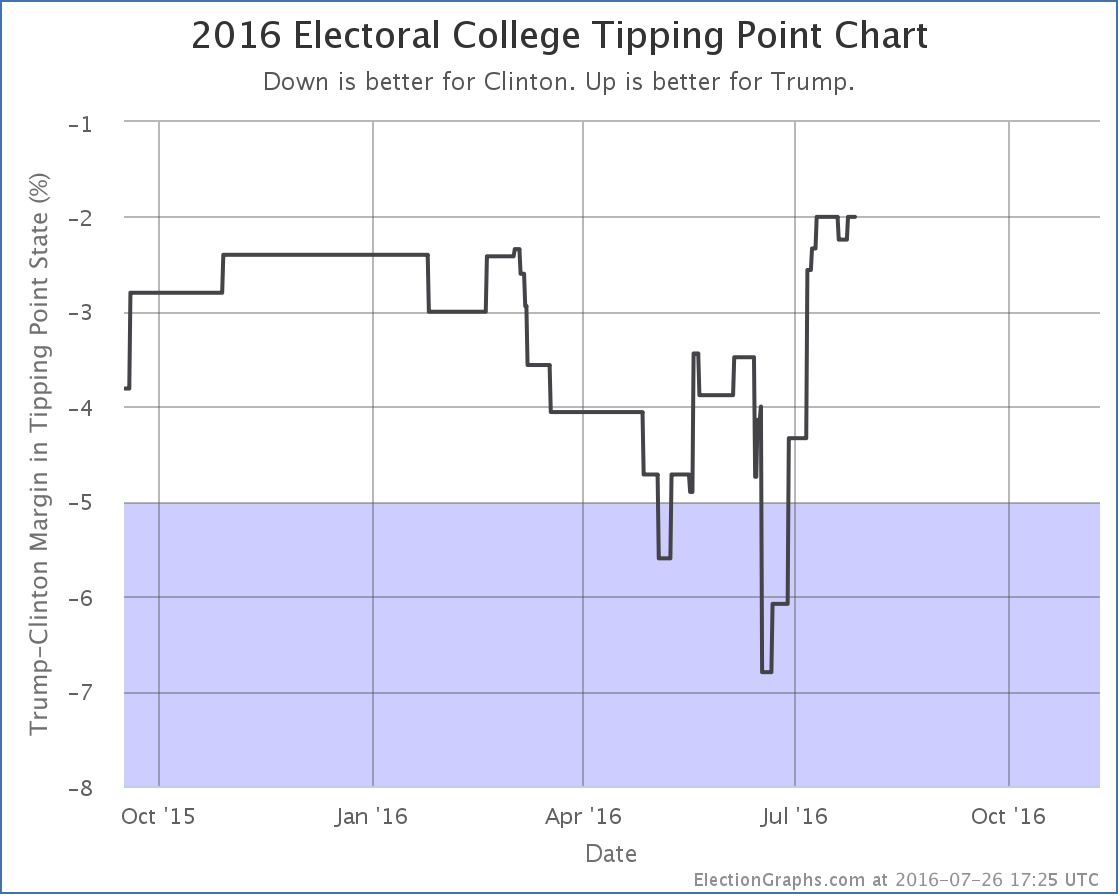
- The tipping point has moved from Clinton by 5.3% in PA to Clinton by only 2.2% in NH
- Clinton’s best case has declined from a 216 EV win to only a 178 EV win
- Trump’s best case has shifted from a 6 EV loss to a 100 EV win
Charts
Discussion
Four days ago Trump had tightened the expected electoral college case, but critical states like Pennsylvania were moving against him, so the job of getting to 270 electoral votes was actually getting harder despite the electoral college gap narrowing.
Not so any more. In the last few days, which added lots of post-Comey polls (as well as some covering the pre-Comey period too) the movement has ALL been toward Trump. There is no mixed message this time. No bright side for Clinton. In the last few days almost all of the polling news has been good for Trump and bad for Clinton.
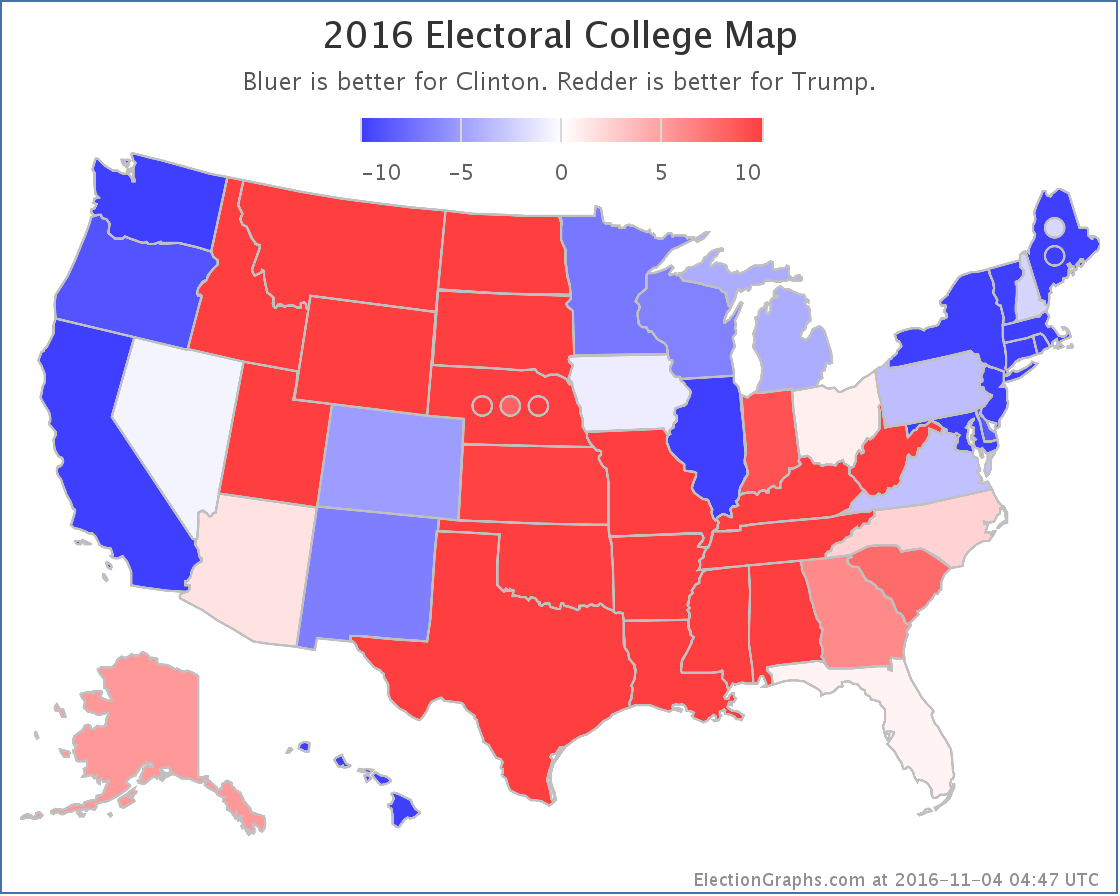
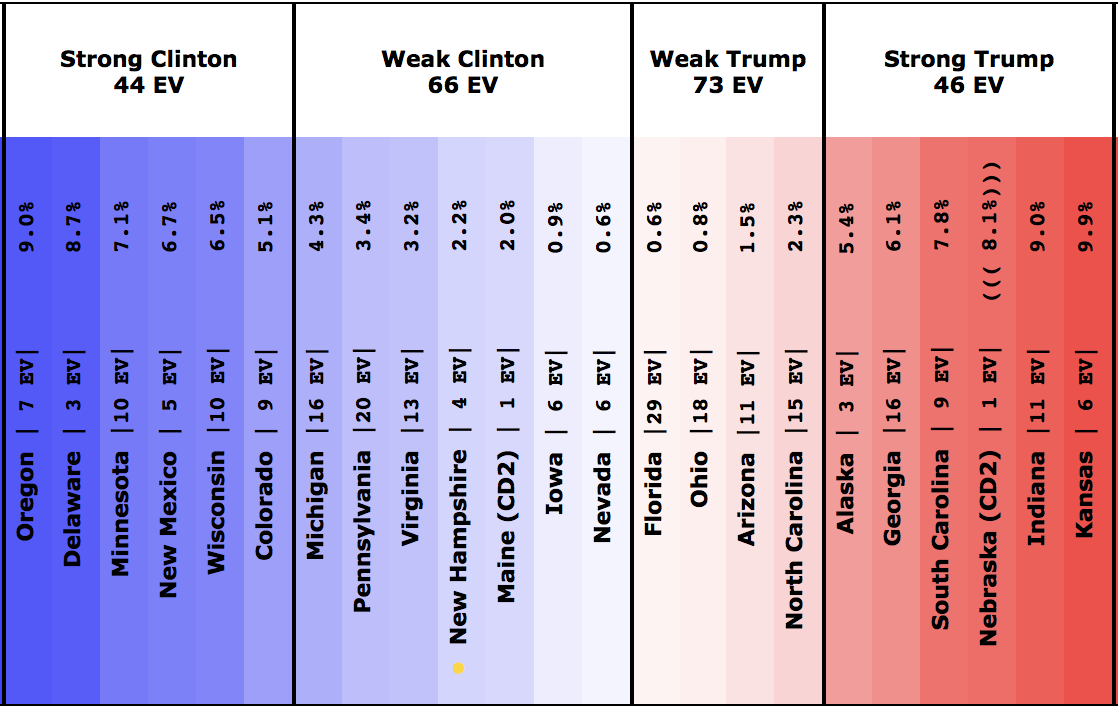
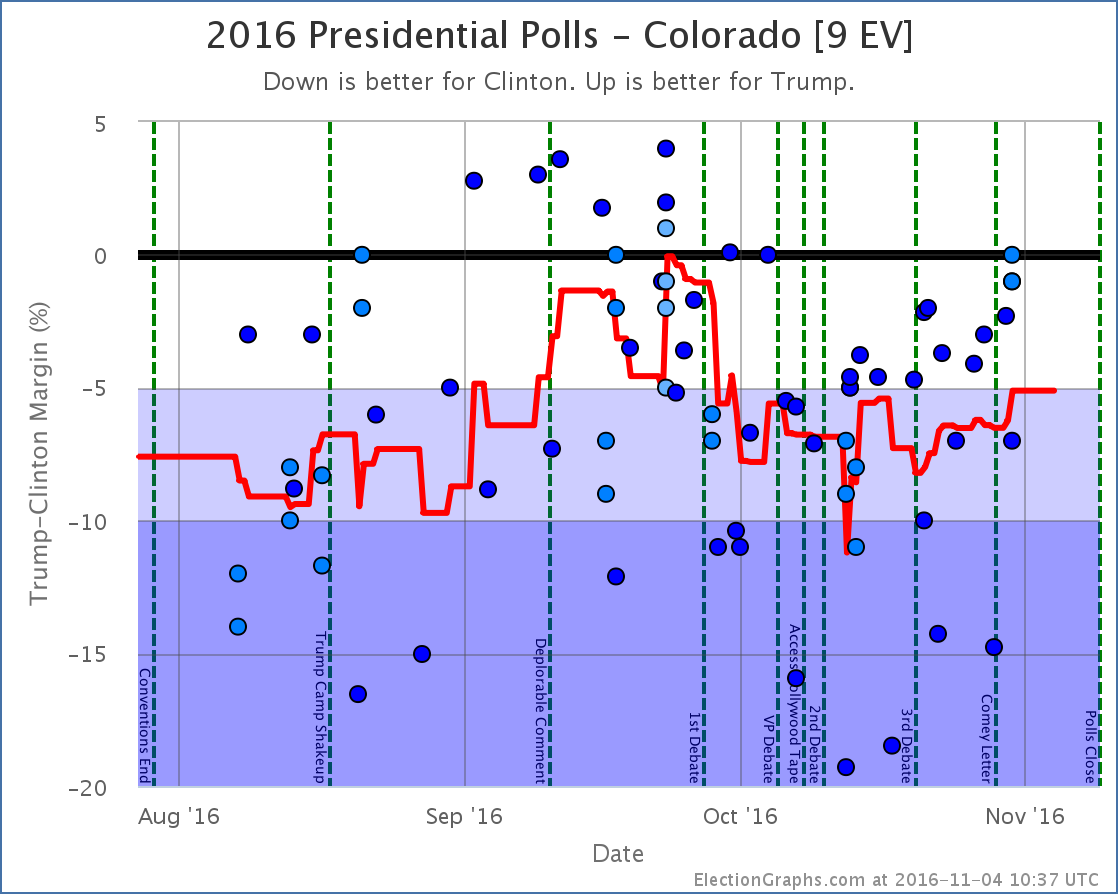
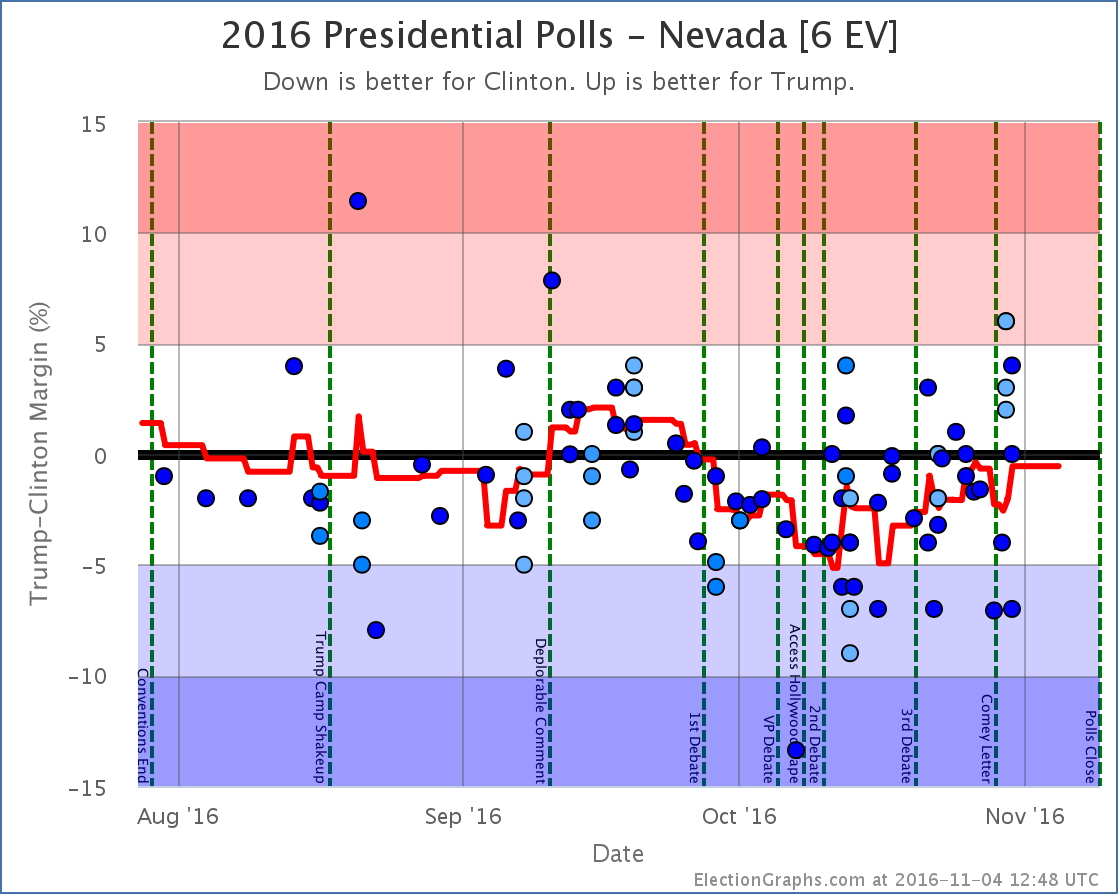
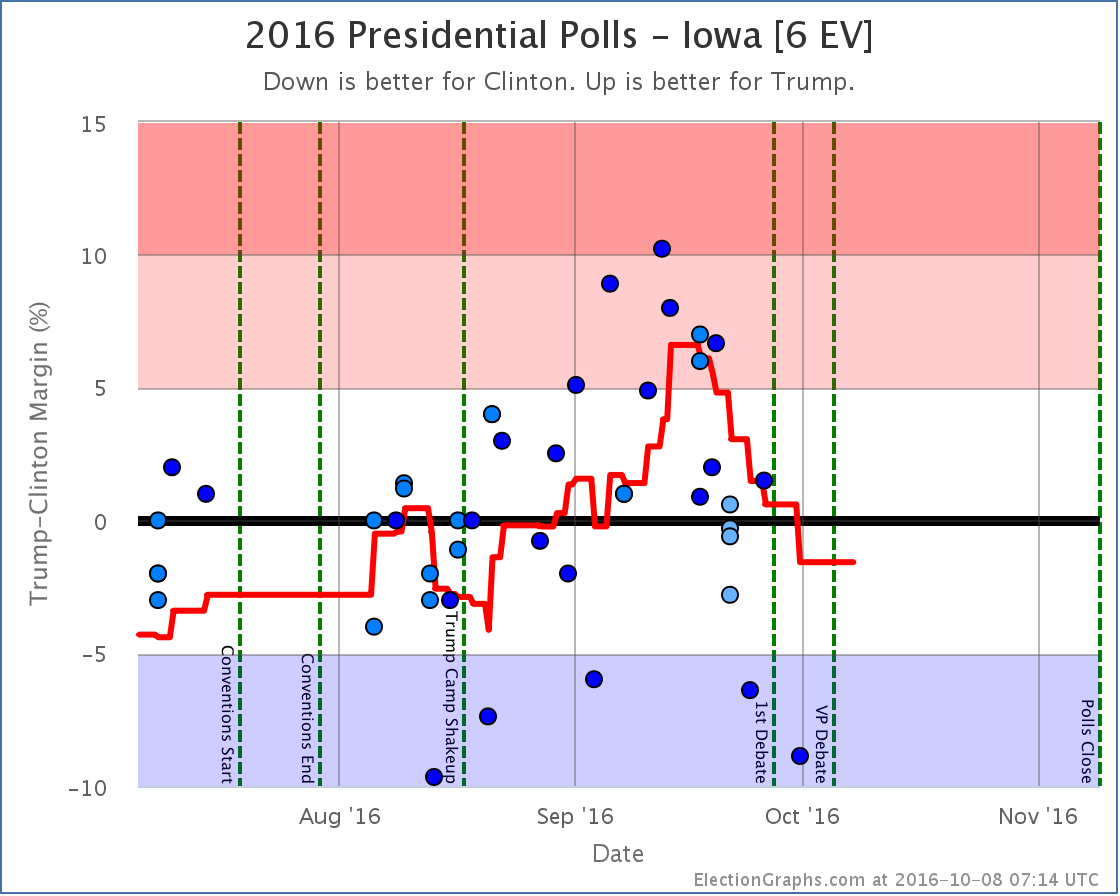
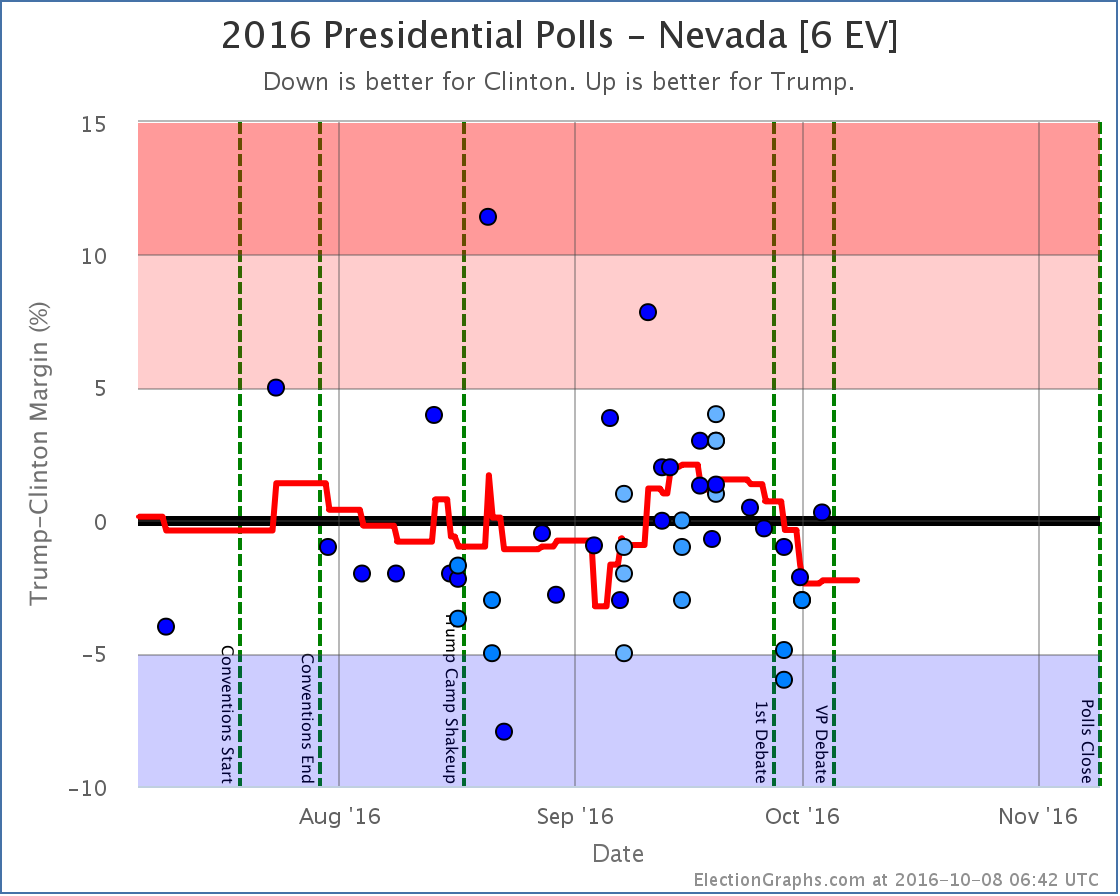
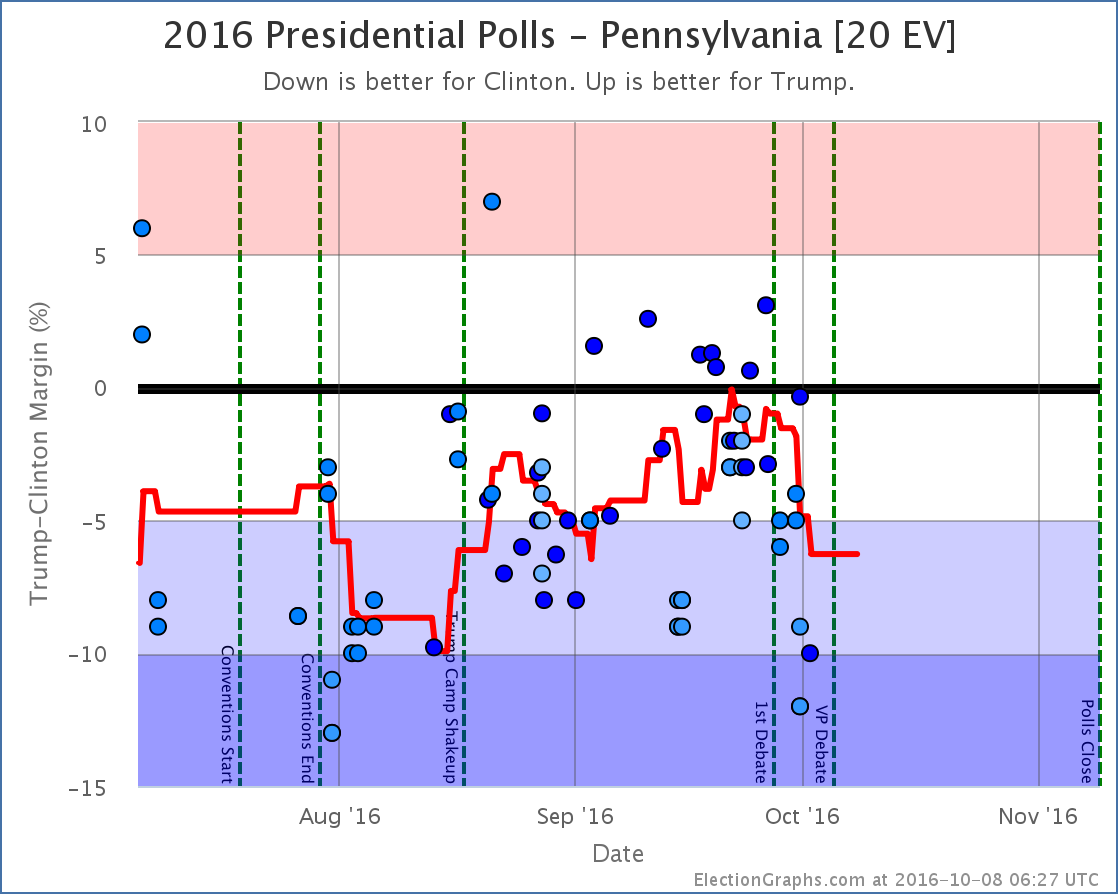
Now, she is still ahead. But Trump once again has a path. The “easiest” path at this point would be to win all the states he is currently leading, then pull in Nevada (0.6% Clinton lead), Iowa (0.9% Clinton lead) and New Hampshire (2.2% Clinton lead). Or he could get any one of those states, plus Virginia (3.2% Clinton lead). Or just Pennsylvania (3.4% Clinton lead). Or just Michigan (4.3% Clinton lead).
All of these states are ones where a few days ago Clinton’s lead was much stronger. Trump has been making gains all over the map.
How much of this is Comey? Some for sure, but as I’ve pointed out before, the expected electoral college been moving slowly toward Trump for weeks. But that did seem to have somewhat stalled out. The tipping point was moving back toward Clinton. With the Comey letter the move toward Trump came back with a vengeance.
We’re not quite at Trump’s highs from September, but we are getting near there. Now, even at his best point in September, Trump was still losing to Clinton. But it was close. And it is close again now. The Trump surge is real, and he has made this a race again.
The tipping point is at 2.2%. That is within the zone where a systematic polling error or a last minute news event that happens too late to be captured in polls could reverse the result. A Trump win COULD happen. This is not impossible.
Clinton is still heavily favored though.
This site does not produce “odds”, just the range of “you shouldn’t be completely shocked” outcomes, which is intentionally pretty wide. Right now, a Clinton win is expected, but a Trump win is not out of the question.
Lots of places do produce odds though. Here is the current rundown in terms of percentage chance of Trump winning:
I was asked on Twitter yesterday for my odds. Given that my model does not produce a number for this, I was reluctant to give an exact number. But I gave a range and said between 5% and 10%. With a few additional polls added since then, I’d go toward the higher end of that range. Maybe 7% to 10%.
Why that range?
Trump is getting very close to Clinton, but in all the prior polling movement in the campaign Trump has never been able to actually pull into the lead. It seems like he reaches a ceiling and gets to the point where to gain any further he has to not just convince the wishy-washy undecideds, but he has to start getting actual Clinton supporters to flip, which seems like a much harder job.
But until September I thought Trump’s ceiling was matching Romney’s performance in 2012. With current polling, Trump wins every state Romney won, then adds Florida and Ohio. So levels that look like ceilings can indeed be broken. Another bad news cycle for Clinton, or even some systematic error in the polling could easily put us there.
So 7% to 10% seems reasonable.
If a Trump win does happen, surprise is warranted, because he would have beaten the odds, but not shock, because he IS close.
If Trump was a hurricane that was four days out, we would be “within the cone”. Toward the edge of the cone to be sure. We are not directly on the projected path. We expect it to miss us. But we would be making preparations just in case the storm swerves and hits us.
4.3 days until we stop looking at polls and start looking at actual election results.
State Details
The following are the detailed charts for all the states that influenced the national changes outlined above.
Moving from Clinton to Trump
Moving into reach for Trump
Moving out of Clinton’s reach
Other states that helped move the tipping point
A note about McMullin
Election Graphs is designed around showing the Republican – Democrat margin, and there is not enough time before the election to revamp the site to properly account for 3rd parties that are strong enough to have a shot at winning electoral votes.
Right now the Real Clear Politics average in Utah has McMullin 12.0% behind the lead. The 538 average in Utah has him 10.3% behind the lead. Although McMullin was a lot closer than anyone expected, he never got closer than 5% to the lead in Utah in these averages and now appears to be fading. 538 still has him in second place, but it doesn’t seem likely at this point that he will win electoral votes.
If that changes, I will of course note it in these updates and on the Election Graphs site.
For more information…
This post is an update based on the data on ElectionGraphs.com. Election Graphs tracks a state poll based estimate of the Electoral College. All of the charts and graphs seen in this post are from that site. Additional graphs, charts and raw data can be found there. Follow @ElectionGraphs on Twitter or like Election Graphs on Facebook to see announcements of updates or to join the conversation. For those interested in individual general election poll updates, follow @ElecCollPolls on Twitter for all the polls as they are added. If you find the information in these posts interesting or useful, please consider visiting the tip jar.
Edit 17:45 UTC to fix some wording in the hurricane comparison paragraph.
Edit 19:53 UTC to fix a Comey/Comet autocorrect.
States with new poll data added since the last update: Wisconsin, Florida, Ohio, Indiana, New Hampshire, Iowa, Virginia, Colorado, Alaska, Washington, Michigan, Arizona, Tennessee, Maryland, Massachusetts, Oregon, Illinois.
Notable changes in: Michigan and Arizona.
National Summary
As of this update, the most recent polls included in the state averages ended on Thursday. That means that as of yet we do not have any polling that would show the impact (or lack thereof) of Friday’s release of 2005 era Trump recordings that have dominated the news since then.
But even before those revelations, Trump was dropping quickly in the aftermath of the first debate and the leak of tax documents. This process continues:
- The expected result moves from Clinton by 154 electoral votes to Clinton by 176
- Trump’s best case moves from a 26 electoral vote win to a 6 electoral vote loss
- The tipping point moves from Clinton by 4.5% in MI to Clinton by 5.9% in MN
Looking at the charts:

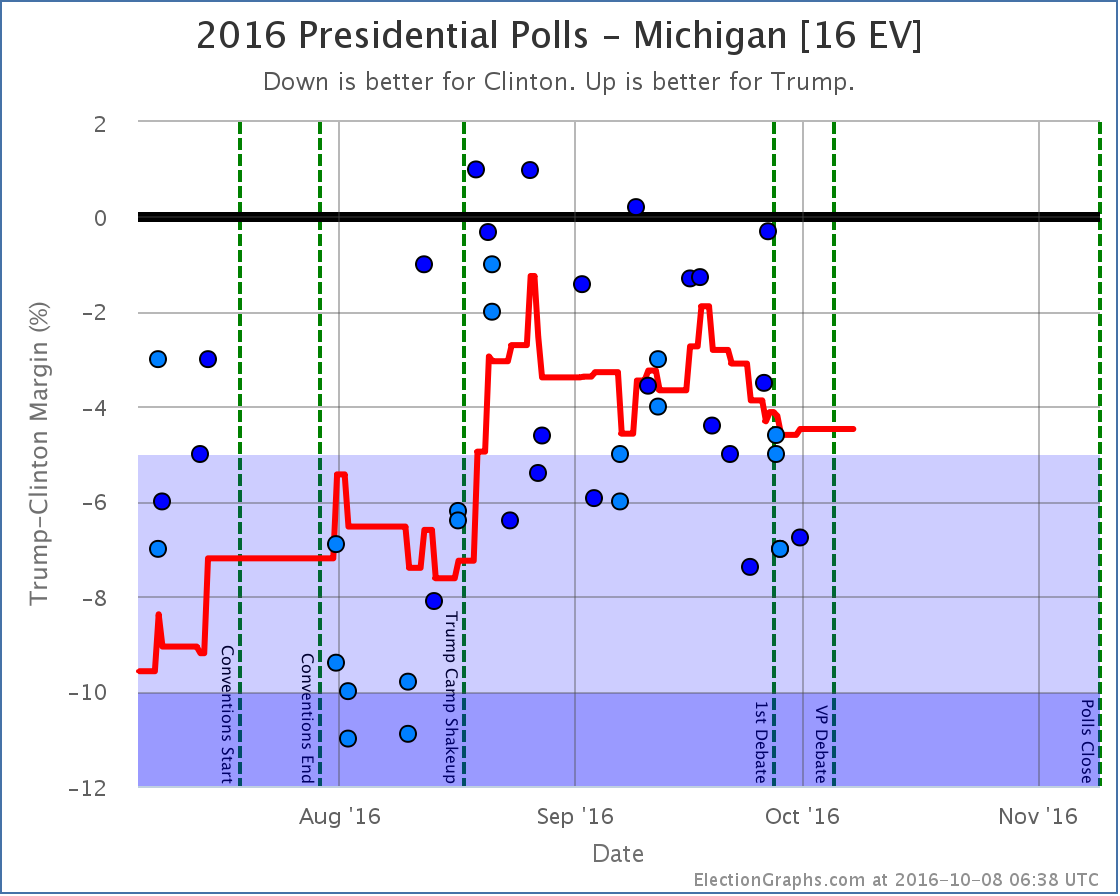
Clinton expands her expected win by taking the lead in Arizona. But perhaps more notable at this point is that her lead in Michigan expands to 5.9%, moving it from my “Weak Clinton” category into “Strong Clinton”.
Without Michigan, Trump no longer has a path to victory. He can win all the states he is ahead in, plus all the states where he is close (North Carolina, Arizona, Florida, Ohio, Iowa, and Nevada) and he would still come up short, losing to Clinton 272 to 266.
In order to win, Trump would need to not only pull all of those close states over to his side, but also reverse his fortunes in Michigan or other states where he is currently not just behind, but significantly behind.
Now, with all this, Trump’s numbers are actually still slightly better than he was doing at Clinton’s high water mark in mid-August. Trump came back from that and moved things to the point where he had almost tied the race. Can’t he do that again? Well, look carefully at that recovery. From Trump’s low point, it took about a month to reach the point where he had almost tied the race. A month.
We now have 30.3 days left until polls start to close on election day. Many people have already voted. Early voting is ramping up quickly in state after state. In order to catch up and win, Trump would have to have a recovery that was more significant… and quicker… than the successes he managed in August and September.
For any reversal, Trump has to pull out of the tailspin first… and the polls don’t yet reflect the latest major campaign events. Things are likely to get worse for Trump before they get better. If they get better. He is running out of time. It may already be too late.
As I write this the 2nd Presidential debate is in just a few hours. Hang on tight.
State Details
Here are the charts for the states whose movements caused the summary changes:
Weak Trump to Weak Clinton
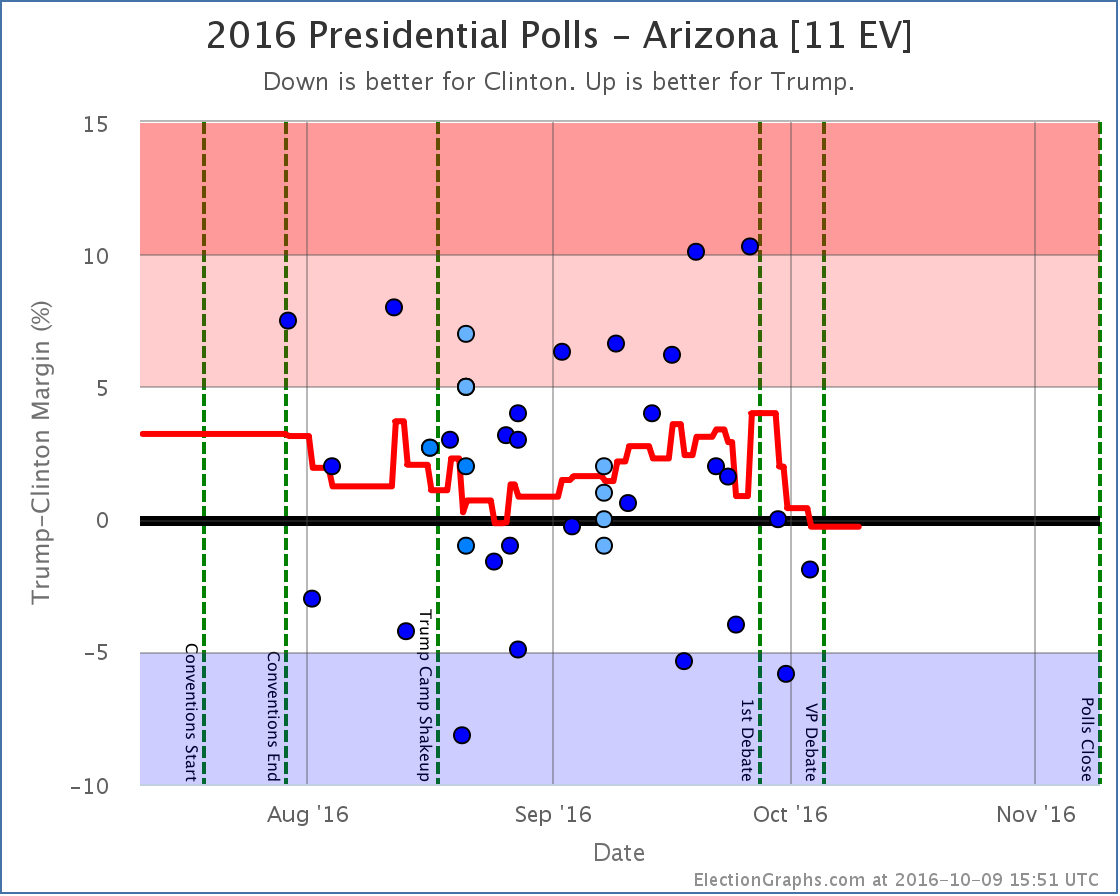
Four of the five polls in the average right now have Clinton tied or ahead in Arizona. All three post debate polls do. Clinton’s lead in the average though is a very narrow 0.3% though. Trump could very well take the lead again with the next poll.
Weak Clinton to Strong Clinton
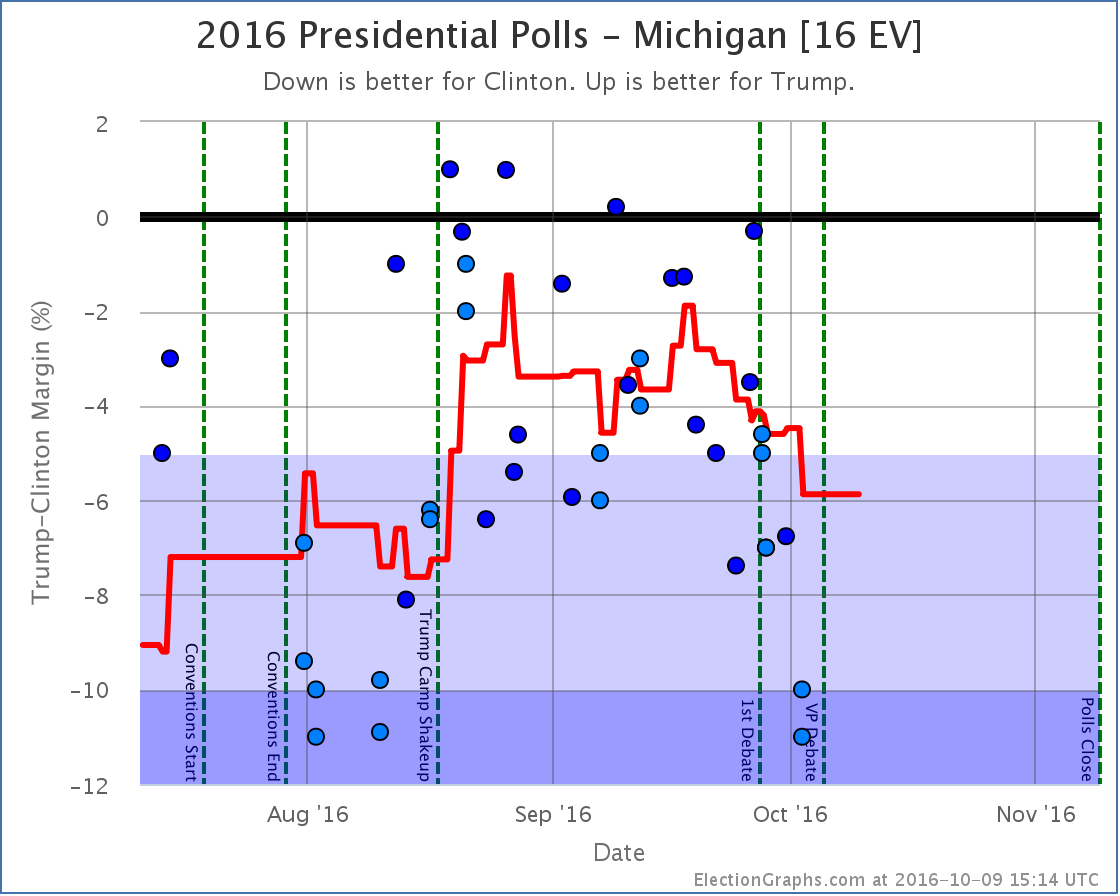
Movement away from Trump is visible starting in mid September. Trump’s debate performance did nothing to change this trend. Clinton now holds a fairly substantial lead in Michigan.
For more information…
This post is an update based on the data on ElectionGraphs.com. Election Graphs tracks both a poll based estimate of the Electoral College and a numbers based look at the Delegate Races. All of the charts and graphs seen in this post are from that site. Additional graphs, charts and raw data can be found there. Follow @ElectionGraphs on Twitter or like Election Graphs on Facebook to see announcements of updates or to join the conversation. For those interested in individual general election poll updates, follow @ElecCollPolls on Twitter for all the polls as they are added. If you find the information in these posts interesting or useful, please consider visiting the tip jar.
States with new poll data added since the last update: All of them. Multiple times. There are additional new polls since I had to cut things off for this update as well. Those will be in the next update.
National Summary
The last week of polls has been devastating to Trump’s position. In the last update we were just starting to see the reaction from the first debate. With this batch the post-debate polling continued to roll in, and while there were a couple of minor moves toward Trump, the net change in this update was a dramatic move toward Clinton:
- The expected result moved from Clinton by 6 electoral votes to Clinton by 154 electoral votes
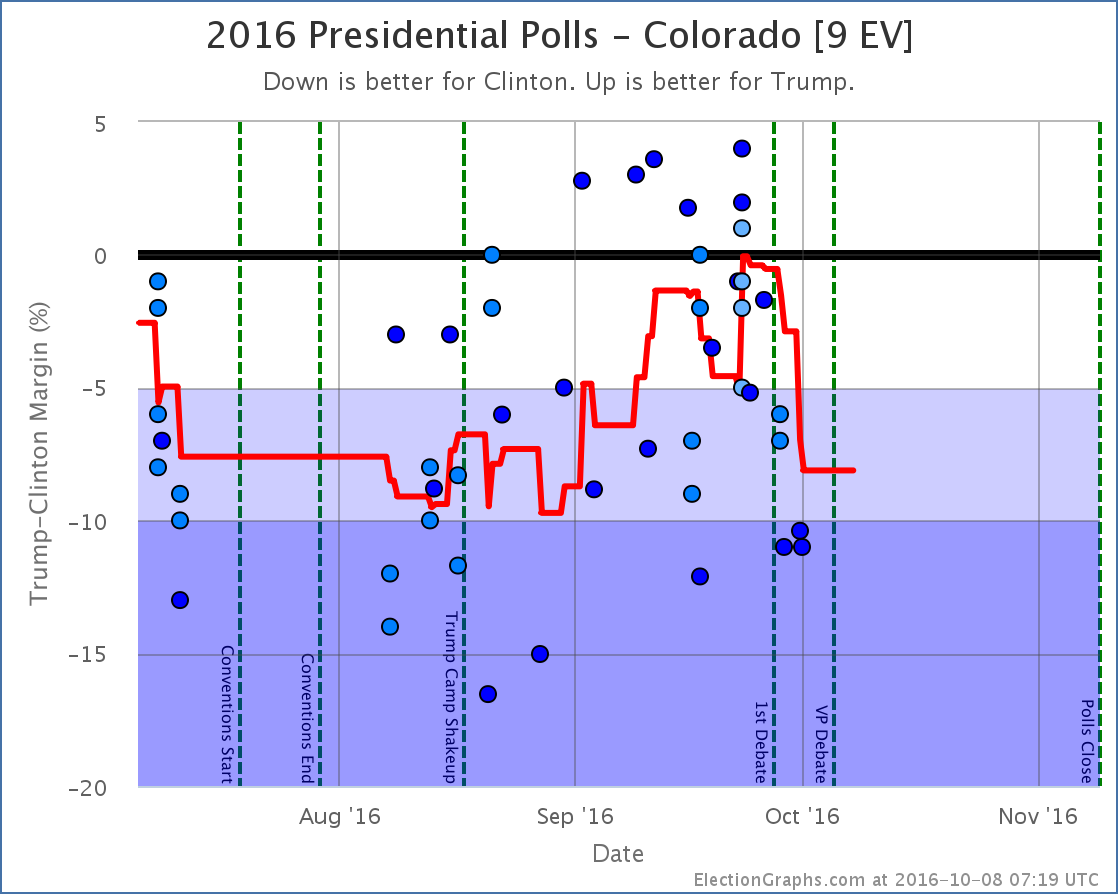
- The tipping point moved from Clinton by 2.1% in CO to Clinton by 4.5% in MI
- Trump’s best case moved from a 60 EV win to a 26 EV win
- Clinton’s best case moved from a 208 EV win to a 196 EV win
Looking at the charts:
The previous update mentioned some Trump losses starting a week or two before the debate. With a lot more polls filling in the time period right before the debate as well as right after, it now looks like those losses were reversed before the debate.
In the time after the debate though, all three indicators on the chart have moved in Clinton’s direction. The race is now essentially back to where it was at the beginning of September. We’re not yet back at Clinton’s high point from August, but it is getting close.
The tipping point chart is even more stark. As with the electoral college view, it looks like Trump’s mid-September declines were reversed by debate time, but after the debate everything falls off a cliff. Most of Trump’s gains from August and September are gone. Right before the debate he topped out with Clinton only ahead in the tipping point metric by 0.4%.
Clinton now leads by 4.5%. The tipping point state is Michigan. Clinton only has to increase her lead slightly there to not just take Michigan out of reach for Trump, but the Presidency.
What we are seeing in the polling results right now at this point probably fully factors in the debate itself. But we are just starting to see the impact from Trump’s “worst week in presidential campaign history ” that started with the debate, continued with his attacks on Alicia Machado, and ended with the leak of some of his tax information. The events of that week are not yet fully baked in.
And of course, the polls do not yet reflect the VP debate, or more importantly, the 2005 Trump video that was leaked on Friday. It is hard to imagine the events of the last few days NOT having an impact on the polls.
And the next debate is coming up. It should be interesting. If you were not planning on tuning in before, change your plans.
31.7 days left until the first actual election results start coming in.
State Details
A lot of states moved in order to produce the summary results above. For those interested in looking at the state by state details, they are below:
Weak Trump to Weak Clinton
Moving out of reach for Trump
Moving out of reach for Clinton
Moving into reach for Trump
States that changed categories but then moved right back again
For more information…
This post is an update based on the data on ElectionGraphs.com. Election Graphs tracks both a poll based estimate of the Electoral College and a numbers based look at the Delegate Races. All of the charts and graphs seen in this post are from that site. Additional graphs, charts and raw data can be found there. Follow @ElectionGraphs on Twitter or like Election Graphs on Facebook to see announcements of updates or to join the conversation. For those interested in individual general election poll updates, follow @ElecCollPolls on Twitter for all the polls as they are added. If you find the information in these posts interesting or useful, please consider visiting the tip jar.
States with new poll data added since the last update: New Jersey, Florida, Nevada, Michigan, New Hampshire, California, Massachusetts.
National Summary
The newest batch of polls… mostly post-debate polls… results in movement toward Clinton and away from Trump, which matches the consensus expectations after the debate this week:
- Trump’s best case declines from Trump by 92 EV to Trump by 60 EV
- The tipping point moves from Clinton by 1.3% in NH to Clinton by 2.1% in CO
Looking at the charts:
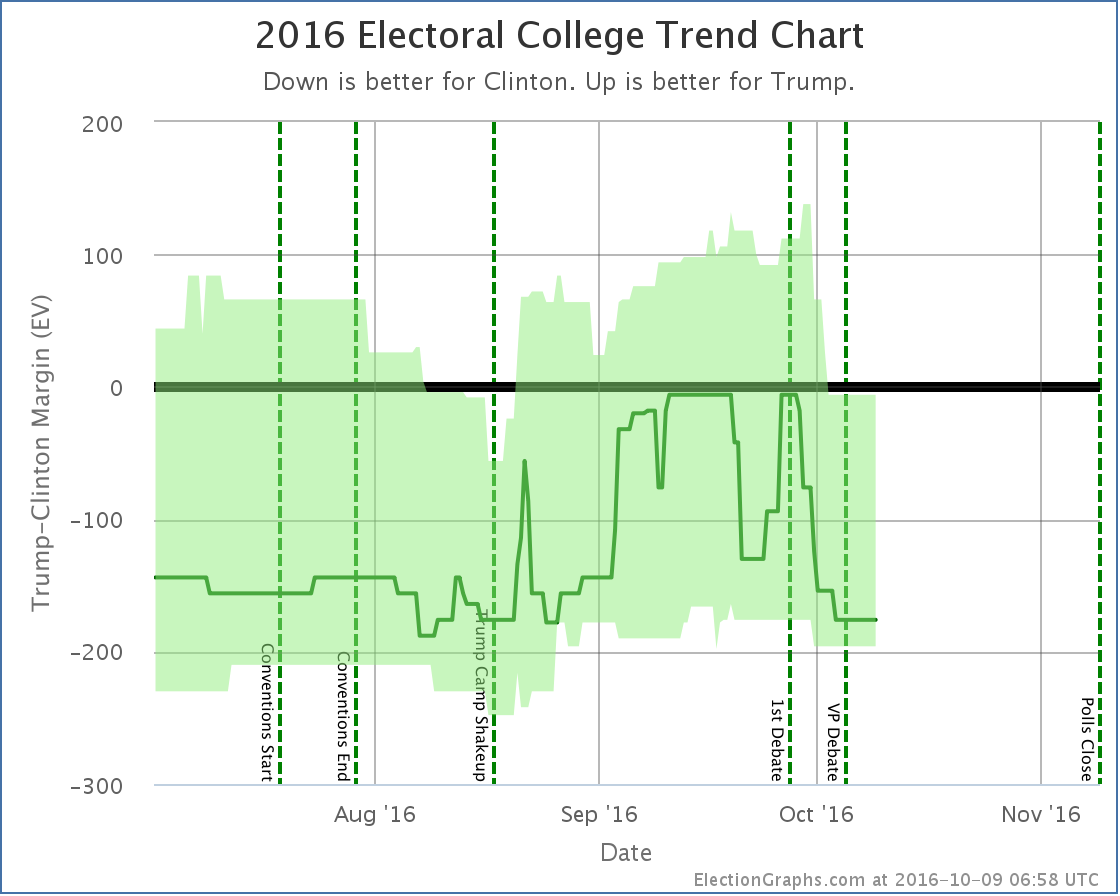
Although polls may still come in that change the shape of the last couple weeks, right now a clear pattern is emerging where both “best cases” have been moving in Clinton’s direction since about September 20th. More states are coming into Clinton’s potential reach, while other states are moving out of Trump’s reach.
Interestingly, the “expected” case, although it has fluctuated as big states move back and forth across the center line, is back at the same place it was in mid-September… Clinton leading by an extremely narrow 6 electoral votes.
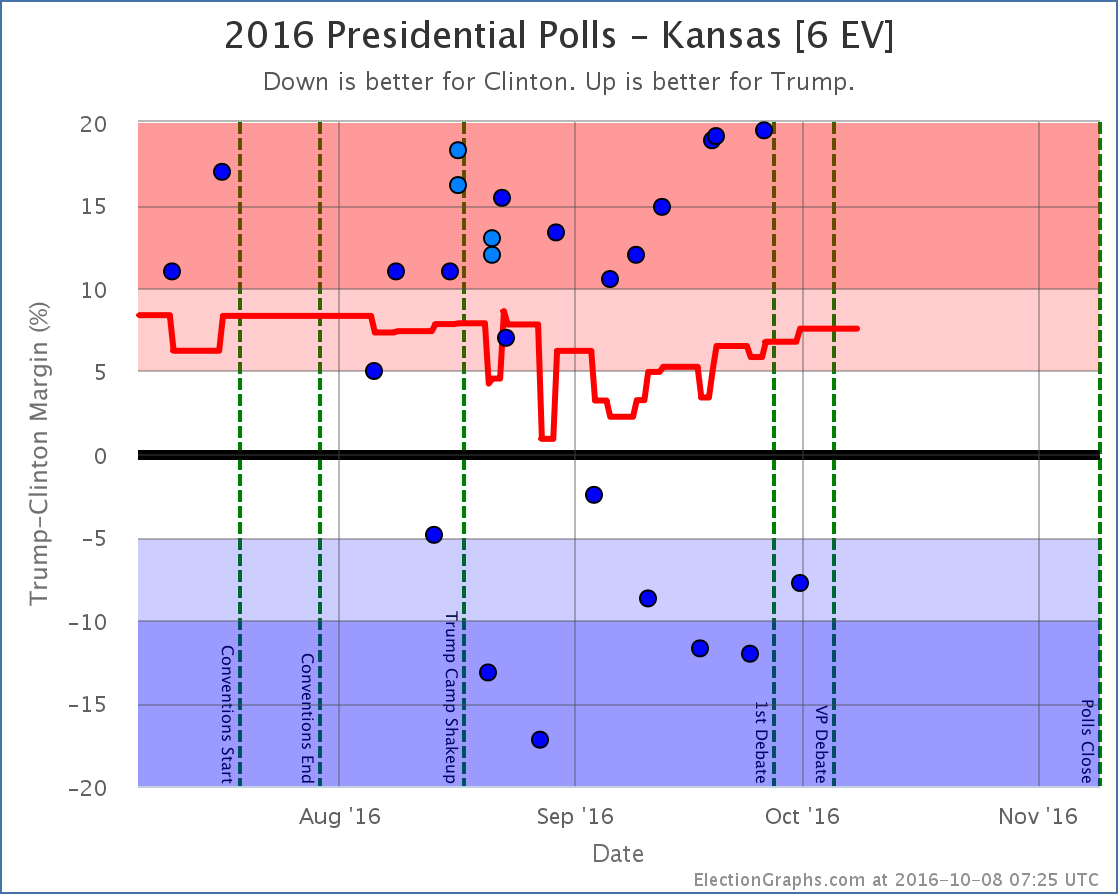
But there are six states where the average shows Trump leading by less than 0.5%… North Carolina, Nevada, Kansas, Ohio, Florida, and Iowa. Even if you don’t believe Kansas (I am personally dubious about that one), that means there are 74 electoral votes where Trump is hanging on by a thread. If more polls pull those five non-Kansas states away, his expected case drops all the way to an 154 electoral vote loss.
Things look very close in the electoral college right now, but that could change in a hurry!
The volatility of the electoral college measure means to really judge how “close” the race is, we’d be better off looking at the tipping point:
Although the tipping point also has ups and downs as states move around, there is a trend here too. Trump peaked on September 7th when Clinton was ahead by only 0.7% (in Nevada). Since then, Trump has been losing ground. With the latest post-debate drop, Clinton’s lead in the tipping point state (now Colorado) is up to 2.1%.
At the moment Trump only has to flip Colorado to be in the lead. And a 2.1% lead is not a huge margin there. This is still close. Just not at close as it was.
So far the post-debate moves actually look more like a continuation of trends that started earlier rather than a big change caused by the debates, but even after five days, most of the close states just have a small number of post-debate polls, so we may not be seeing the complete picture yet.
37.9 days, 2 presidential debates, and 1 VP debate left to go until polls start to close…
State Details
All the state level details for those who want to dig in…
Weak Clinton to Strong Clinton
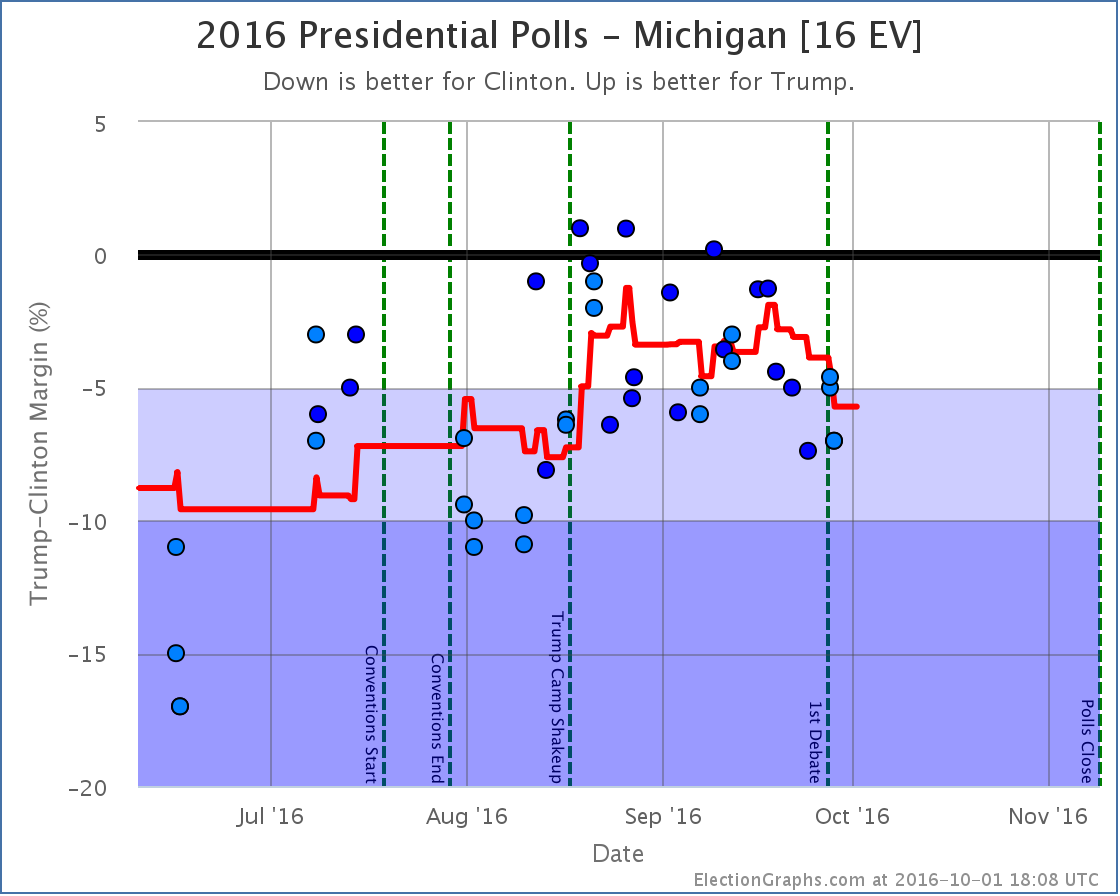
The poll average in Michigan has been moving toward Clinton since September 18th. With the latest update, which included two separate post-debate polls, Clinton’s lead increases to 5.7% which moved the state out of reach for Trump, leading to the reduction of his best case mentioned above.
Didn’t change categories, but moved the tipping point
Weak Trump to Weak Clinton then back again
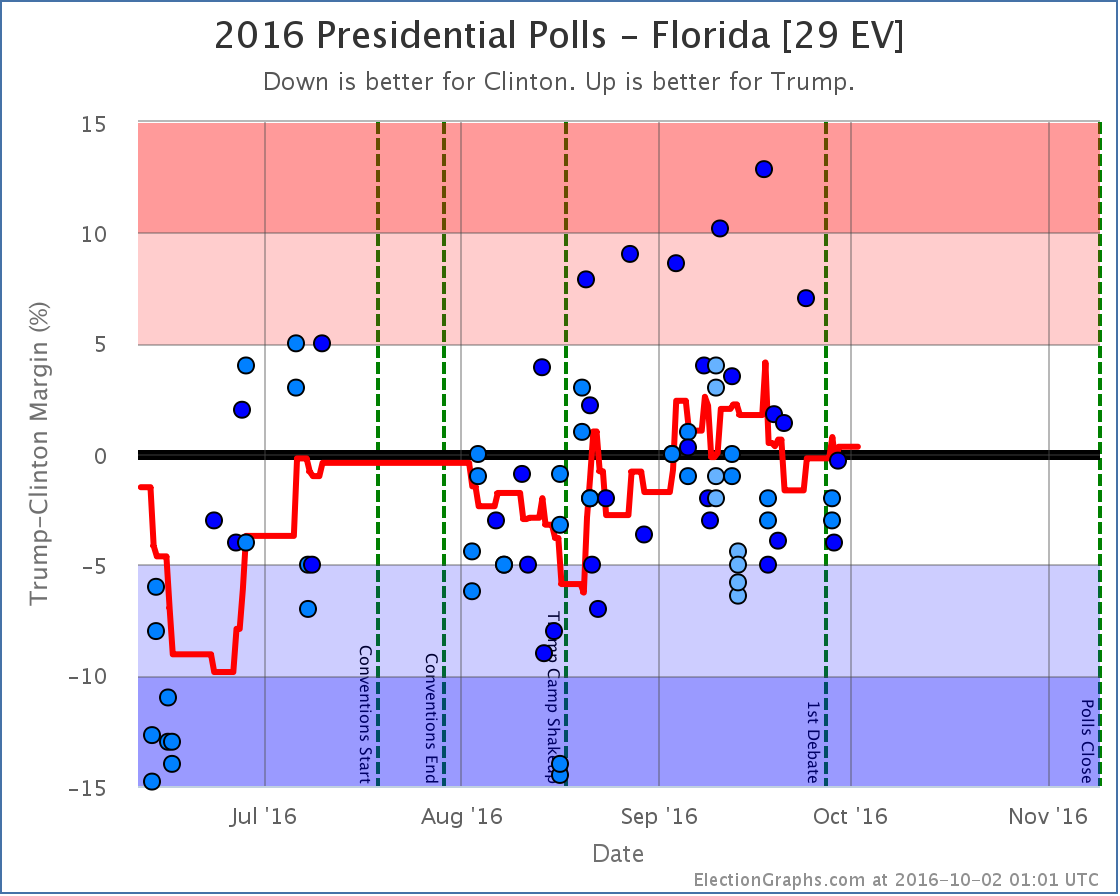
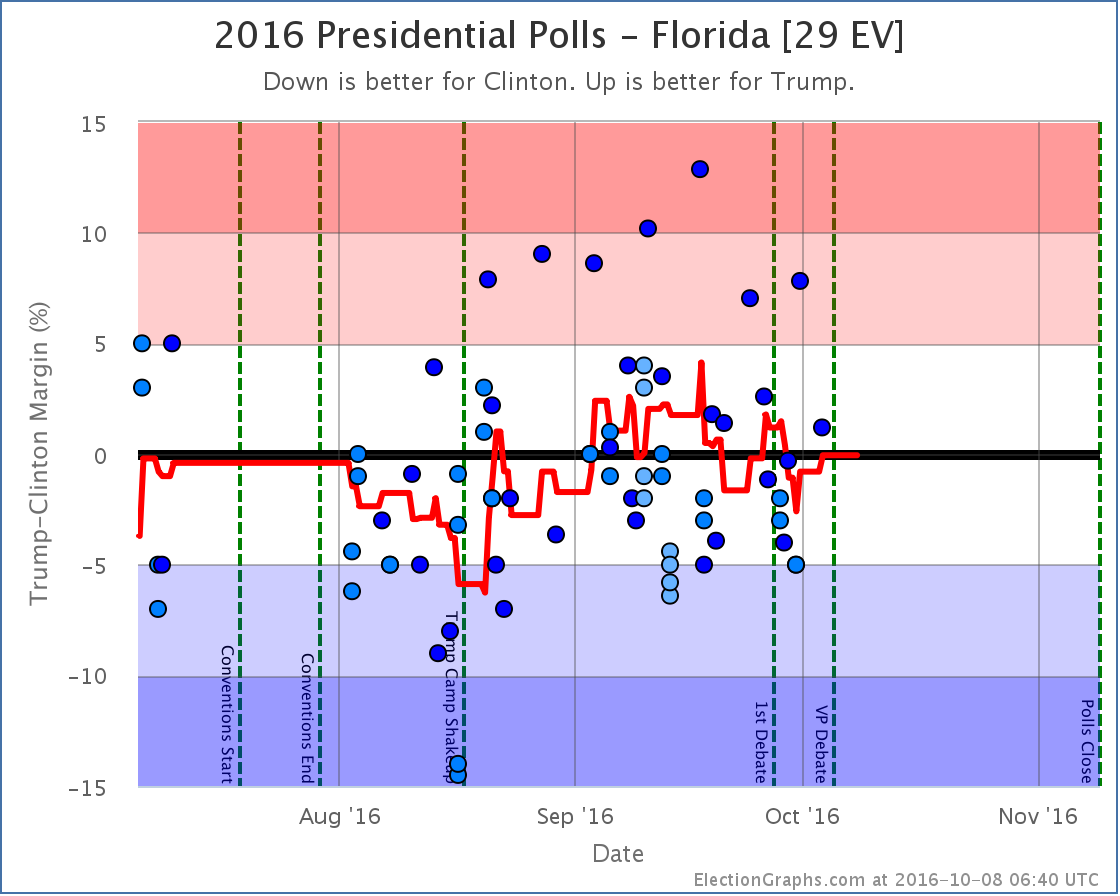
With the latest batch of polls Florida moved from just barely Trump to just barely Clinton, then moved right back again. As this round ended, Florida ends up with an 0.3% Trump lead. The bottom line with Florida is it has been “close” for all but a few days since the conventions ended. Unless we start seeing a definitive movement in one direction or another, Florida remains “too close to call”.
Having said that, Trump has been boosted by outlier Google polls. In the chart above, EVERY poll showing Trump with a lead more than 5% has been a Google poll. Those polls really do look like outliers. If you took Google out, Clinton would be maintaining a small but clear lead in Florida… but we include everything, and so Florida is still hovering right around the zero line.
For more information…
This post is an update based on the data on ElectionGraphs.com. Election Graphs tracks both a poll based estimate of the Electoral College and a numbers based look at the Delegate Races. All of the charts and graphs seen in this post are from that site. Additional graphs, charts and raw data can be found there. Follow @ElectionGraphs on Twitter or like Election Graphs on Facebook to see announcements of updates or to join the conversation. For those interested in individual general election poll updates, follow @ElecCollPolls on Twitter for all the polls as they are added. If you find the information in these posts interesting or useful, please consider visiting the tip jar.
States with new poll data added since the last update: Wisconsin, New York, North Carolina, Pennsylvania, Ohio, Michigan, Virginia, West Virginia, Arizona, New Hampshire, Missouri, Kansas
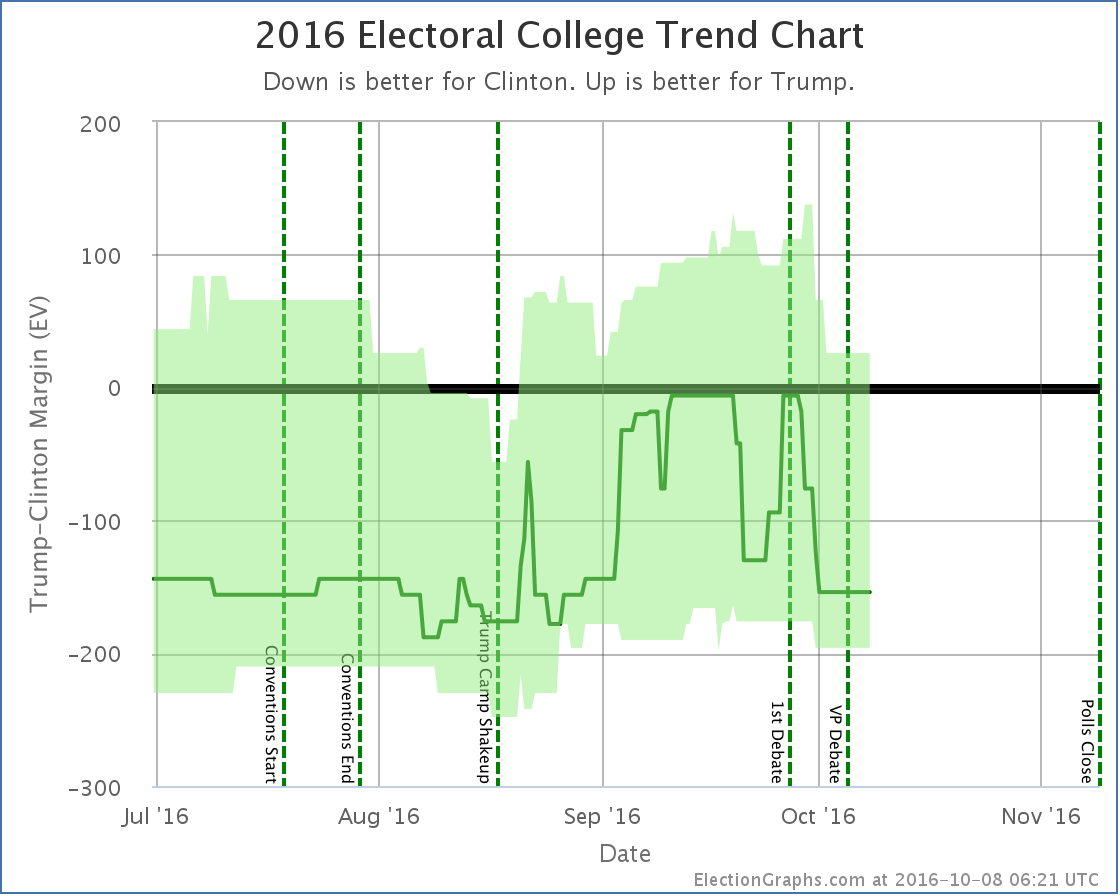
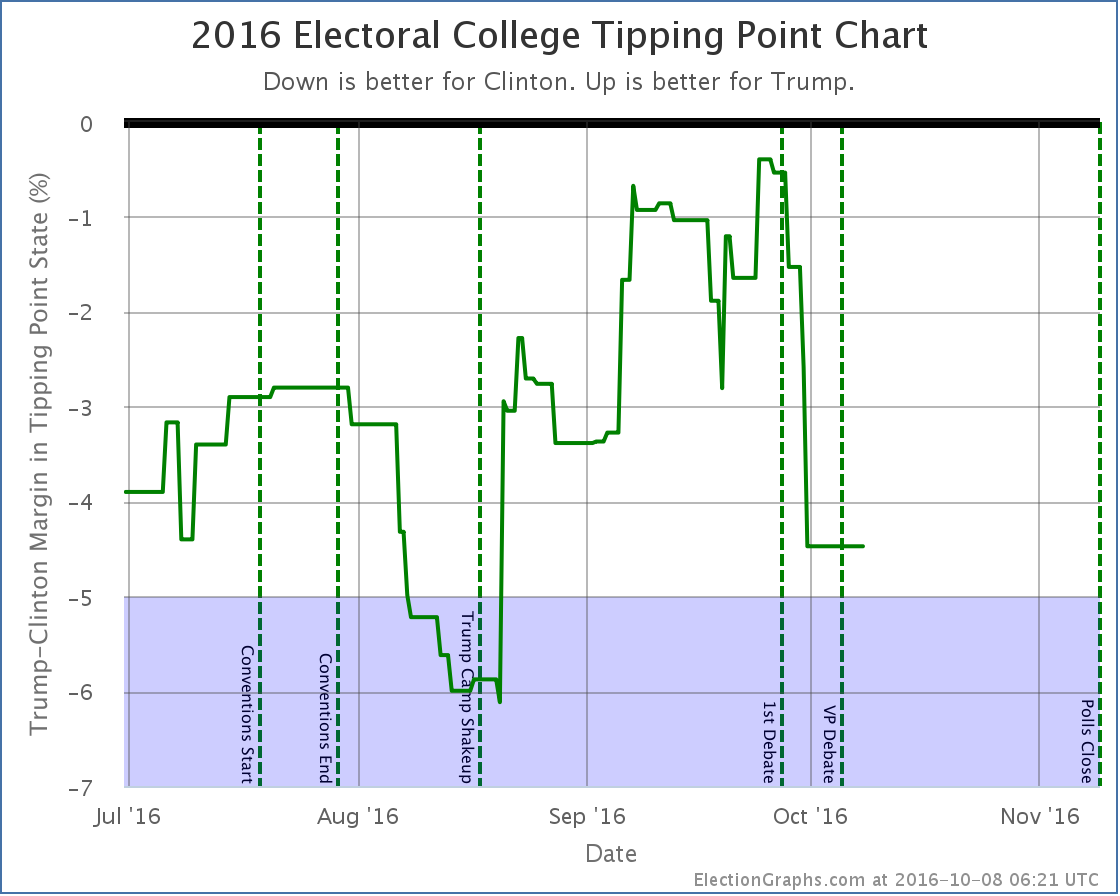
With the logic change out of the way, the race moves on. With the latest batch of polls, one state changes category, and two more contribute to a change in the tipping point.
Electoral College Trend
Despite a few bad polls for Trump right after the convention, the general trend in Michigan has been a tightening race since the beginning of July. With the latest, Clinton’s lead falls to only 4.4%. For the first time since March, Michigan is looking possible for Trump, so we now include it in his best case.
If Trump wins all the states he is ahead in, plus all the states where Clinton leads by less than 5%, he now wins by 56 electoral votes.
(Note the transient spike on the chart as well. This was caused by one poll added in this batch briefly bringing Pennsylvania back into reach for Trump, but another poll added in this same batch increased Clinton’s lead again right away, so there was no net change due to Pennsylvania this time.)
Tipping Point
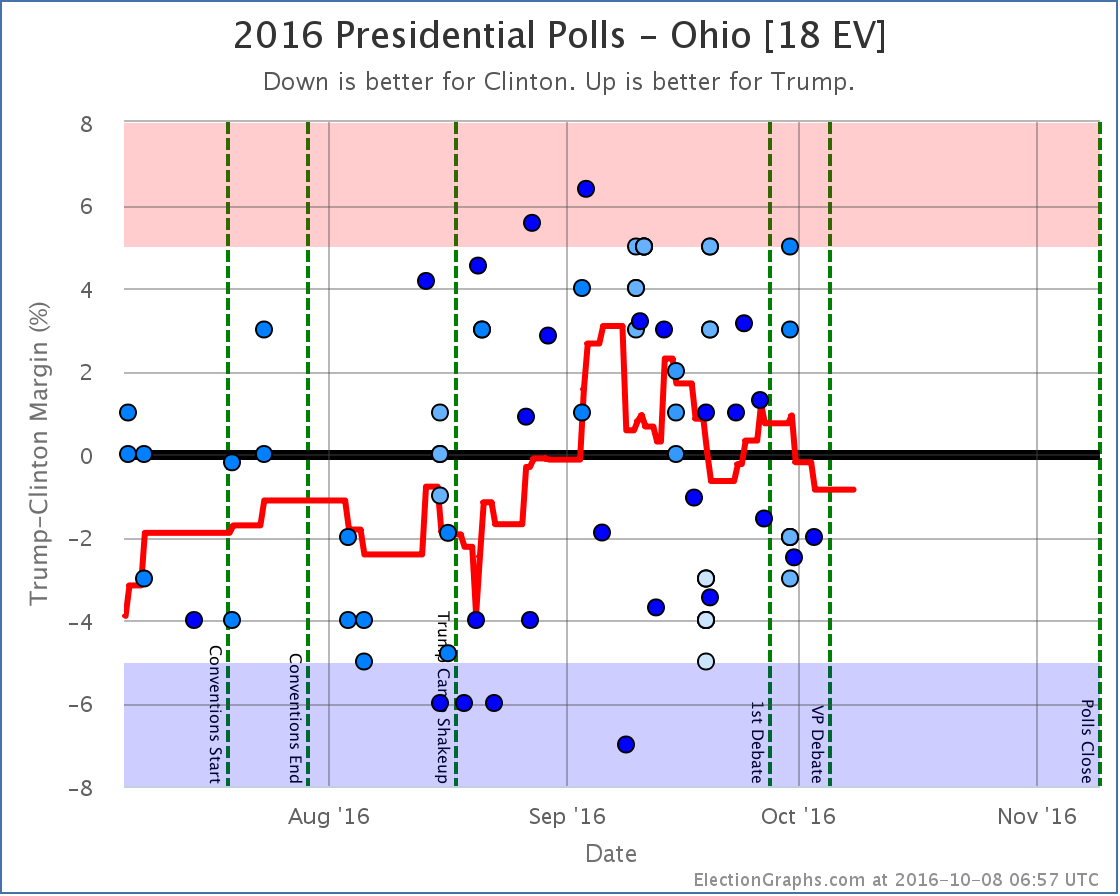
Ohio and New Hampshire were and still are “Weak Clinton” states, but they wiggled around a bit with the latest polls and moved the tipping point from Clinton by 4.4% in Ohio to Clinton by 3.8% in Ohio, an 0.6% move toward Trump.
Overall
In both the Trump best case and the tipping point, we see Trump clearly reaching a peak during the conventions, then plummeting the first half of August, then recovering ever since. He isn’t quite back to where he was before the conventions, but he is getting close.
So far Trump is making a lot of states that were not close a few weeks ago close. But no states have crossed the center line in the last couple of weeks. We have seen this before. There are a variety of blue states where Trump seems to be able to come close, but he is having a hard time pulling them across the line into the red zone.
Since the conventions the “expected” case has been in the range between Clinton winning by 144 and Clinton winning by 188. Trump hasn’t done better than losing by 144 electoral votes since before he was locked up the Republican nomination. The test for any continued Trump rebound will be if he can start to move not just his best case, but the expected case as well. Can he actually flip states? Or just make them close?
The electoral college margin in the expected case is deceptive, because these numbers can change very quickly. The tipping point is the thing to watch at the moment. At a 3.8% Clinton margin, less than 1 out of 50 people have to change their minds to flip the outcome. The public is polarized, but 1 out of 50 isn’t all that much in the grand scheme of things. You can imagine events that would flip that many people if Clinton has a bad week.
Historically though, Trump is very near his previous ceilings. Every other time he has reached these levels, he has fallen back down fairly quickly. Will this time be different?
67.2 days until the polls start to close.
Note: This post is an update based on the data on ElectionGraphs.com. Election Graphs tracks both a poll based estimate of the Electoral College and a numbers based look at the Delegate Races. All of the charts and graphs seen in this post are from that site. Additional graphs, charts and raw data can be found there. Follow @ElectionGraphs on Twitter or like Election Graphs on Facebook to see announcements of updates or to join the conversation. For those interested in individual general election poll updates, follow @ElecCollPolls on Twitter for all the polls as they are added. If you find the information in these posts interesting or useful, please consider visiting the tip jar.
States with new poll data since the last update: Tennessee, Arizona, Florida, Pennsylvania, Michigan, New Hampshire, North Carolina, Kentucky.
It looks like Trump’s last couple of bad weeks are starting to hit the state poll averages. In this update, we have model changes caused by the movement in three states. All three changes favor Clinton.
Going through them one by one…
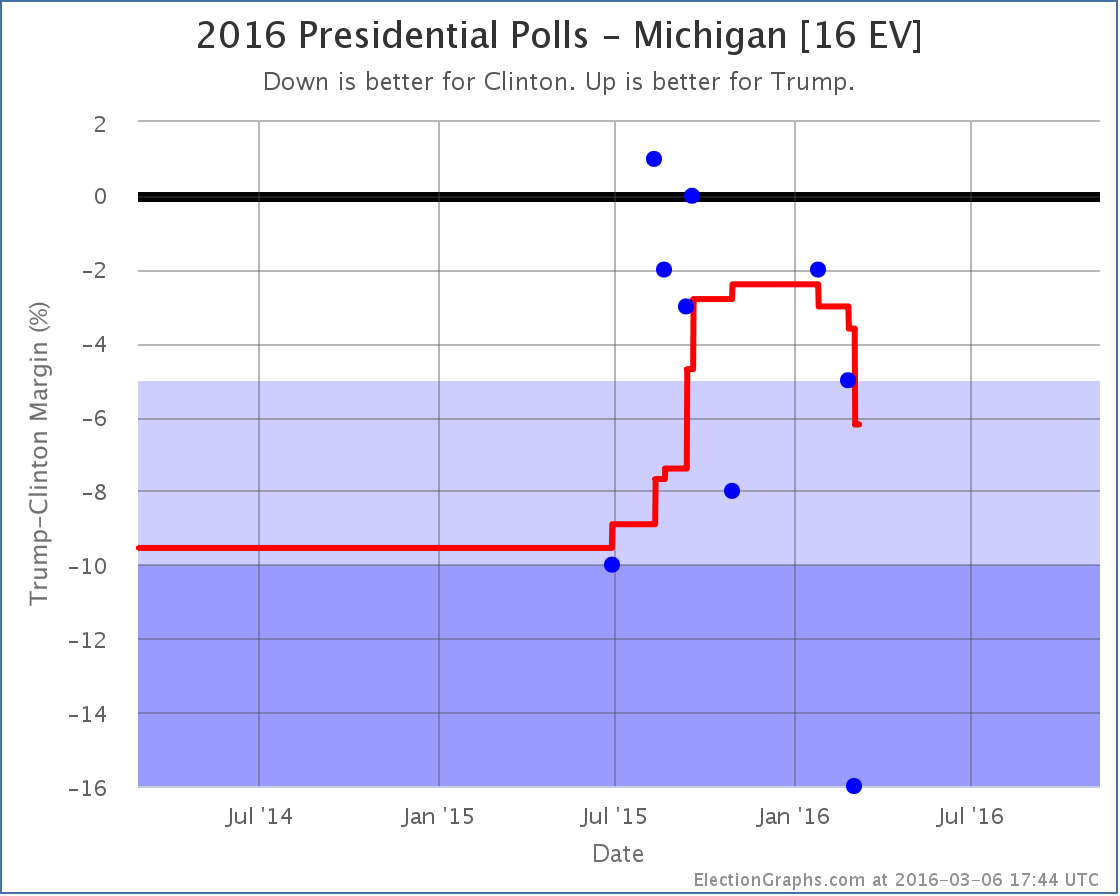
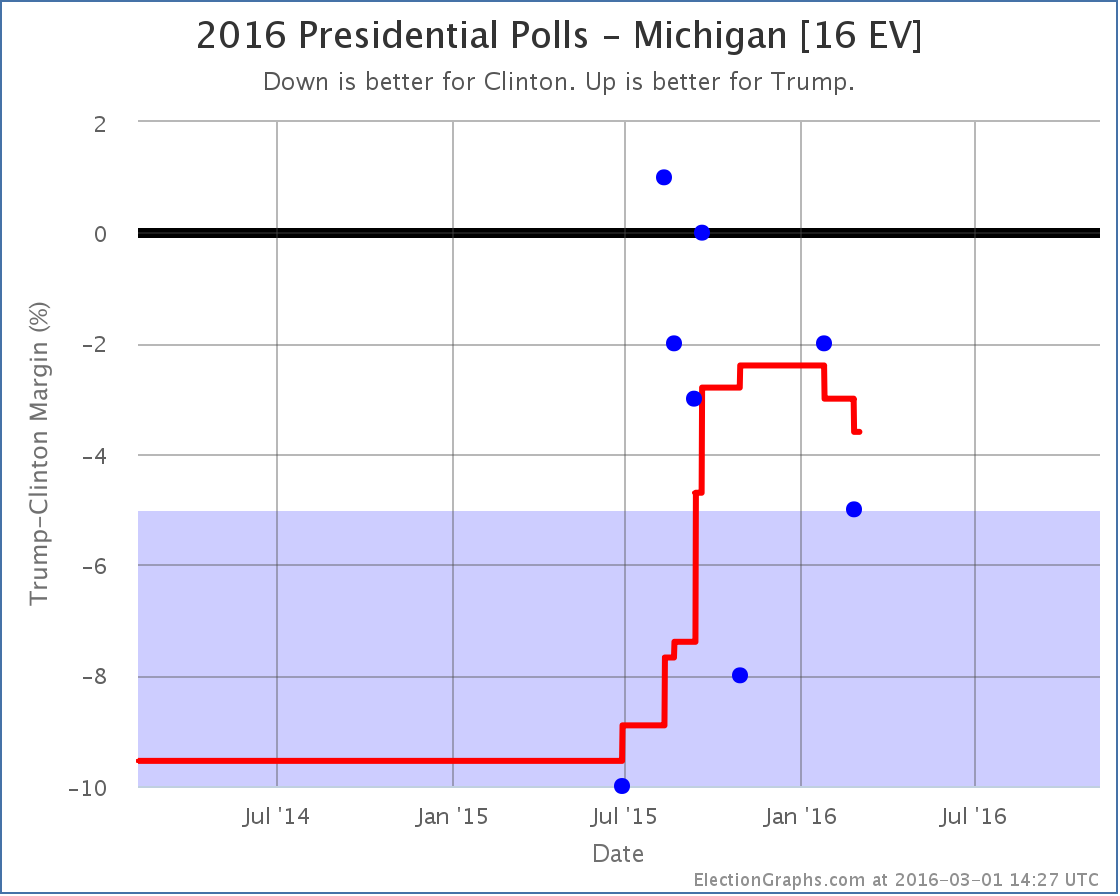
Michigan [16 EV]
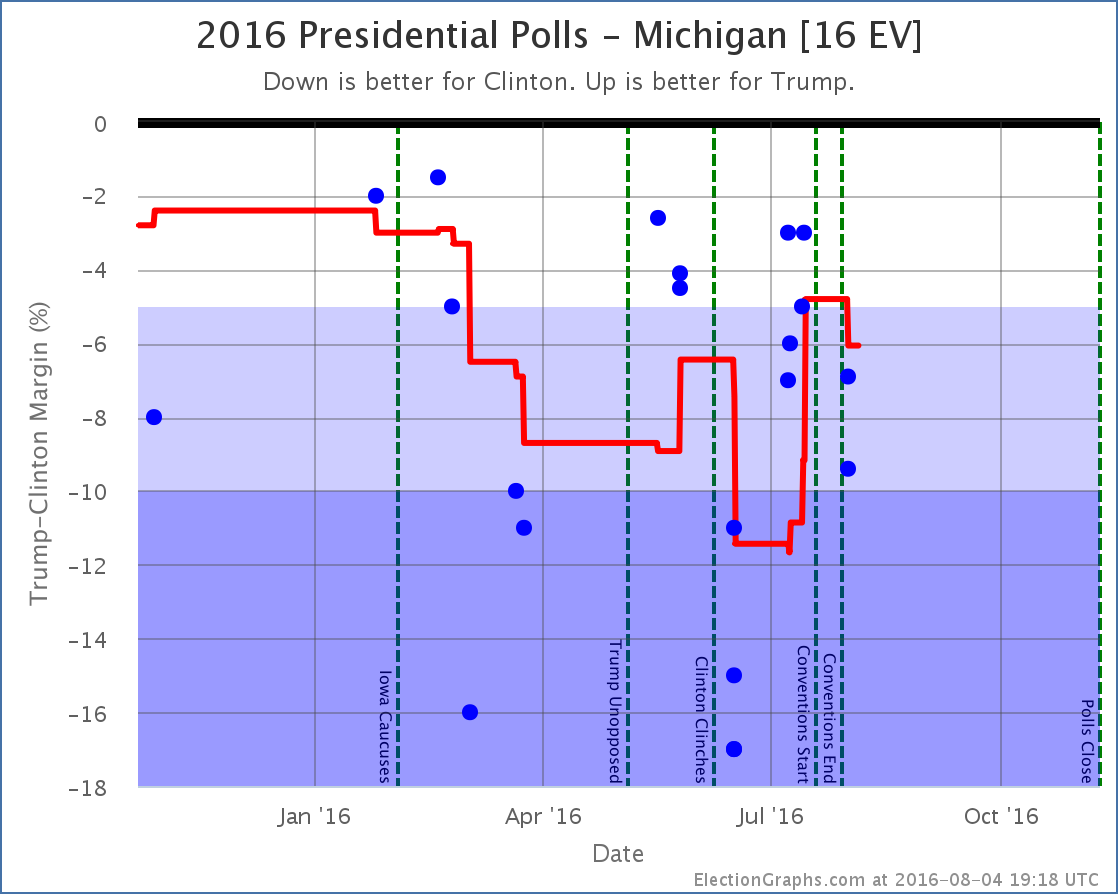
First of all, I will point out a new feature on these charts. There are now vertical dotted lines marking significant campaign events. Right now that is the Iowa caucuses, when the candidates won their primaries and the conventions. When/if debates happen, they will get marked as well. This is helpful in understanding the moves vs what may be going on in the campaign.
In Michigan specifically, you can see that Trump was gaining on Clinton in the run up to the conventions. The average popped up into the “close state” zone right before the conventions started. But with the first post-convention polls, Clinton’s lead increases again. She now has a 6.1% lead in Michigan, and the state is no longer included in Trump’s “best case”.
New Hampshire [4 EV]
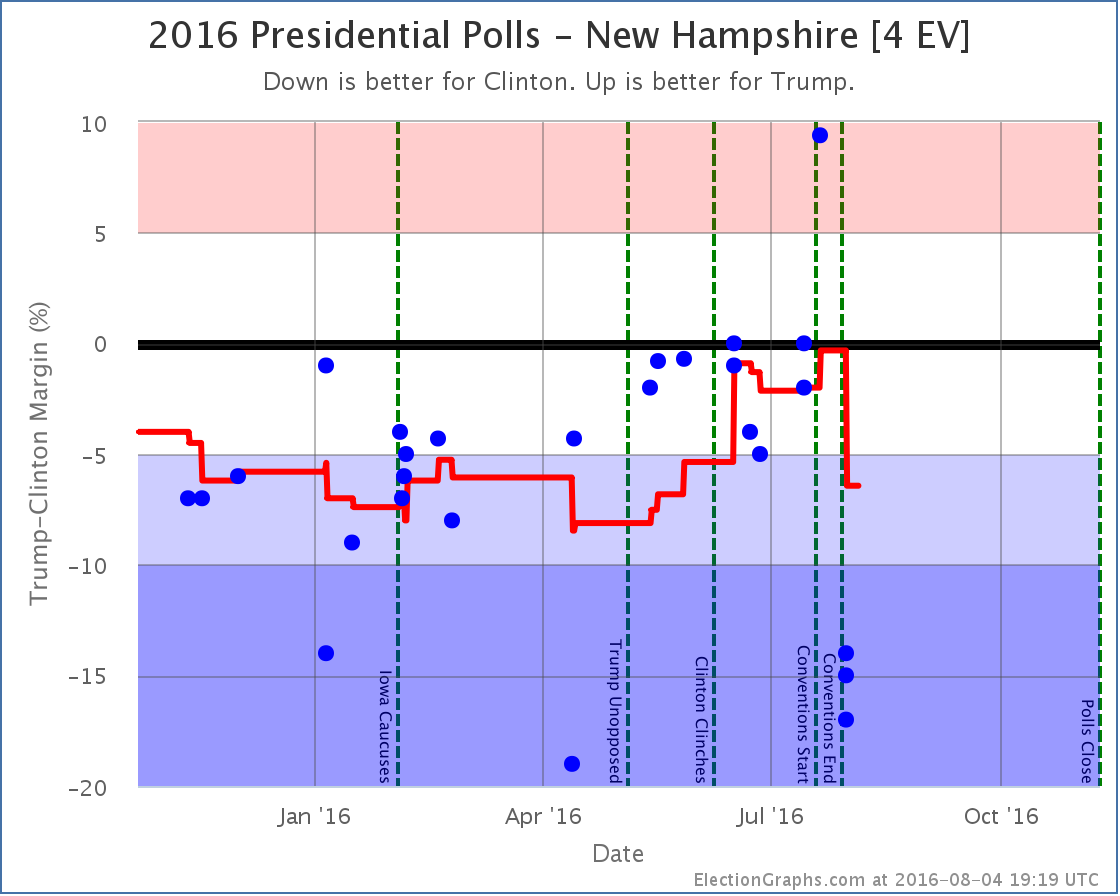
A poll taken during the Republican convention was the best result Trump has ever gotten in New Hampshire. This had moved the average to an very narrow 0.3% Clinton lead. The first results from after the Democratic convention on the other hand are some of the worst results Trump has seen in New Hampshire, and Clinton’s lead rises to 6.4%. So, like Michigan, New Hampshire is no longer looking like a possible Trump pick up. Since New Hampshire also moved past the tipping point, the tipping point also moved.
Now, both the Trump result during the Republican convention, and these new results look like outliers. Every other poll since May has been between a tie and Clinton +5%. So polls showing Trump up by 9.4%, or polls showing Clinton up by 17% should all be taken with a massive grain of salt. Given national trends some swing toward Clinton is expected, but we need to see more polls before concluding that the swing toward Clinton in New Hampshire is quite as large as the new polling indicates.* This is of course why we only look at averages rather than individual polls. The average moved quite a bit, but it doesn’t instantly snap to these new results. But it still moves enough to make a difference.
Florida [27 EV]
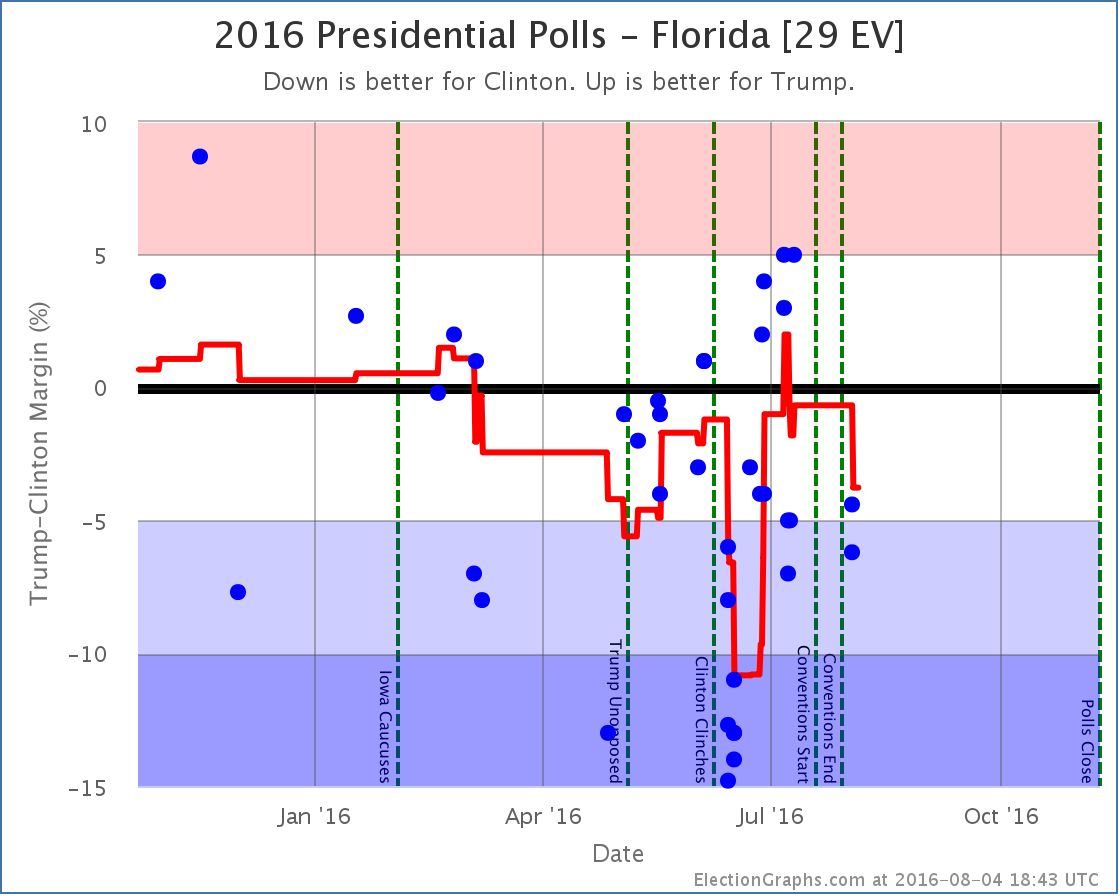
The first post-convention results in Florida move the average toward Clinton. Florida goes from a 0.7% Clinton lead to a 3.8% Clinton lead. No category change here. Florida is still weak Clinton, but since the average passes the tipping point, the tipping point gets shifted.
National View
With each of the three states that caused changes out of the way, time to look at the national picture.
First the “bubble” showing the best and expected cases over time:
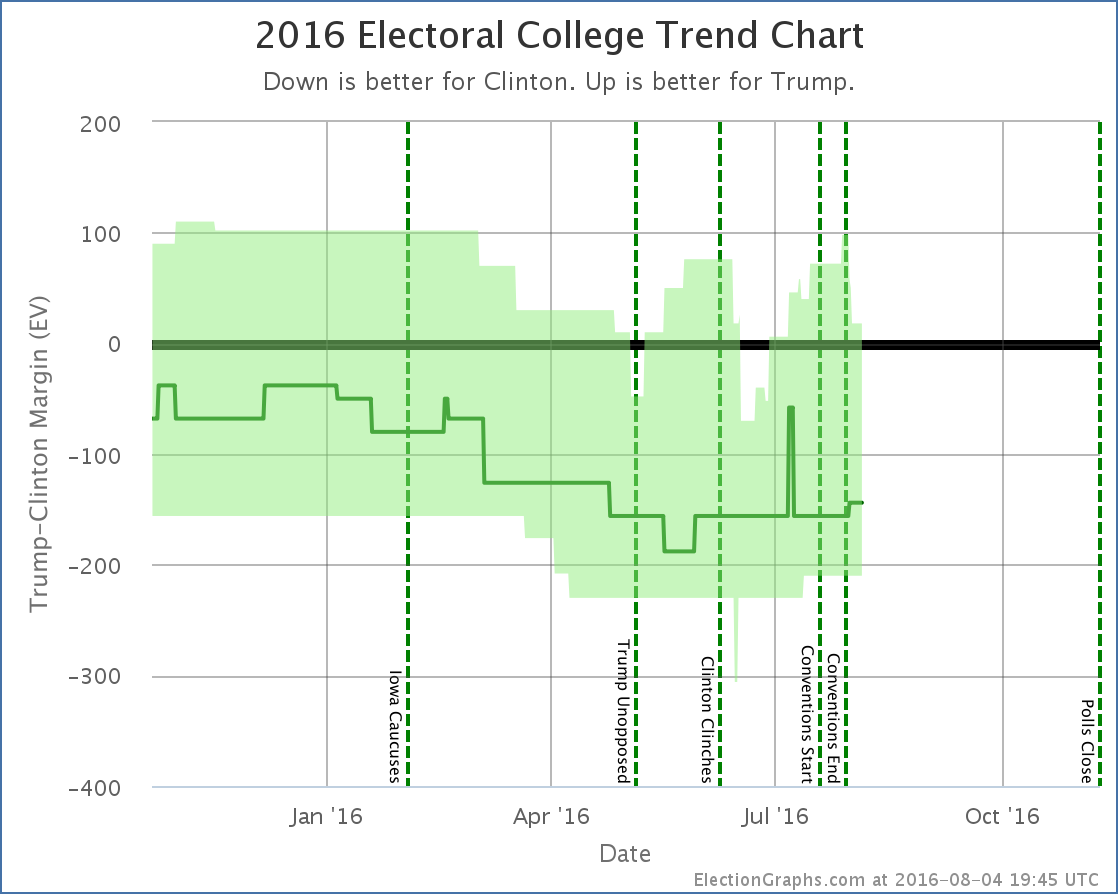
Right before the Democratic convention ended, Trump’s best case was up to winning by 98 electoral votes. Since then Pennsylvania, Michigan, and New Hampshire have slipped out of reach. His best case is now down to winning by only 18 electoral votes. He is one bad poll in Virginia, Florida, or North Carolina away from once again having his best case be a loss.
And with the movements in Florida and New Hampshire the tipping point moves dramatically as well:
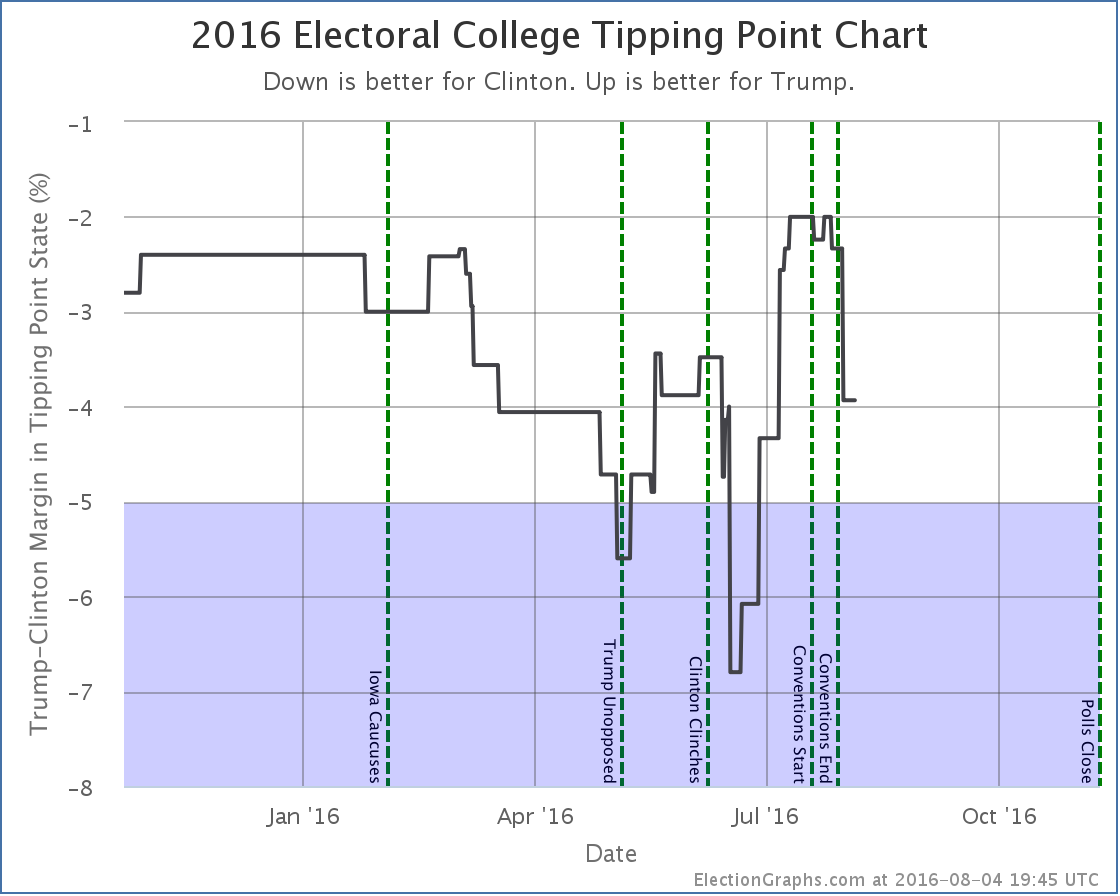
The tipping point margin… that is the margin in the state that would put the candidate “over the top” if you order the states by how strongly they support the candidates, moves from Clinton by 2.3% in North Carolina to Clinton by 3.9% in Virginia.
Before the conventions, Trump had dramatically improved his position in the tipping point. He was still losing, but by much less than before. He has now given up about 40% of the margin he gained.
A 3.9% tipping point margin… which is basically equivalent to the national popular vote margin, but adjusted for the structure of the electoral college… is still a close race. But not as close as it was before the conventions… and there are many close states that have not yet had post-convention polls.
Given where national polling is right now, once we do get more state polls, it would not be surprising to see Trump continue to drop in the short term.
95.7 days until the first polls start to close on election day.
* For the wonkiest of you out there: All three results showing Clinton up by double digits were from the same underlying WBUR poll sliced in different ways, so were not actually fully independent samples, so they don’t count as additional confirmation. This election cycle when I have a single poll that reports multiple results… just 2 candidates along side with 4 candidates, or registered voters and likely voters, or first response vs pushing leaners, I’m including ALL of the results rather than having some set of rules for picking only one. There are strong arguments for NOT doing this, specifically what I just mentioned about the results not being truly independent of each other, so you essentially end up giving more weight than you would otherwise to that pollster, simply because they reported their results in several different ways. I am simply defaulting to including everything on the theory that being more complete is better. I do understand the downsides though. I may decide to handle this a different way in 2020, but this is how it is for 2016. :-)
Note: This post is an update based on the data on ElectionGraphs.com. Election Graphs tracks both a poll based estimate of the Electoral College and a numbers based look at the Delegate Races. All of the charts and graphs seen in this post are from that site. Additional graphs, charts and raw data can be found there. Follow @ElectionGraphs on Twitter or like Election Graphs on Facebook to see announcements of updates or to join the conversation. For those interested in individual general election poll updates, follow @ElecCollPolls on Twitter for all the polls as they are added. If you find the information in these posts interesting or useful, please consider visiting the tip jar.
States with new poll data since the last update: Georgia, Ohio, Nevada, Michigan, Missouri, New Hampshire, Kansas.
The quick answer to the question in the subject of this post is “not yet”, at least in terms of what can be detected in state poll averages like we track here. Plenty has been written elsewhere on the Trump bump in national polling averages such as Pollster and RCP. There does appear to be a bump after the Republican convention. It takes a lot longer for these effects to show up at the state level, so we are unlikely to see individual effects for the two conventions. Instead we’ll see the net effect after both.
In the meantime, there are indeed two changes from the latest batch of polls, and they both are in Trump’s direction. In one case the data is from before the convention, and in the other the movement is small, so it isn’t enough to call out as a bump yet. Looking at them individually:
Michigan
Even though one poll was just added, the most recent poll in Michigan is still from before the Republican convention, so we can’t read anything about a bump into it. But it did cause some polls that were very favorable to Clinton to roll off the poll average, so the average spikes up in Trump’s direction.
There haven’t been any polls actually showing Trump ahead in Michigan in almost a year, but with this Clinton’s lead drops to 4.8%, so we consider it a potential pickup for Trump.
Trump’s best case moves from winning by 40 electoral votes to winning by 72 electoral votes. To get there he still has to flip Nevada, New Hampshire, Iowa, Florida, Ohio, Pennsylvania, North Carolina and Michigan. Clinton is still ahead in all of those states, but by less than 5%. The “expected” result where everybody wins the states they are ahead in is still a 156 electoral vote victory for Clinton.
But Trump doesn’t need to flip ALL of those states to win, only some of them. How close is he really? That is where Ohio and the tipping point come in…
Ohio
New results from PPP, which ARE from after the Republican convention move the average from a 2.2% Clinton lead in Ohio to a 1.0% lead. Either way, the state is “Weak Clinton”, but because Ohio was the tipping point, this impacts the tipping point:
The tipping point moves from Clinton by 2.2% in Ohio to Clinton by 2.0% in Pennsylvania… so back to where it was right before the Republican National Convention started.
National View
Looking at the center part of spectrum of states… only those where the margin is under 10%, we now have this:
And the map:
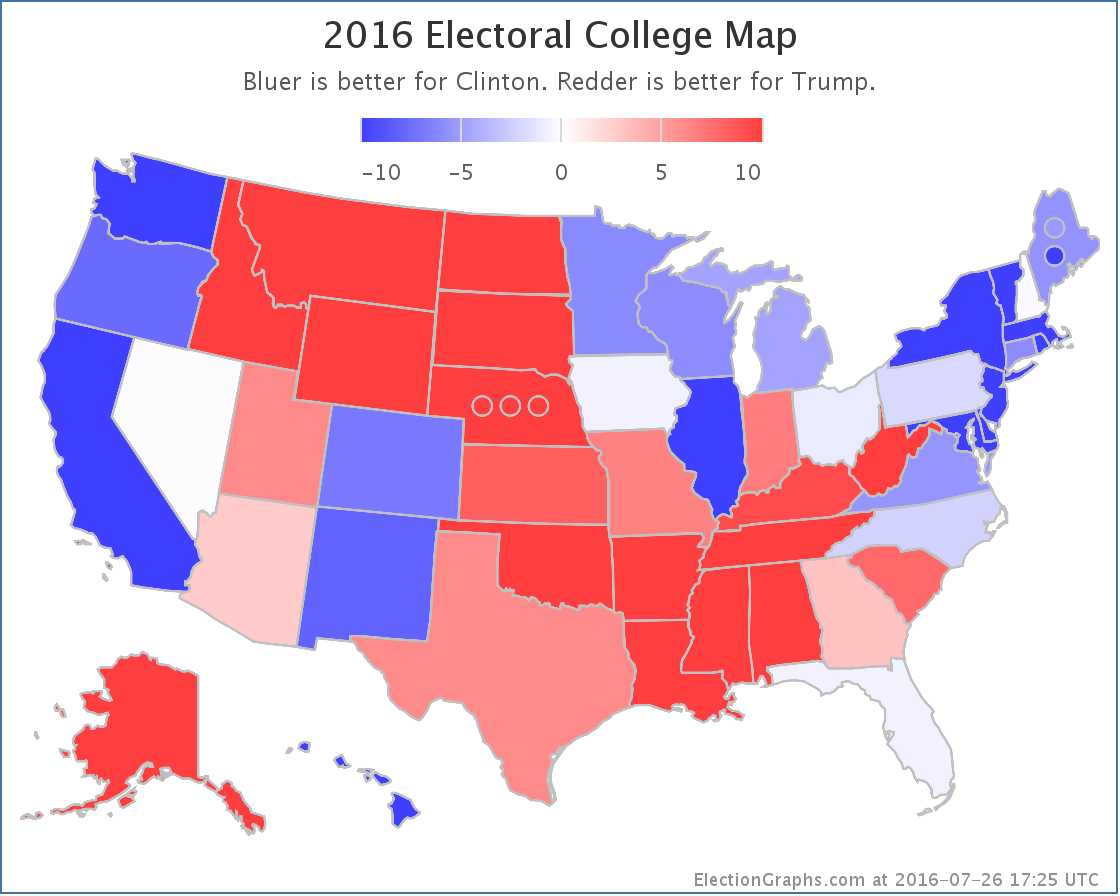
That is a lot of close or almost close states.
105.2 days until polls start to close on election day 2016.
Note: This post is an update based on the data on ElectionGraphs.com. Election Graphs tracks both a poll based estimate of the Electoral College and a numbers based look at the Delegate Races. All of the charts and graphs seen in this post are from that site. Additional graphs, charts and raw data can be found there. Follow @ElectionGraphs on Twitter or like Election Graphs on Facebook to see announcements of updates or to join the conversation. For those interested in individual general election poll updates, follow @ElecCollPolls on Twitter for all the polls as they are added. If you find the information in these posts interesting or useful, please consider visiting the tip jar.
You may have heard all the breathless coverage last night of Sanders’ surprise win in Michigan. And it was indeed a surprise. He outperformed all the recent polls by a substantial margin. This was a big huge win, right?
Well, no. It wasn’t. The media hype is all around the fact that it is more interesting to cover an actual race than a slow march to an almost inevitable win. Time to look at the numbers.
First of all, the straight up delegates out of Michigan: Sanders 69, Clinton 61
That means Sanders got 53.1% of the Michigan delegates. To be on a pace to catch up and win, he needed 60.2% of the delegates. He may have “won”, but he didn’t win by anywhere near enough to actually catch up with Clinton.
But Michigan wasn’t the only state handing out delegates. Mississippi did too. And Mississippi went for Clinton 32 to 4. So the total for the day was actually Clinton 93 to Sanders 73.
There were also some superdelegate updates since my last post. Net change: Clinton +4, Sanders +3.
So total since the Maine results on Sunday: Clinton 97, Sanders 76.
So Sanders only got 43.9% of the delegates since Sunday. This is not close to 60.2%.
Yes, Sanders pulled out a surprise win in Michigan. But he could duplicate that win in EVERY STATE from here until the end of the primary season and he STILL would not catch up. He would not win. He can’t catch up by “just winning”. He needs to win by huge margins to catch up. That did happen (barely) in Maine. But Michigan didn’t do it, and Sanders has only very rarely managed the margins he would need to catch up.
So, looking at the graph of “% of remaining needed to win”:
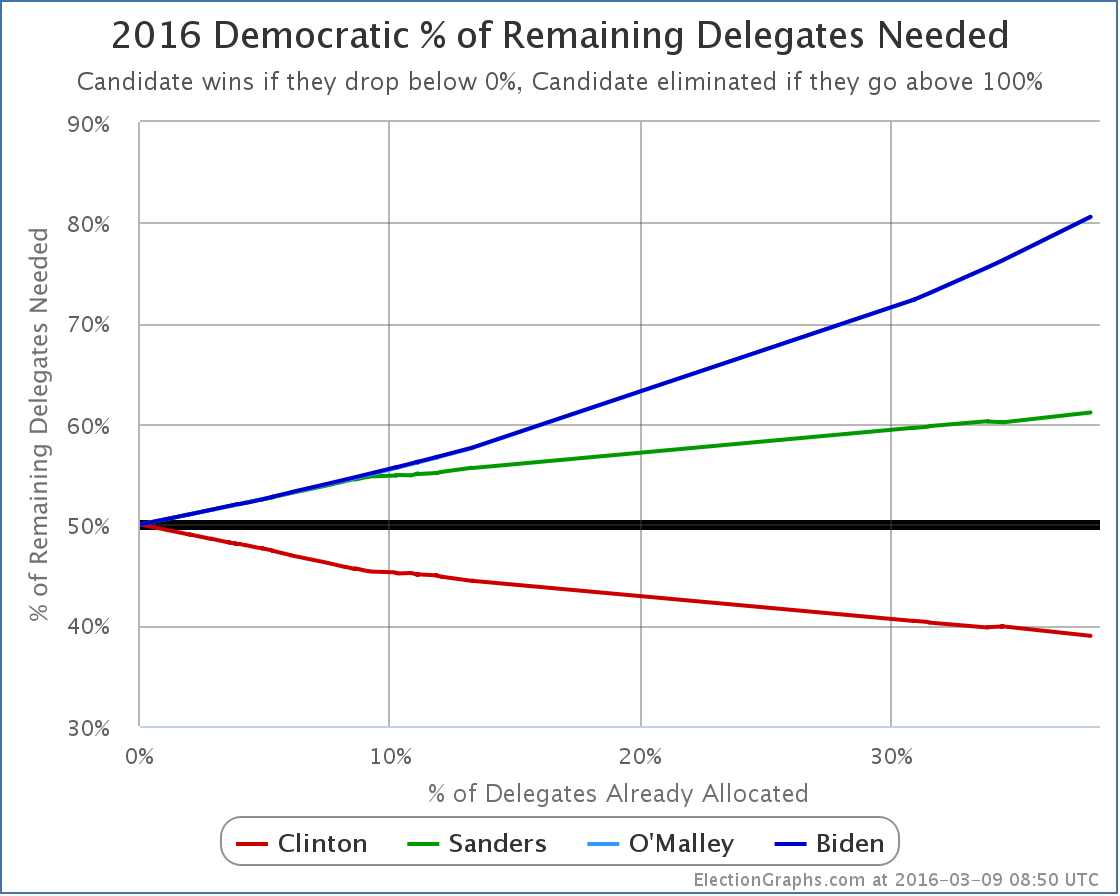
Clinton now needs 38.96% of the remaining delegates to win. Sanders needs 61.14% of the remaining delegates to catch up.
Oh, unless the superdelegates start changing their minds in massive numbers. That would make things harder for Clinton and easier for Sanders. And to be fair, if all 460 of Clinton’s superdelegates flipped to Sanders tomorrow, Sanders would indeed be ahead by 1035 delegates to 771.
I wouldn’t hold my breath on that one though.
Right now the totals are Clinton 1231, Sanders 575.
Next up are the Northern Marianas on Saturday, then Florida, Illinois, Missouri, North Carolina and Ohio next Tuesday.
[Edit 16:22 UTC to add the following exchange]
Minutes after I posted this update, I got a comment via Facebook that prompted me to do some additional analysis. It seemed directly relevant and interesting, so adding it here (lightly edited):
Jenn: Since superdelegates have never actually gone against the popular vote and could change their minds, what’s the math if we simply exclude them? I’m not saying it’ll happen. I’m just curious and too lazy to do it myself.
Sam: On superdelegates, my position is that if they ever start to change their minds because of the results of the pledged delegate race, we will see that because they will say so. So speculating about them changing their minds is pointless, you can actually watch and see if they do. If they start changing their minds, then it is a real thing and it will be measured and tracked as it happens. So long as they don’t, it is just a fantasy. But OK, I’ll quickly do the calculation of what things would look like if you only look at pledged delegates and assume superdelegates will follow the pledged delegate result.
[Edit 2016-03-10 16:07 UTC to strike through the calculation below due to really bad stupid math error that completely invalidates the result. Sanders needed percentage will be closer to 55%. Redoing calculations shortly.]
Sam: OK. Here goes. The current totals are Clinton 1231, Sanders 575, O’Malley 1. If you take out supers, that becomes Clinton 771, Sanders 552. Now, there are 2472 delegates total, so you need 1237 delegates to win. But that includes superdelegates. If the assumption is that supers will go for the pledged delegate winner, then you shouldn’t count them in the total number of delegates either because they now don’t matter. Without supers there are 1755 delegates, and you need 878 to win. Sanders therefore needs 326 more delegates to catch up and win. Between Clinton and Sanders they have collected 1323 delegates already. So there are only 432 pledged delegates remaining. 326/432 = 75.5%. So if you look only at pledged delegates it is actually WORSE for Sanders. He needs nearly 76% of the remaining delegates to catch up and win rather than “only” 61%.
[Edit 2016-03-10 17:30 to add additional conversation correcting the erroneous calculation. I am leaving the first version struck out above for the record. The below is lightly edited from the original Facebook conversation.]
Sam: Urg!!!! I made a huge error on those calculations! I blame it on…. Uh…. Being stupid. I used the total number of Republican delegates in one part of the calculation rather than the Democratic totals, which of course invalidates the whole thing. I suspect Sanders actually needs closer to 55% if you don’t count supers. I will redo the calculation.
Sam: OK, here goes again. I suck. Numbers that have changed bolded. The current totals are Clinton 1231, Sanders 575, O’Malley 1. If you take out supers, that becomes Clinton 771, Sanders 552. Now, there are 4765 delegates total, so you need 2383 delegates to win. But that includes superdelegates. If the assumption is that supers will go for the pledged delegate winner, then you shouldn’t count them in the total number of delegates either. Without supers there are 4048 delegates, and you need 2025 to win. Sanders therefore needs 1450 more delegates to catch up and win. Between Clinton and Sanders they have collected 1323 delegates already. So there are only 2725 pledged delegates remaining. 1450/2725 = 53.2%. This is significantly better than the 41.7% of pledged delegates Sanders has gotten so far, but it is not yet in the impossible zone by a long shot, and it is still better than where he is when you include superdelegates. Apologies for the stupid error.
Sam: I had actually checked and rechecked the calculation several times before posting it originally, but I made the same mistake every time. Sigh! Oh well!
Sam: See also this article by Andrew Prokop for more on what would be involved in a Sanders comeback. It was while reading this that I realized my error.
[Update 2016-03-10 06:45 UTC – Update in Michigan shifts 2 additional delegates from Sanders to Clinton. This does not substantially change the analysis above. In addition, the number of total “unpledged PLEOs” was adjusted in several states, giving a net addition of 1 total convention delegate.]
[Update 2016-03-11 05:29 UTC – Superdelegate update: Clinton loses one as a second superdelegate says they will just vote for the pledged delegate winner, putting them back in the uncommitted category for now.]
[Update 2016-03-12 23:50 UTC – Superdelegate update to prepare for March 12th results: Clinton +1, Sanders +1]
Note: This post is an update based on the data on ElectionGraphs.com. Election Graphs tracks both a poll based estimate of the Electoral College and a numbers based look at the Delegate Races. All of the charts and graphs seen in this post are from that site. Additional graphs, charts and raw data can be found there. All charts above are clickable to go to the current version of the detail page the chart is from, which may contain more up to date information than the snapshots on this page, which were current as of the time of this post. Follow @ElectionGraphs on Twitter or like Election Graphs on Facebook to see announcements of updates or to join the conversation. For those interested in individual general election poll updates, follow @ElecCollPolls on Twitter for all the polls as they are added.
[Edit 15:59 to fix one place I said Sanders instead of Clinton. Fixed. Thanks Jenn for pointing it out.]
[Edit 2016-03-10 21:12 UTC to fix author of Vox article I linked to.]
While we still have a live possibility of a contested convention, Donald Trump is still the Republican frontrunner and with the latest polls in Michigan, Trump weakens further against Clinton:
Those polls look like the long summer of Trump may be over, at least in Michigan. Trump was never leading in Michigan, but for awhile it seemed like he might make it close. The newest poll may be an outlier, no way to tell without more polling. But for now, Michigan seems like it is reverting to being a “Strong Clinton” state.
This takes Michigan out of the list of states that could easily go either way in a Clinton vs Trump general election and lower’s Trump’s best case:
Trump’s best case drops from winning by 102 electoral votes to only winning by 70. The “expected” case remains Clinton winning by 50 electoral votes.
Looking at the spectrum of states, the “tipping point” has also changed. It used to be Michigan where before the latest poll Clinton had led by 3.6%. It is now Nevada where Clinton leads by 3.9%. This is the worst the tipping point has been for Trump since the beginning of Clinton vs Trump polling:
This trend is not one Trump should be happy about, but make no mistake… it is still a close race. A 3.9% lead can disappear in an instant. Just three states (Iowa, Ohio and Nevada) have to flip to make Trump the winner.
247.2 days until polls start to close. Stay tuned.
Note: This post is an update based on the data on ElectionGraphs.com. Election Graphs tracks both a poll based estimate of the Electoral College and a numbers based look at the Delegate Races. All of the charts and graphs seen in this post are from that site. Additional graphs, charts and raw data can be found there. All charts above are clickable to go to the current version of the detail page the chart is from, which may contain more up to date information than the snapshots on this page, which were current as of the time of this post. Follow @ElectionGraphs on Twitter or like Election Graphs on Facebook to see announcements of updates or to join the conversation. For those interested in individual general election poll updates, follow @ElecCollPolls on Twitter for all the polls as they are added.
Yeah yeah, Super Tuesday. Yeah, yeah, all the other states coming right afterwards. But we have new general election polls!
Since my last update there have been new polls in Michigan, New Hampshire and Kansas. From all of this, two major candidate pairs had changes to their summary status on my site. And this time, that includes the frontrunners:
Clinton vs Trump
The categorization of Michigan did not change. “Weak Clinton” before, “Weak Clinton” now. But Michigan was the tipping point in Clinton vs Trump, so when Michigan moves, so does the tipping point:
The tipping point moves from a 3.0% Clinton lead in Michigan to a 3.6% Clinton lead in Michigan. Either way, 3.6% is still a narrow lead. Only 1.3% of people changing their minds, or undecideds flipping the right way, would put Trump in the lead. The question is if we are now in a trend away from Trump in this metric, or if we are just bouncing around in a range as new polls jitter the averages. Too soon to tell. But once the primary races are both settled to the point where it is hard to deny the winners are the winners, we will start seeing an acceleration of general election polling, and we should start to see if there are really any trends here.
Clinton vs Rubio
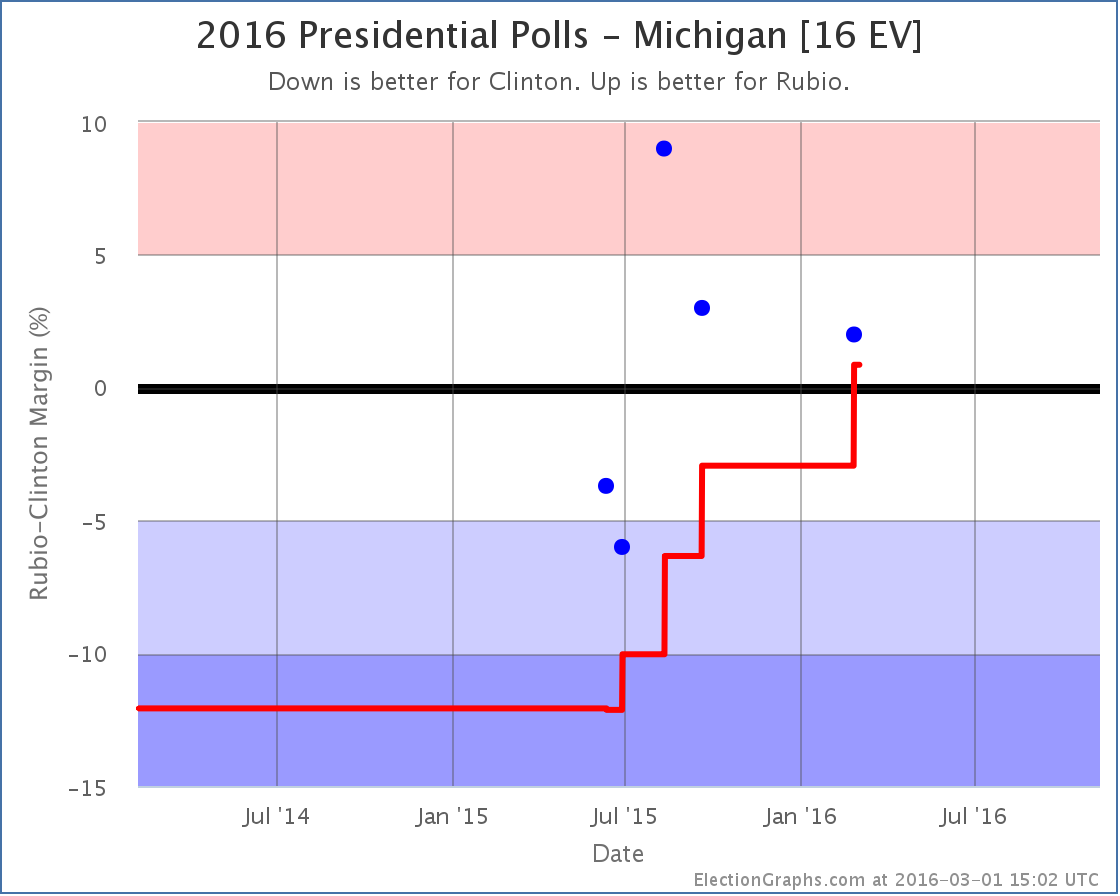
With the latest Michigan poll, Rubio leads in the poll average, which now shows a 0.9% Rubio lead. This moves Michigan from “Weak Clinton” to “Weak Rubio”. It is a close state that could easily go for either candidate, but with this change we move Michigan’s 16 electoral votes into Rubio’s column for the “expected” case where each candidate wins every state they are ahead in.
The move is extra significant this time because it actually puts Rubio over the top to win the whole shebang:
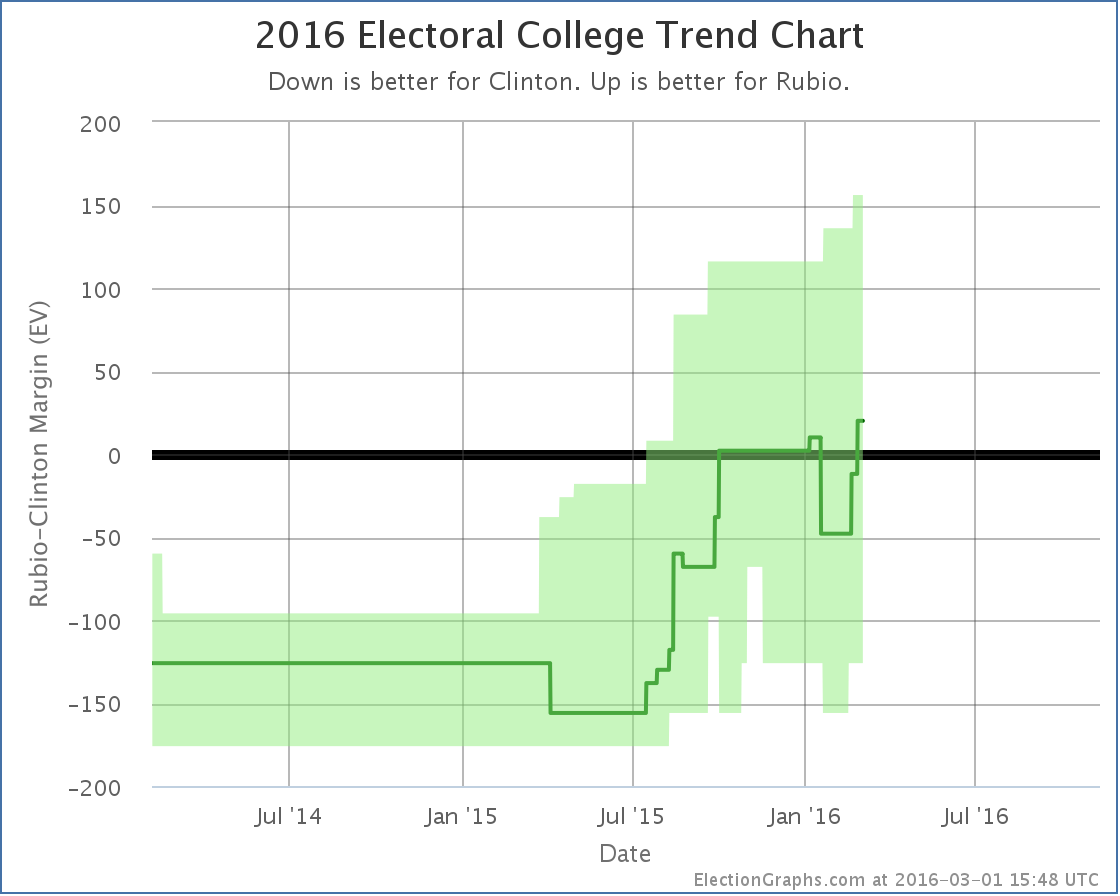
With this, the range of possible outcomes that seem reasonably possible is still everything from Clinton winning by 126 to Rubio winning by 156, but the expected result is now a Rubio win by 20 electoral votes.
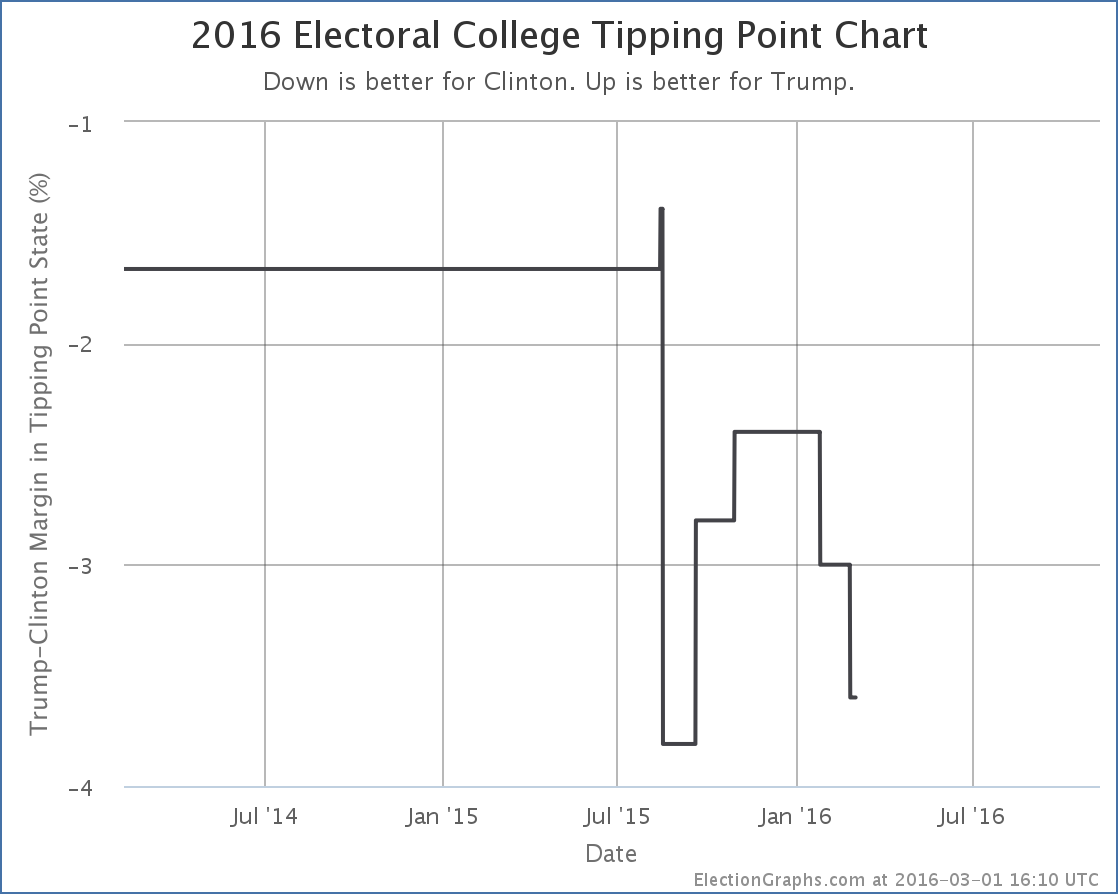
This is also reflected in the tipping point:
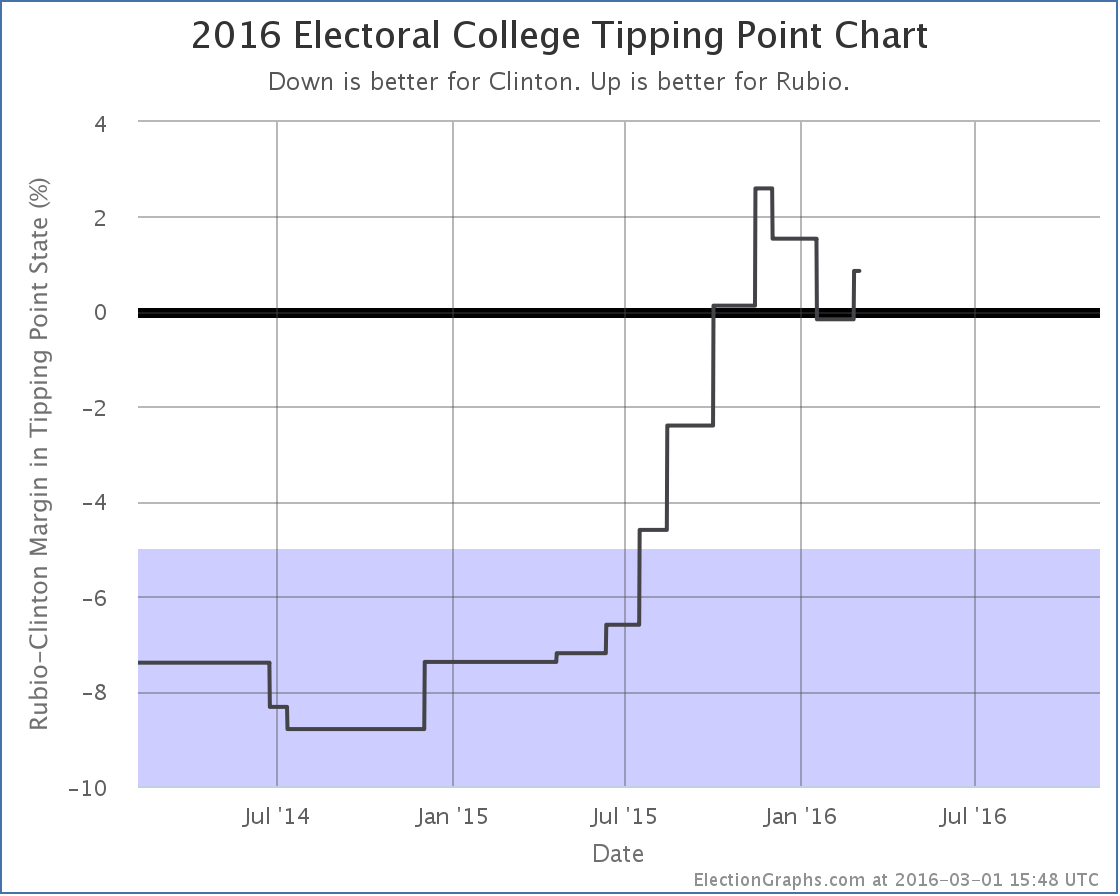
The tipping point moves from Florida, where Clinton led by 0.8%, to Michigan where Rubio is now ahead by 0.9%.
Clinton vs Rubio remains a very close race. But Rubio now has a small advantage.
Others
Clinton vs Kasich is neither a front-running pair, or in the top five best polled combinations, so I won’t consider it fully here other than to note that the latest New Hampshire poll moved Kasich into the lead, changing his expected case from losing to Clinton by 46 electoral votes, to losing to Clinton by 38 electoral votes.
252.2 days until polls start to close on Election 2016.
Note: This post is an update based on the data on ElectionGraphs.com. Election Graphs tracks both a poll based estimate of the Electoral College and a numbers based look at the Delegate Races. All of the charts and graphs seen in this post are from that site. Additional graphs, charts and raw data can be found there. All charts above are clickable to go to the current version of the detail page the chart is from, which may contain more up to date information than the snapshots on this page, which were current as of the time of this post. Follow @ElectionGraphs on Twitter or like Election Graphs on Facebook to see announcements of updates or to join the conversation. For those interested in individual general election poll updates, follow @ElecCollPolls on Twitter for all the polls as they are added.
|
|