- 01:31:47 Reading – Trump Could Have Avoided Paying Taxes for Nearly Two Decades (Barstow/Craig/Buettner/Twohey) https://t.co/YVW5bb6YBs
- 01:38:37 Retweeted @jeffjarvis 01:38:20 The 18-year timeframe depends entirely on his claimed income in those years. Better perhaps to say he could shield… https://t.co/wXilptozvs
- 01:45:27 Retweeted @pattonoswalt 01:40:58 Oh wow. Whoever sent Trump's tax returns to the @nytimes sent them from Trump Tower. Oh WOW.
- 01:45:45 Retweeted @jeffjarvis 01:44:22 I can put a return address of the North Pole on my mail. Don't know why people are making a point of this. https://t.co/U1HGuw79Wl
- 01:58:47 Real Oct surprise will not be taxes it will be if Jane Doe decides to break her anonymity & directly accuse Trump -> https://t.co/D0Jt2eA2WG
- 02:19:24 Retweeted @sinderbrand 02:18:33 Again, missing from the Trump team statement about the @susannecraig taxes story: the words "inaccurate" or "wrong"… https://t.co/vdESRHzftt
- 02:36:08 Retweeted @jmproffitt 02:27:06 So when Mitt Romney was complaining about the 47% that don't pay taxes, he was talking about Trump.
- 02:54:15 Retweeted @arnonmishkin 02:53:11 Oh, to be a fly on the wall as Trump's staff try to take his phone from him before bedtime https://t.co/g06UWm2Gm8
- 03:23:23 For everybody talking about Trump’s taxes being “the” October surprise, there is plenty of October left… there can be more than one. :-)
- 03:28:22 Retweeted @juliacarriew 02:43:55 Marla returns to her apartment from the post office. She pulls off her gloves. "You should've changed one diaper," she says. "One. Diaper."
- 03:29:20 Retweeted @joshtpm 03:29:06 Non trivial chance Trump spends the next week doubling down on "Yeah I paid no taxes. That means I'm smart."
- 03:51:24 [Blog Post] Electoral College: Some post-debate Clinton gains https://t.co/79iinBatA9
- 04:15:15 Retweeted @NumbersMuncher 03:25:07 RT if you made at least 915 million dollars more than Donald Trump did in 1995.
Fav if you're an even worse busine… https://t.co/AxQHgGTEKR
- 04:21:17 Retweeted @ForecasterEnten 04:15:40 My guess is that Trump could get this tax story out of the press if he finally shoots someone on 5th ave.
- 05:01:54 Retweeted @elongreen 2016-09-30 11:35:22 The best thing the Clinton campaign could do is schedule tweets @ Trump at 15 minute intervals after midnight. He'd never sleep again.
- 05:05:35 Retweeted @JessicaValenti 03:48:28 Tiffany Trump rn https://t.co/WO0wsuWgKe
- 05:06:02 Retweeted @NumbersMuncher 04:35:57 It's this simple: If Trump was as successful and generous as he claims to be, he would've released his tax returns a year ago. End of story.
- 05:07:07 Retweeted @gauravsabnis 2016-10-01 00:41:09 "Donald Trump is the only person I know who drunk-tweets…. sober!"
– @ananavarro on CNN winning the internet while skewering Jeffrey Lord - 05:17:01 Retweeted @williamjordann 03:47:11 Monday: Debate
Tuesday: Machado
Wednesday: Polls
Thursday: Cuba
Friday: Porn
Saturday: Taxes - 05:17:44 Retweeted @JYSexton 04:52:46 I know when I wake up there will be insane tweets waiting for me. It's like Christmas, only Santa Claus never tried to ruin the country.
- 05:17:54 Retweeted @brianefallon 01:56:29 Trump arrived late to his event tonight & gave a particularly unhinged set of remarks. Clearly he was sweating this looming NYT report
- 05:19:57 Retweeted @origiful 03:37:22 Has anyone gone in and tried to digitally enhance this image? The quality almost looks good enough to actually read… https://t.co/QJxwJhq2bW
- 05:20:09 Retweeted @origiful 03:50:00 Well, here is Donald Trump's 2014 tax return if anyone is interested. https://t.co/kNY19Snlx7 in reply to origiful
- 05:20:29 Retweeted @origiful 04:20:27 Looks like 8879 PE https://t.co/Pgrq7YP27M & I read:
Gross less returns: 35m
Gross profit: 4m
Loss: 73m
Real estate loss 800k
Other: blank in reply to origiful - 05:24:26 Retweeted @JSheltzer 02:56:58 Adjusted for inflation, Trump's '95 tax loss is more money than NASA spent sending the rovers Spirit and Opportunity to Mars in reply to JSheltzer
- 05:24:31 Retweeted @JSheltzer 02:19:32 Adjusted for inflation, Trump's '95 tax loss represents more money than the NIH spends on breast, lung, colon, and liver cancer – combined.
- 05:26:53 Retweeted @SteveKopack 05:14:14 A tweet from Trump confidant says Clinton "is done" on Wednesday and includes #Wikileaks hashtag.
What does this… https://t.co/nD3vRAfO7Z
- 05:27:01 Retweeted @backwards_river 2016-10-01 05:04:03 @LPDonovan Nifty find. Trump pressuring his future wife to pose for Playboy. Personally negotiated the fee. https://t.co/P4AMmx10ls in reply to LPDonovan
- 12:19:11 Completely off the rails -> As news of Trump’s taxes breaks, he goes off script at a rally in Pennsylvania (Johnson) https://t.co/WxhMZcBNV0
- 17:49:56 Reading – Is the Times Revelation Just the Tip of the Iceberg? (@joshtpm) https://t.co/UaAXeRihrg
- 17:53:15 Retweeted @BenjySarlin 02:05:16 This week is like if Dukakis got in the tank, saw the TV coverage, got back in the tank, drove cross country while staff begged him to stop
- 17:55:58 Retweeted @JamesMelville 2016-09-19 21:32:27 Every picture tells a story. https://t.co/mnD68fA8JZ
- 18:20:51 Retweeted @timkmak 14:43:07 Chuck Todd: But you have a history of infidelity
Rudy Giuliani: Everybody does - 18:23:24 Retweeted @hblodget 17:14:35 GIULIANI: "Don't you think a man who has this kind of economic genius is a lot better for the US than a woman?" (!!) https://t.co/6uCmkrqOVt
- 18:25:07 Retweeted @NickTimiraos 17:59:17 2012: 47% of Americans pay no income taxes…
2016: …and they are geniuses. - 18:36:11 Reading – The Time I Found Donald Trump’s Tax Records in My Mailbox (Susanne Craig) https://t.co/STptHqYXf1
- 20:00:55 Reading – Will Media “Rape Silence” End Now That a “Casey Anthony Attorney” Has Joined the Trump Suit? (Bob Frump) https://t.co/VuGsdMkAZm
- 22:44:42 Reading – Some comments on the New York Times story about Donald Trump's tax returns (John, Bronte Capital) https://t.co/euNvdy6fFP
- 22:45:53 Retweeted @benjaminmoser 13:29:34 If you're applauding Trump's gaming of the system, I never want to hear your thoughts about who's taking advantage of welfare again. Ever.
- 22:59:48 Retweeted @imbou 22:57:51 @abulsme the tax guy you quoted gave more depth to how I argued the Donald had that loss he must have sold whatever… https://t.co/G6U7NewaCt
- 23:24:02 Reading – Whatever is actually in Trump’s tax returns is worse than what the New York Times says (@ezraklein) https://t.co/QIRxjlBEn9
|
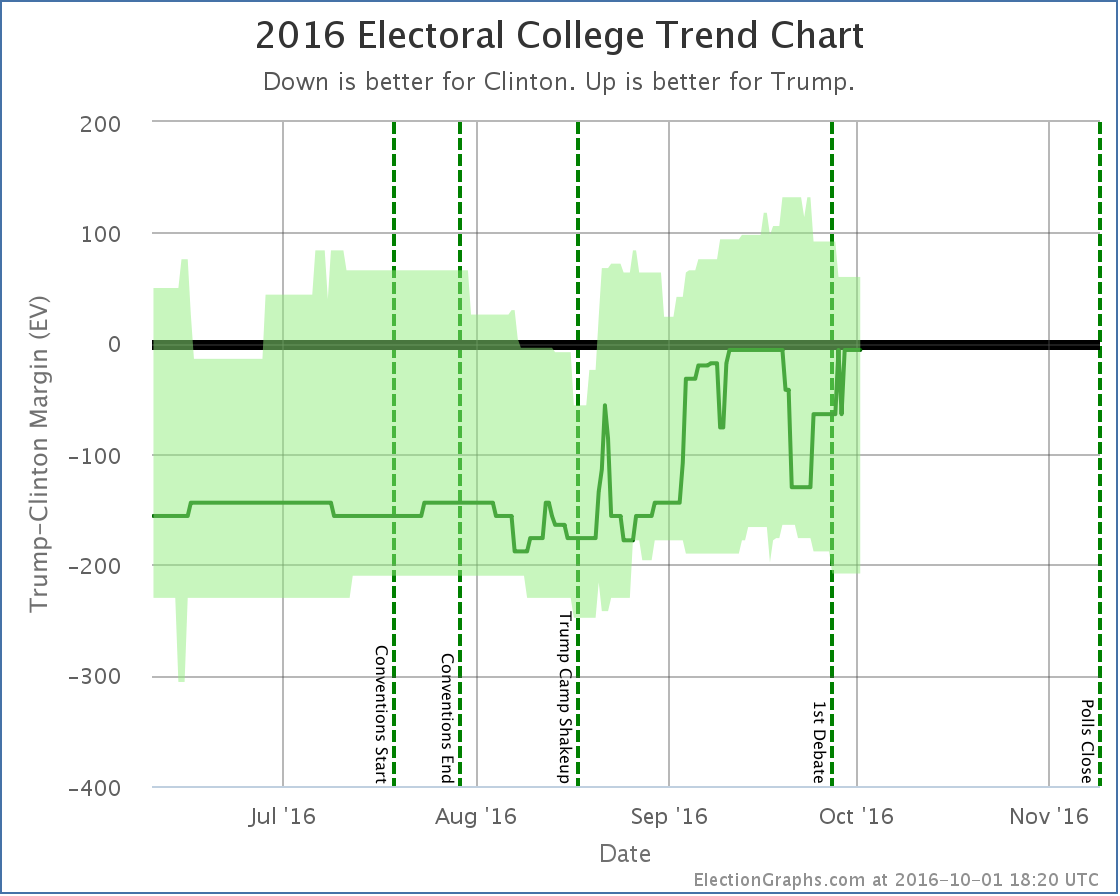
States with new poll data added since the last update: New Jersey, Florida, Nevada, Michigan, New Hampshire, California, Massachusetts. National SummaryThe newest batch of polls… mostly post-debate polls… results in movement toward Clinton and away from Trump, which matches the consensus expectations after the debate this week:
Looking at the charts:
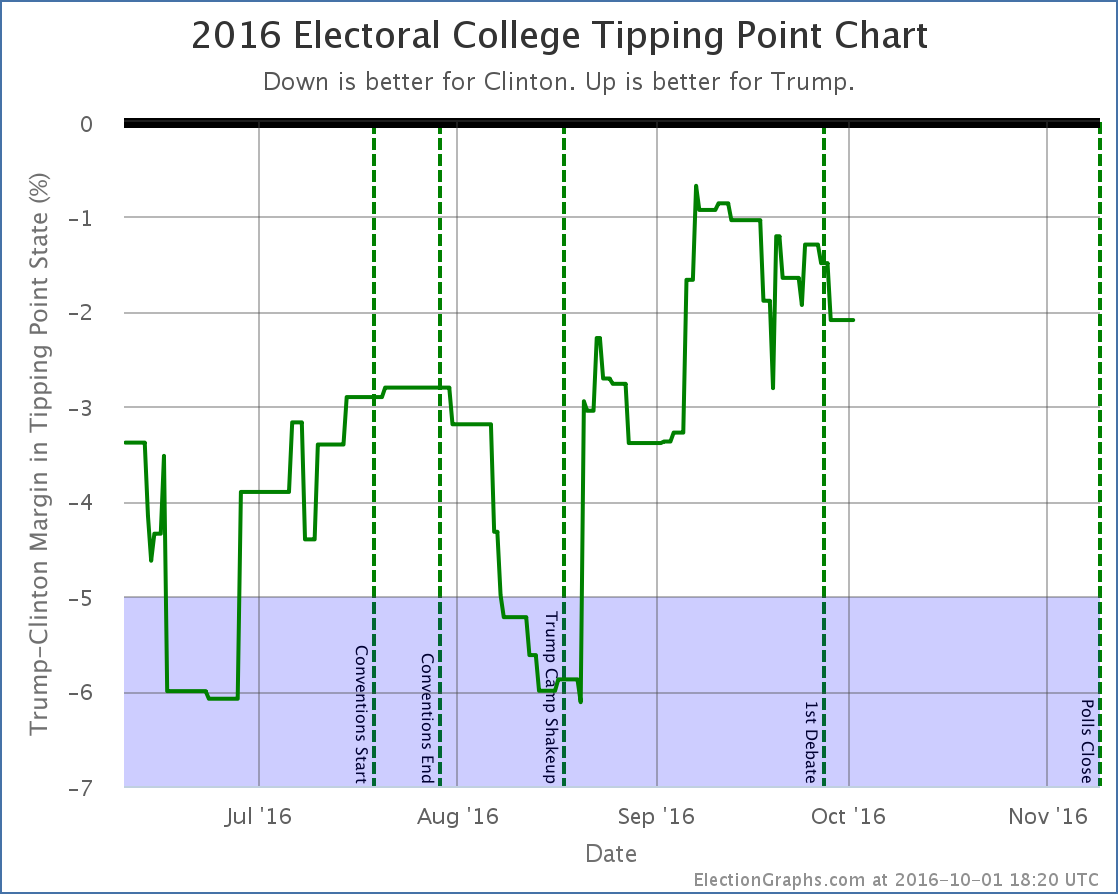
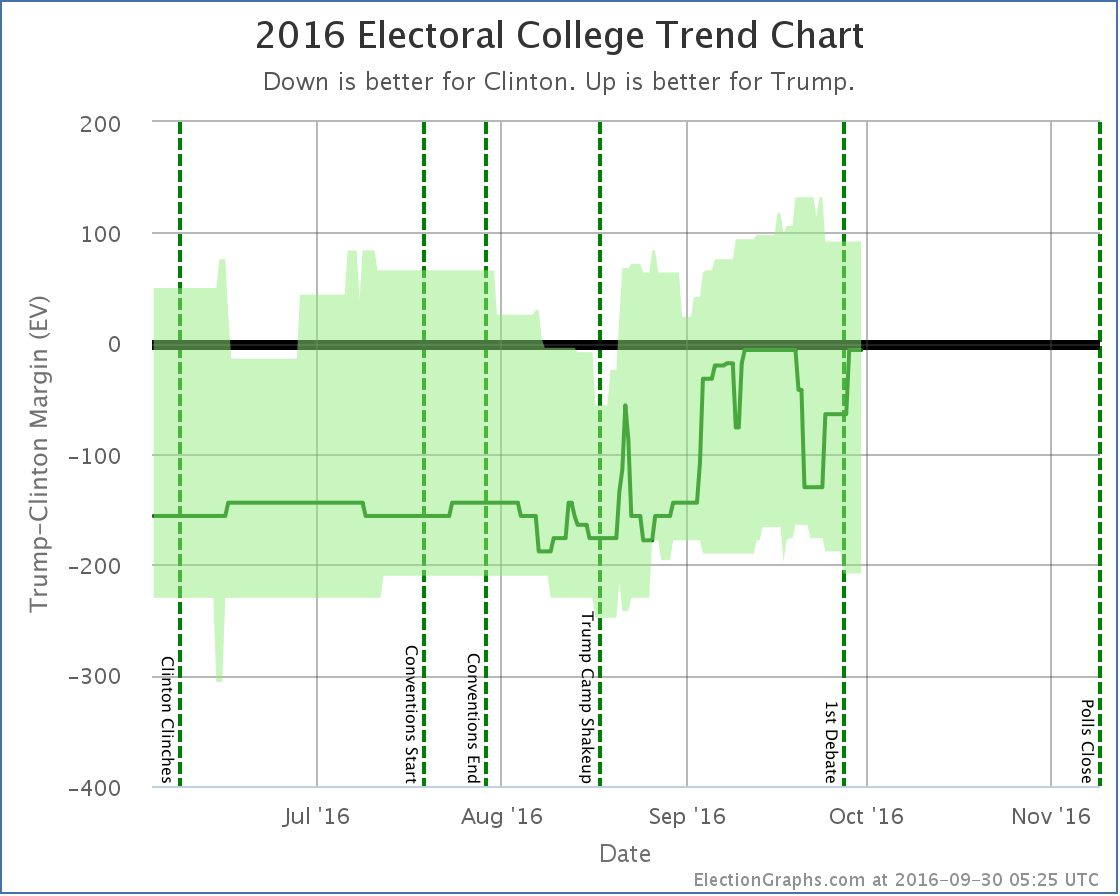
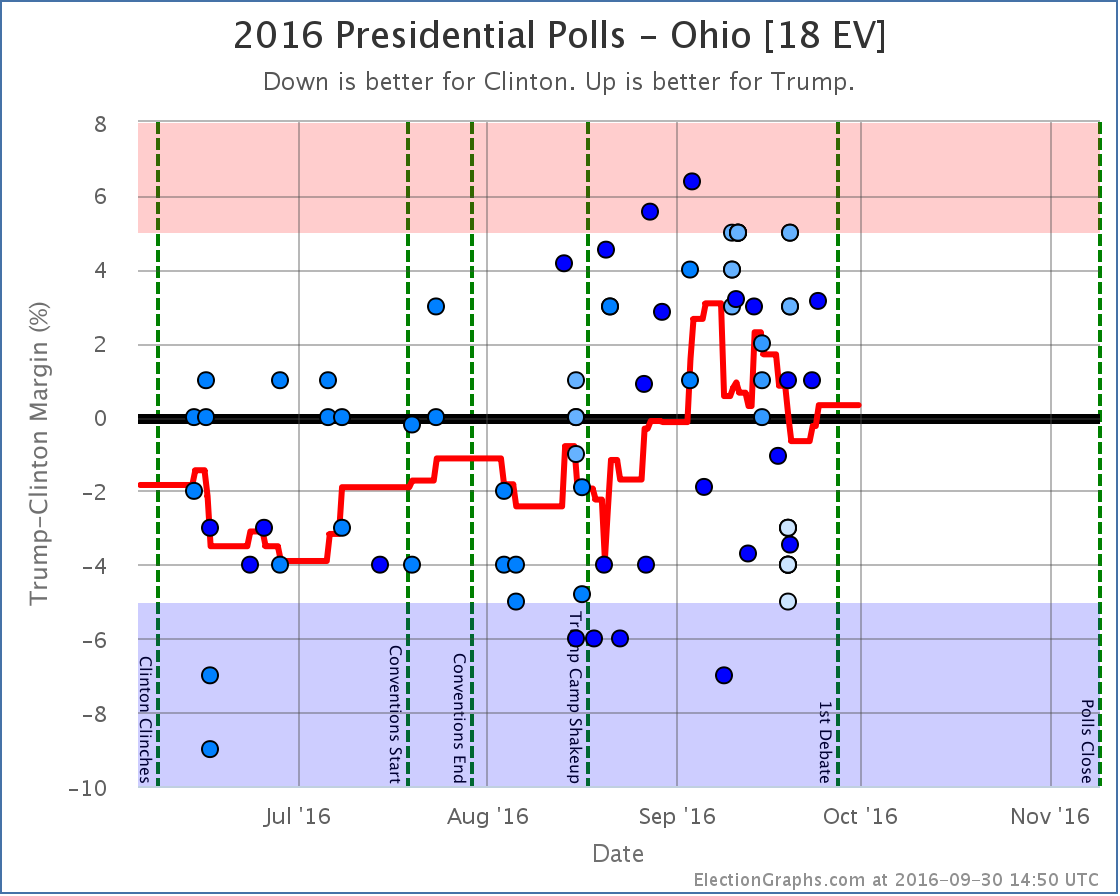
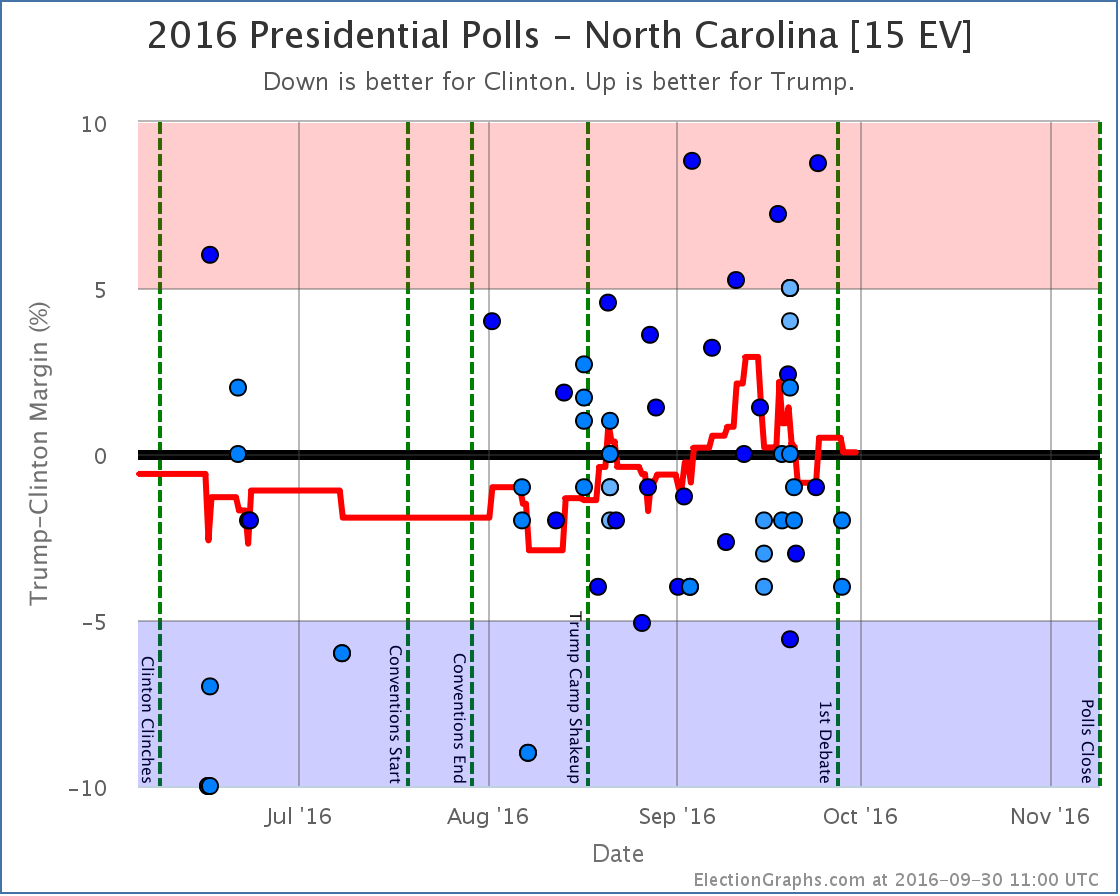
Although polls may still come in that change the shape of the last couple weeks, right now a clear pattern is emerging where both “best cases” have been moving in Clinton’s direction since about September 20th. More states are coming into Clinton’s potential reach, while other states are moving out of Trump’s reach. Interestingly, the “expected” case, although it has fluctuated as big states move back and forth across the center line, is back at the same place it was in mid-September… Clinton leading by an extremely narrow 6 electoral votes. But there are six states where the average shows Trump leading by less than 0.5%… North Carolina, Nevada, Kansas, Ohio, Florida, and Iowa. Even if you don’t believe Kansas (I am personally dubious about that one), that means there are 74 electoral votes where Trump is hanging on by a thread. If more polls pull those five non-Kansas states away, his expected case drops all the way to an 154 electoral vote loss. Things look very close in the electoral college right now, but that could change in a hurry! The volatility of the electoral college measure means to really judge how “close” the race is, we’d be better off looking at the tipping point:
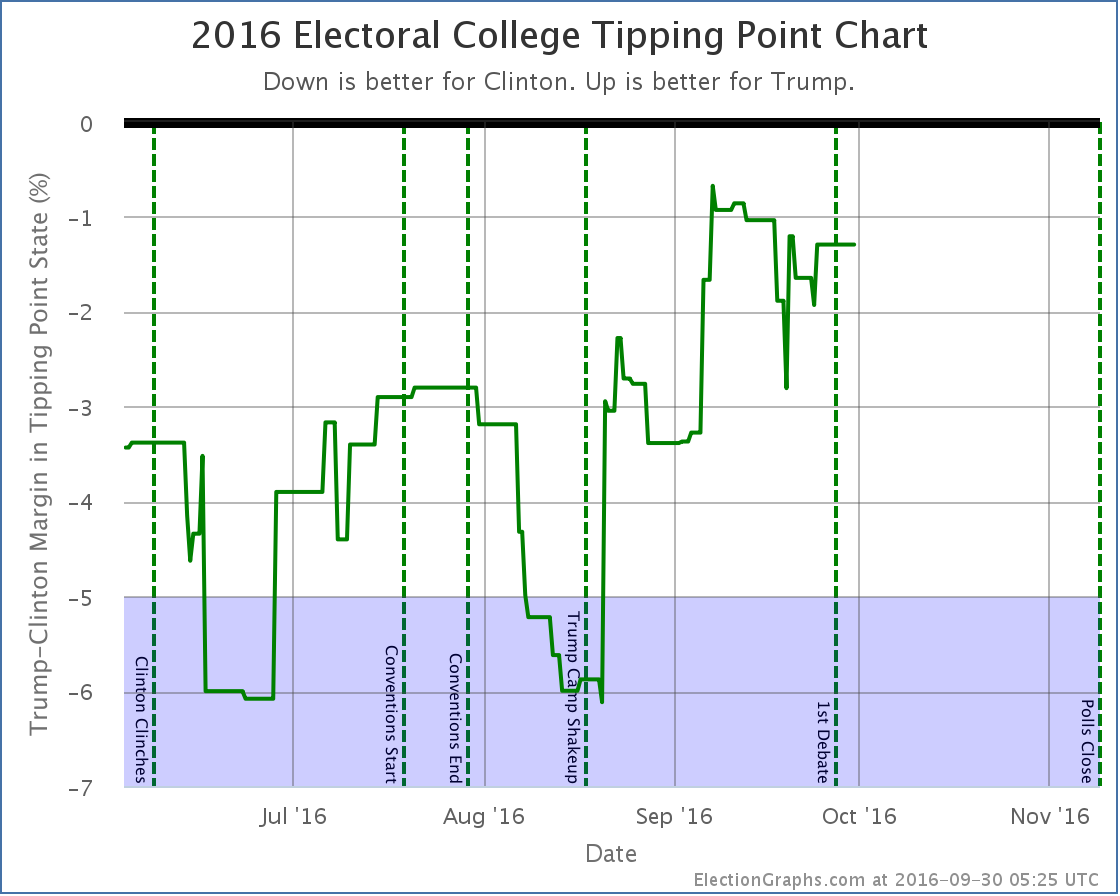
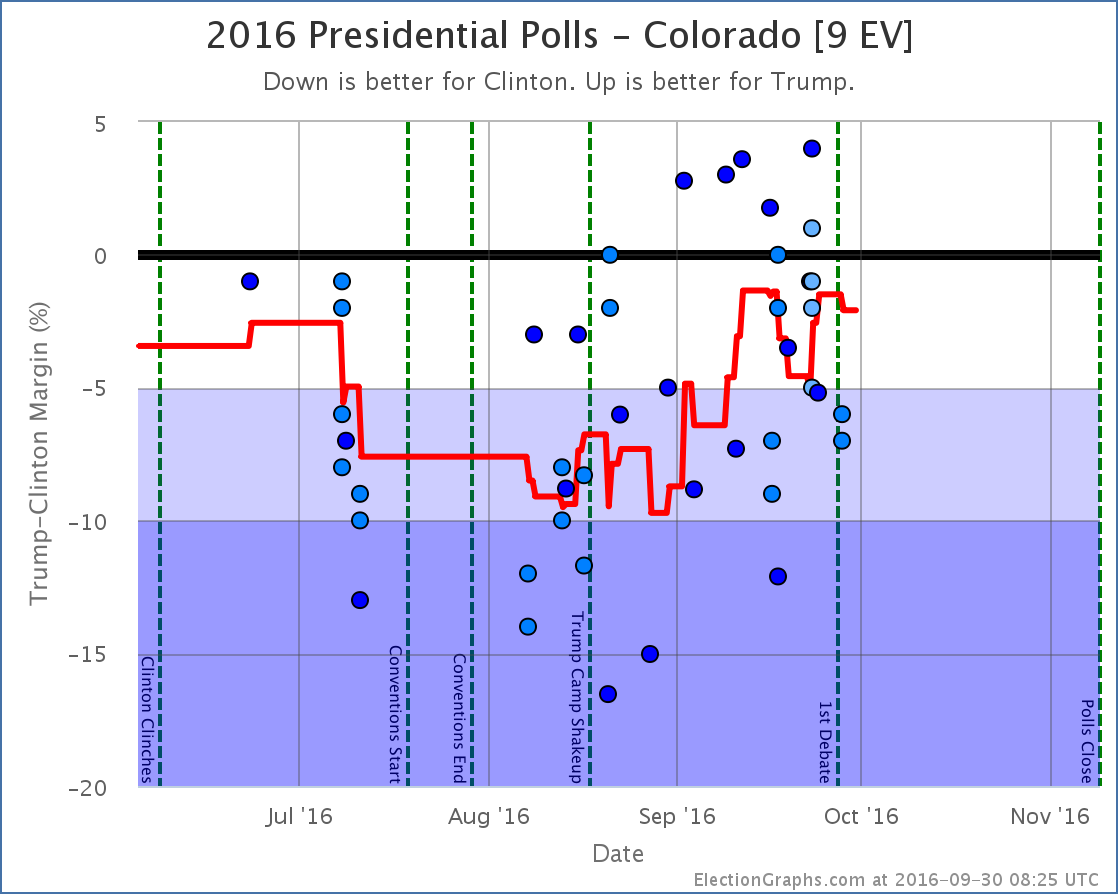
Although the tipping point also has ups and downs as states move around, there is a trend here too. Trump peaked on September 7th when Clinton was ahead by only 0.7% (in Nevada). Since then, Trump has been losing ground. With the latest post-debate drop, Clinton’s lead in the tipping point state (now Colorado) is up to 2.1%. At the moment Trump only has to flip Colorado to be in the lead. And a 2.1% lead is not a huge margin there. This is still close. Just not at close as it was. So far the post-debate moves actually look more like a continuation of trends that started earlier rather than a big change caused by the debates, but even after five days, most of the close states just have a small number of post-debate polls, so we may not be seeing the complete picture yet. 37.9 days, 2 presidential debates, and 1 VP debate left to go until polls start to close… State DetailsAll the state level details for those who want to dig in… Weak Clinton to Strong Clinton
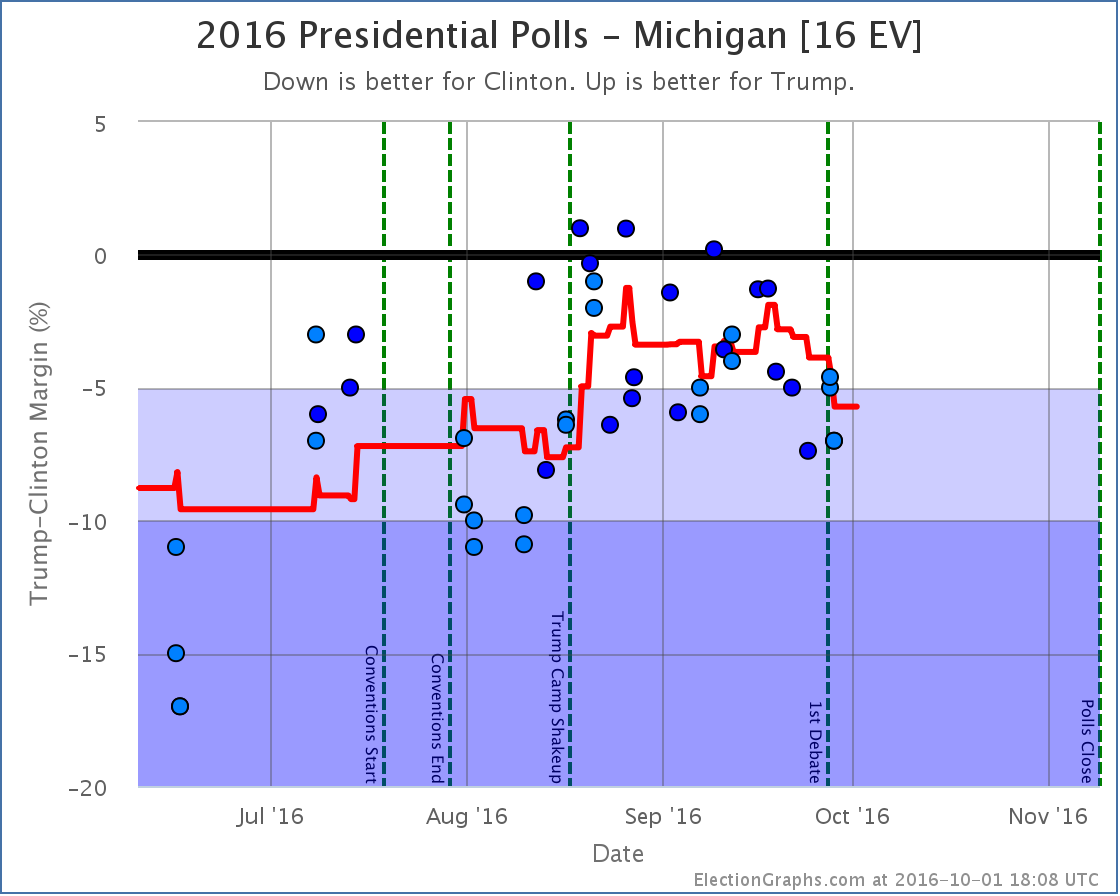
The poll average in Michigan has been moving toward Clinton since September 18th. With the latest update, which included two separate post-debate polls, Clinton’s lead increases to 5.7% which moved the state out of reach for Trump, leading to the reduction of his best case mentioned above. Didn’t change categories, but moved the tipping point
Weak Trump to Weak Clinton then back again
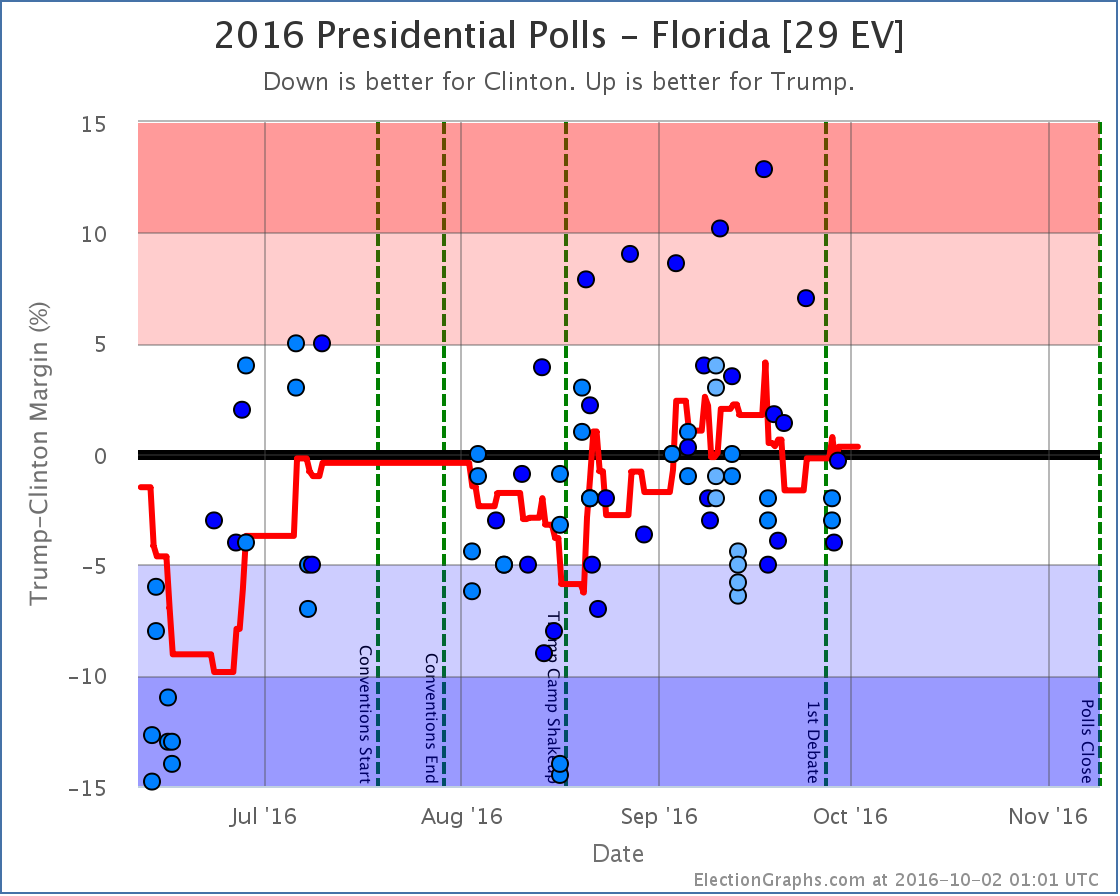
With the latest batch of polls Florida moved from just barely Trump to just barely Clinton, then moved right back again. As this round ended, Florida ends up with an 0.3% Trump lead. The bottom line with Florida is it has been “close” for all but a few days since the conventions ended. Unless we start seeing a definitive movement in one direction or another, Florida remains “too close to call”. Having said that, Trump has been boosted by outlier Google polls. In the chart above, EVERY poll showing Trump with a lead more than 5% has been a Google poll. Those polls really do look like outliers. If you took Google out, Clinton would be maintaining a small but clear lead in Florida… but we include everything, and so Florida is still hovering right around the zero line. For more information…This post is an update based on the data on ElectionGraphs.com. Election Graphs tracks both a poll based estimate of the Electoral College and a numbers based look at the Delegate Races. All of the charts and graphs seen in this post are from that site. Additional graphs, charts and raw data can be found there. Follow @ElectionGraphs on Twitter or like Election Graphs on Facebook to see announcements of updates or to join the conversation. For those interested in individual general election poll updates, follow @ElecCollPolls on Twitter for all the polls as they are added. If you find the information in these posts interesting or useful, please consider visiting the tip jar.
This week on Curmudgeon’s Corner: Of course Sam and Ivan talk about the first Clinton vs Trump debate and its aftermath as it played out during the week. That’s most of the show this week, but they also touch on Ivan’s recent trip, altitude sickness, and some questions and comments from listeners. Click below to listen or subscribe… then let us know your own thoughts!
Show Details: Recorded 2016-10-01
The Curmudgeon’s Corner theme music is generously provided by Ray Lynch. Our intro is “The Oh of Pleasure” (Amazon MP3 link) Our outro is “Celestial Soda Pop” (Amazon MP3 link) Both are from the album “Deep Breakfast” (iTunes link) Please buy his music and support his GoFundMe.
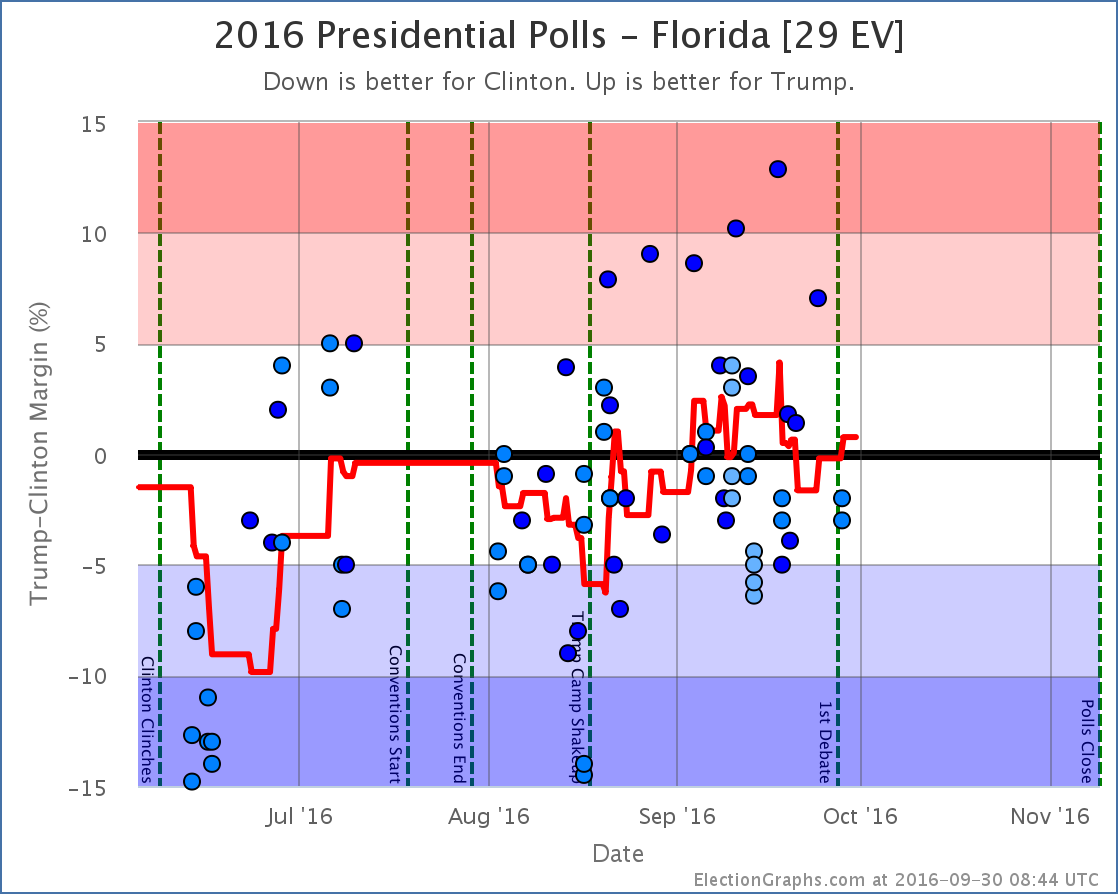
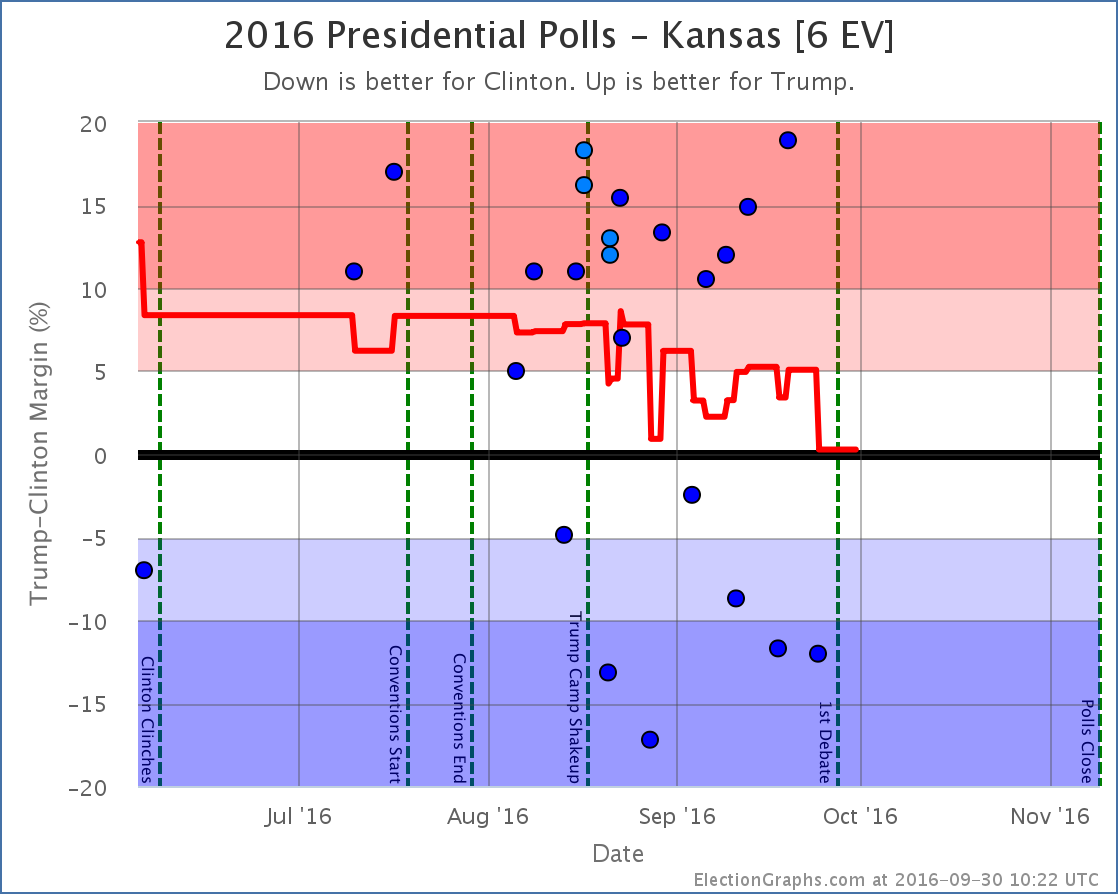
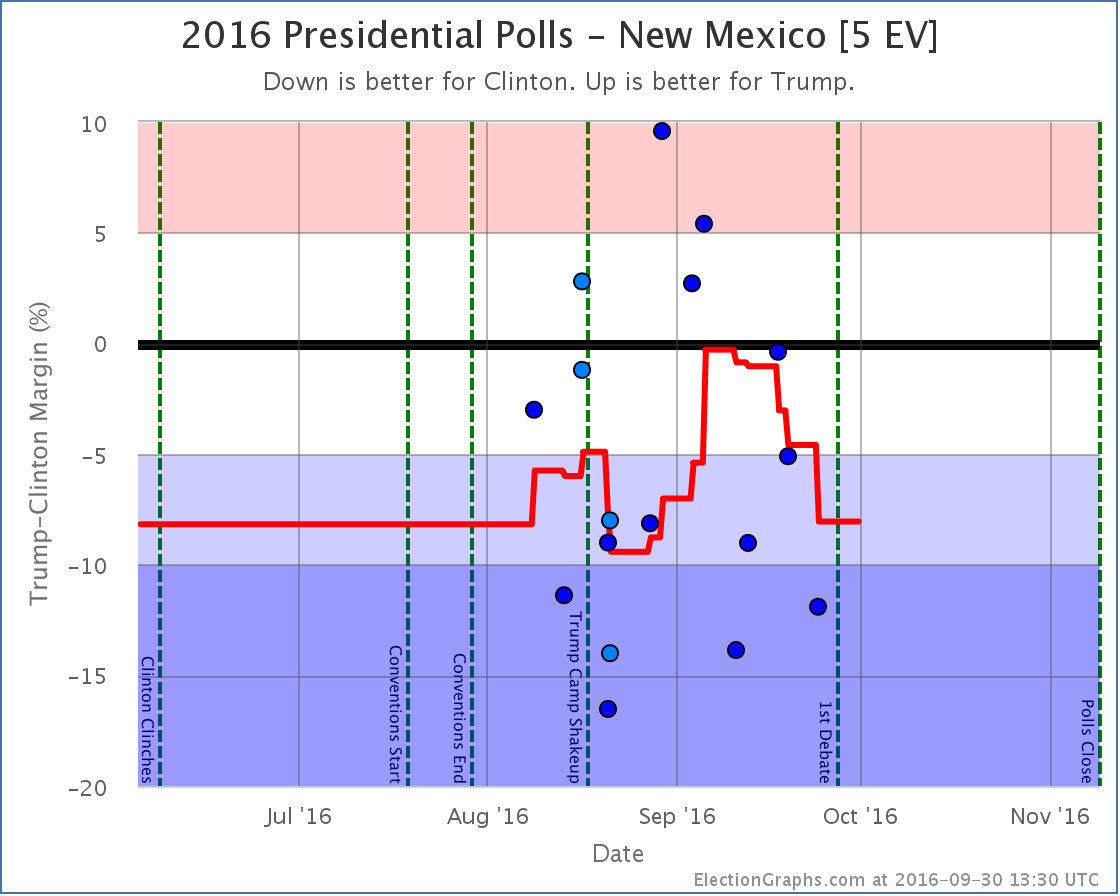
States with new poll data added since the last update: All 50 states, and DC. Notable changes in the tipping point plus New Mexico, Maine (at large), Kansas, and Missouri. National SummaryWith the latest batch of updates, there was a lot of churn that caused some big movements if you look at the charts. For a while as I entered polls it looked like Trump’s peak was definite and a clear downward trend was in place, even before the debate. But then as I continued to enter polls, most of those Clinton gains were reversed. The primary reason for this? Florida [29 EV], Ohio [18 EV], and North Carolina [15 EV] are all currently very close in my averages. Close enough that single polls can move them back and forth across the center line. As I worked through this round of poll updates, all three of these states moved from Weak Trump to Weak Clinton and back again. Now, the actual changes in the averages in these three states were not much. They just happened to pass the zero line, and have large numbers of electoral votes. So if you look at the “Expected Case” chart for the electoral college, you see a big move toward Clinton, then a big reversal a few days later. Because of the nature of the electoral college, you should expect (and be careful interpreting) large electoral college moves like this so long as there are big states that are close. In these cases looking at the tipping point provides a different view with a bit less volatility. In any case, looking only at the final net change from this round of polls, we see these changes in the national picture:
Now, this round includes a handful of post-debate polls, but almost all of the movement discussed here comes from before the debate. (The exception is Florida returning to Weak Trump after the debate.) Looking at the charts…
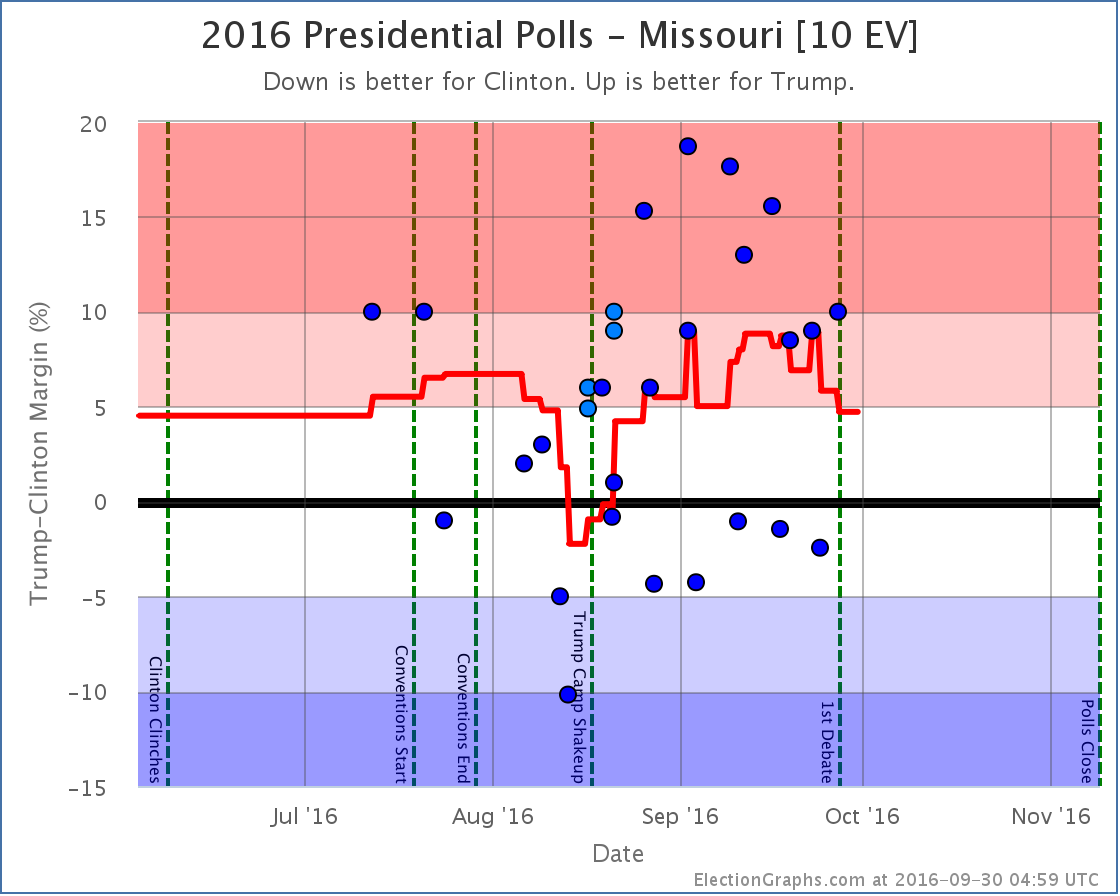
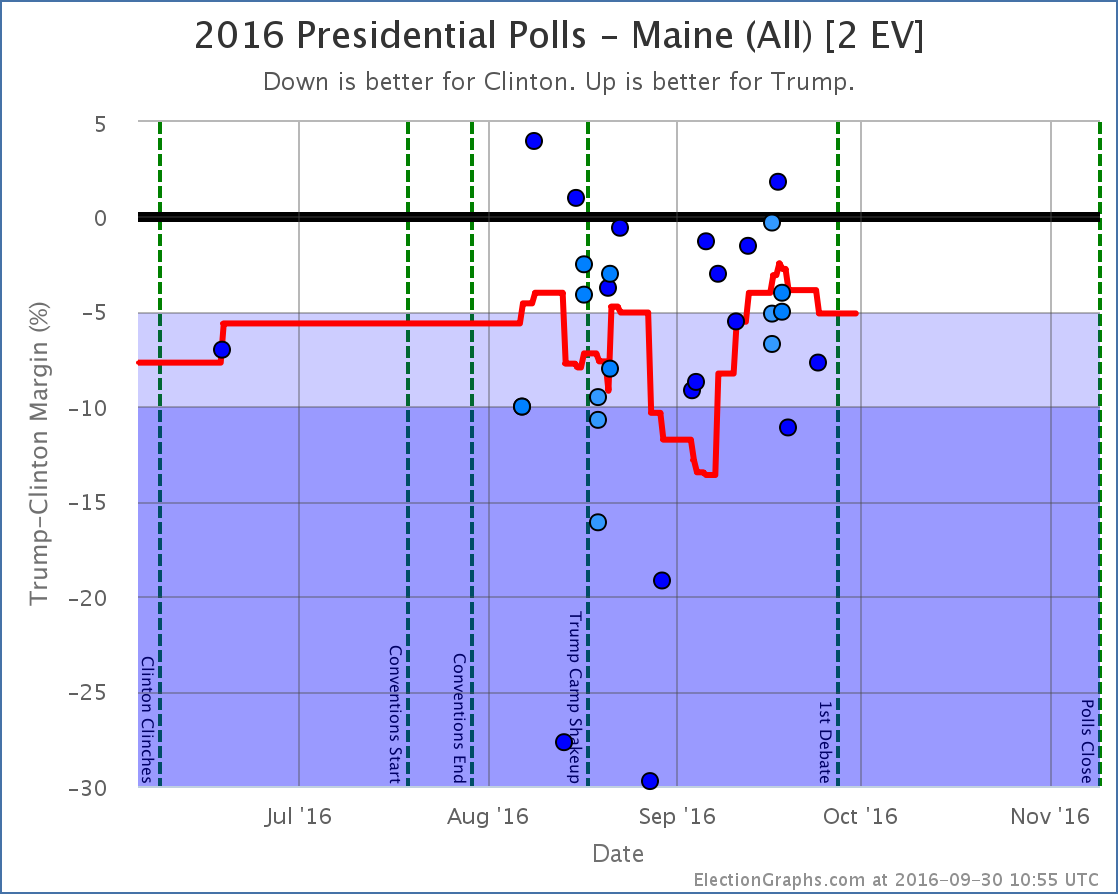
Notice the clear dip from about September 19th to September 28th when Florida, Ohio, and North Carolina went slightly blue, then moved slightly red again. In the end, the “expected case” remained flat. The movement Clinton saw from winning by 6 electoral votes to 8 electoral votes in the last update was erased by New Mexico and Kansas both returning to their “normal” colors. Both “best cases” moved toward Clinton though, with New Mexico and Maine at large both moving out of Trump’s reach, while Missouri moved into Clinton’s reach.
The tipping point chart doesn’t end up with huge moves when big states cross the center line, so it might be a better chart to look at right now to see how the race is moving. What we see is that after big gains starting with Trump’s campaign shakeup on August 17th, Trump seems to have peaked around September 7th… way up from where he had been, but never actually taking the lead… and he has been on a slow decline ever since… but we haven’t yet seen a BIG move back toward Clinton. By most reports, Trump did badly in the debate, and has been doing things counter-productive to his campaign since the debate. But this does not mean large numbers of people have changed sides. Maybe this will happen, maybe it won’t, but the small number of post-debate polls already included here don’t yet show it. (In fact, as I mentioned, the single state category change post-debate so far is a move toward Trump.) Additional post-debate polls are coming in quickly now, but I had to cut off the round poll updates somewhere to get this blog post out. There will be another update soon enough, and we’ll start to see a bit better what (if any) lasting change comes out of the first debate. Of course just about as soon as there has been enough time to see that in the polls, it will be time for the next debates… 39.4 days left until polls start to close. State DetailsFor those digging into the details, here are the charts for all the states influencing the analysis above: The big close states:
Weak Clinton to Weak Trump
Strong Trump numbers from Ipsos and CVoter balance out the strong Clinton numbers from Google and leave us with an essentially tied Kansas and erase the short blue period for the state I noted last time. (The Ipsos and CVoter results came out later, but covered an earlier time period, so they moved the lines in the past, not just the current number.) As I stated last time I am incredulous about the Google numbers, and wish there was more additional polling in Kansas to clear up what is really going on there. Weak Trump to Strong Clinton
New polls in New Mexico erased the short foray into red territory for New Mexico. As with Kansas, since some of the “new” polls covered older date ranges, the shape of the curve in the past changed as well as the current number. Strong Trump to Weak Trump
Weak Clinton to Strong Clinton
Other states that influenced the Tipping Point
Note on placing polls on the timelineI somehow forgot to mention this in my recent interview about this site, but it seems relevant to the discussion above… Many other election tracking sites place polls based on the END of the poll’s time in the field. I place polls on the timeline based on the mid-date of their time in the field. I think this does a better job at trying to identify when directional changes happen, because if an event and a mid-date are aligned, you know that the poll was half before and half after the event. When you place polls by the end of their field time, you can’t make any sort of statements like that about how the poll results match up with the event without referring to the specific start and end dates. For more information…This post is an update based on the data on ElectionGraphs.com. Election Graphs tracks both a poll based estimate of the Electoral College and a numbers based look at the Delegate Races. All of the charts and graphs seen in this post are from that site. Additional graphs, charts and raw data can be found there. Follow @ElectionGraphs on Twitter or like Election Graphs on Facebook to see announcements of updates or to join the conversation. For those interested in individual general election poll updates, follow @ElecCollPolls on Twitter for all the polls as they are added. If you find the information in these posts interesting or useful, please consider visiting the tip jar. Edit 2016-10-01 00:34 UTC to correct the one state that moved after the debates. I had said it was North Carolina moving back from Weak Clinton to Weak Trump, it was actually Florida. |
||