This is the website of Abulsme Noibatno Itramne (also known as Sam Minter).
Posts here are rare these days. For current stuff, follow me on Mastodon
|
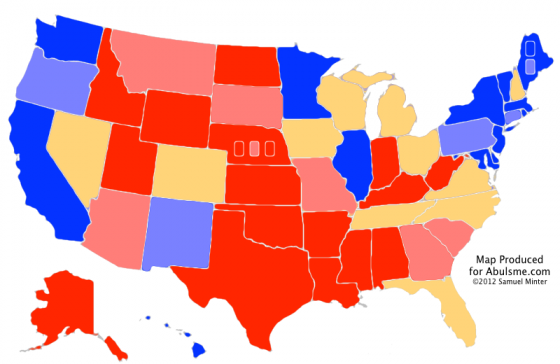
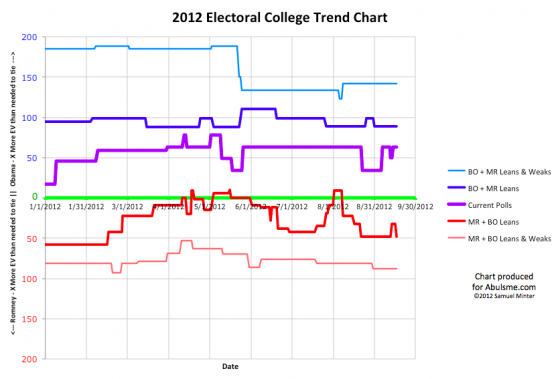
So that didn’t last long. Three days ago Michigan topped a 5% Obama lead in my five poll average… just barely, at 5.1%. Now with a new poll, that drops back down to 4.4%. So, once again, I consider Michigan in the “could go either way” category.
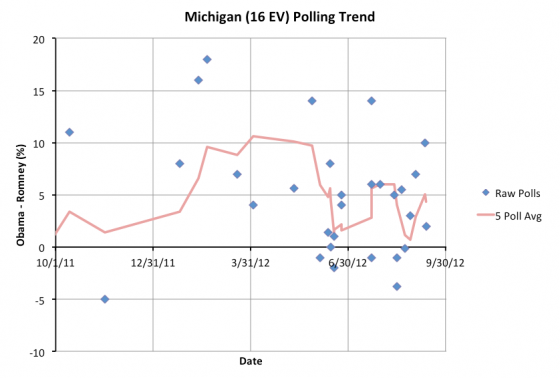
We’re still right around my arbitrary 5% line, so the next poll could easily move this back above 5%. Or of course it could move things further in Romney’s direction. For the moment though, back to being close enough that we consider it within the realm of possibility that Romney takes the state in November.
Having said that, although a few individual polls have shown Romney ahead, at no time in the last year has Romney been ahead in Michigan in the five poll average. This is not one of the “closest of the close” states where the lead has gone back and forth all year. This is a state that is relatively close, but Obama has been ahead all along.
With Michigan now once again included in Romney’s best case, the new summary is:
|
Romney |
Obama |
| Romney Best Case |
301 |
237 |
| Current Status |
206 |
332 |
| Obama Best Case |
180 |
358 |
So pretty much where we’ve been for awhile: Obama with a substantial lead. Romney still able to win if he sweeps almost all of the close states, most of which he is currently behind in.
To win Romney needs something big that changes the dynamics of the race. More of the same from both sides just ends up with a fairly comfortable Obama win.
Note: Chart and map from the Abulsme.com 2012 Electoral College Prediction page. Both assume Obama vs Romney with no strong third party candidate and show polling as it currently exists. Things will change before election day. On the map red is Romney, blue is Obama, gold states are too close to call. Lines on the chart represent how many more electoral votes a candidate would have than is needed to tie under several different scenarios. Up is good for Obama, Down is good for Romney.
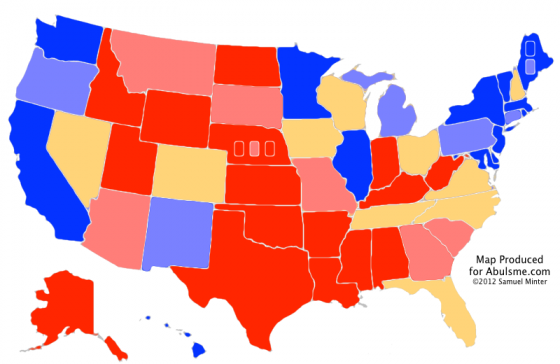
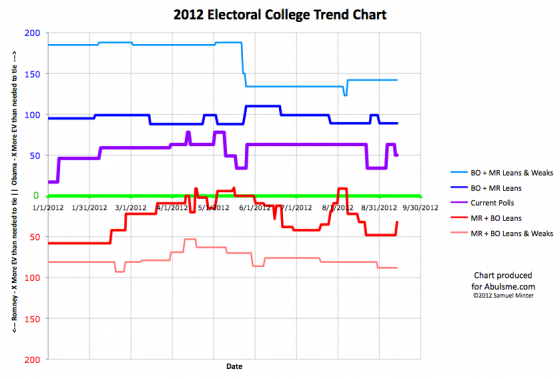
One change today. After flirting for awhile with the idea of being a close state that might actually be in contention this election, Obama’s lead in Michigan is once again starting to open up:
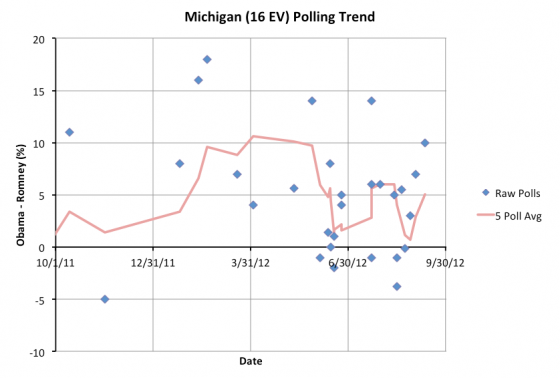
Obama’s lead in the state is now just barely over my 5% threshold, so I move the state from “Leaning Obama” to “Weak Obama” and color it light blue on my map. Basically, Obama is now far enough ahead in Michigan that it looks like a pretty safe bet that he will take the state in November. But his margins aren’t so high that he should be taking the state completely for granted. Given the right opportunity, Romney could still make it close again.
This means that I take the possibility of winning Michigan back out of Romney’s best case. This leaves the new model summary as follows:
|
Romney |
Obama |
| Romney Best Case |
301 |
237 |
| Current Status |
219 |
319 |
| Obama Best Case |
180 |
358 |
At this level, Romney’s best case has him with 32 electoral votes more than he needs to win. Looking at this, he still has no “must win” states mathematically. Theoretically he could lose Florida (27) and still win if he won every other close state. Realistically speaking of course, if he is in a position where he loses Florida, it is highly unlikely that Romney would simultaneously win the rest of the close states. His paths to victory are a lot narrower without Michigan as a possible win.
Although there was the move toward Romney in Virginia in yesterday’s update, so far my prediction from last week that the beginning of September would be Romney’s post-primary high water mark is holding. (I updated my post from yesterday to add a note that my original accidental implication that I had already been proved wrong was incorrect.)
It has only been a week though. And it has not been a great week for Romney. Romney may still have some good weeks left in him before this is all said and done.
Obama has a big advantage at the moment. Romney has a really hard road to go to make this really competitive. Being in a spot where you essentially have to sweep all of the close states (most of which you are behind in at the moment) in order to win is not where you want to be in mid-September. Especially as a challenger. But it is not over yet…
Note: Chart and map from the Abulsme.com 2012 Electoral College Prediction page. Both assume Obama vs Romney with no strong third party candidate and show polling as it currently exists. Things will change before election day. On the map red is Romney, blue is Obama, gold states are too close to call. Lines on the chart represent how many more electoral votes a candidate would have than is needed to tie under several different scenarios. Up is good for Obama, Down is good for Romney.
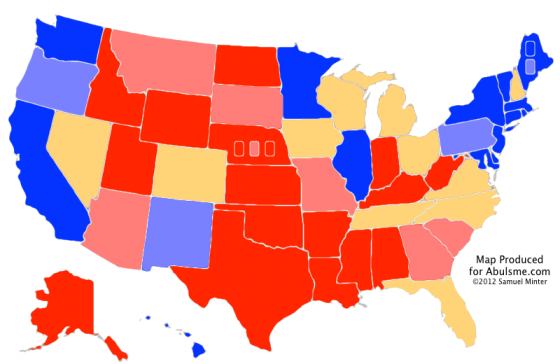
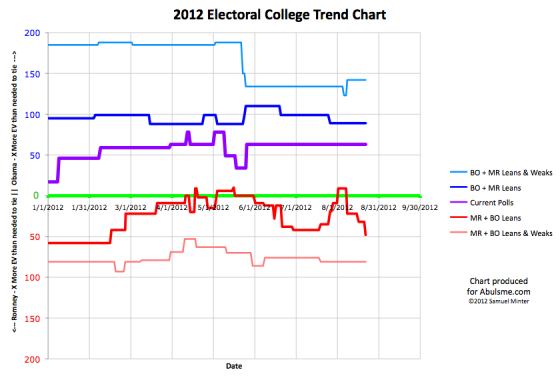
So, just as July was very bad for Romney, August has so far been very good for Romney. Today’s move is the state of Michigan, with 16 electoral votes:
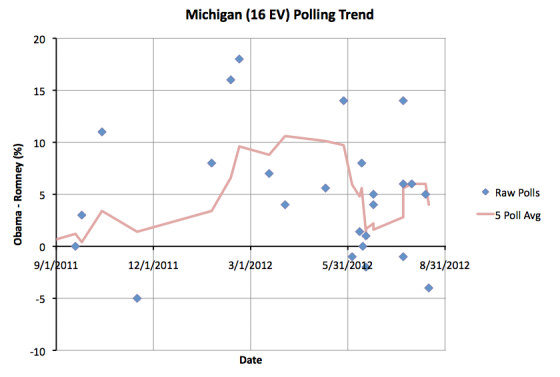
Over the course of the last year, Michigan has polled all over the place, ranging from Polls showing Romney ahead by 5%, to polls showing Obama ahead by 18%. A huge range. More recently the five poll average had an Obama lead of 6%. Today’s update pulls that down to 4%. Since that is below my 5% threshold, Michigan once again goes into the “could go either way” category. 4% is just a very slim lead that can disappear pretty easily with the back and forth of the news cycle. This of course improves Romney’s “Best Case” in my model:
|
Romney |
Obama |
| Romney Best Case |
317 |
221 |
| Current Status |
206 |
332 |
| Obama Best Case |
180 |
358 |
With this update, Romney’s “best case” (where he wins ALL the close states) is better than it has been since February. Over the past few weeks, he has diminished Obama’s lead in several critical states. The “current” line in my model, where each candidate wins all the states they are even slightly ahead in, has stubbornly stayed still at Obama 332 Romney 206 for almost three months now. But getting states close has to happen before states jump over the line.
There are now 9 states where Obama is ahead, but by less than a 5% margin… which can be considered very vulnerable. Of those Obama’s leads in Florida (29 ev), Ohio (18 ev), Virginia (13 ev), Colorado (9 ev) and Iowa (6 ev) are all actually less than *2%*. Those five states could really flip at almost the drop of a hat. They are right on the edge. That is 75 electoral votes right on the verge of going over to Romney’s side of the fence with a few positive news cycles for Romney. And guess what. Move those 75 votes to the other side and Romney wins 281 to 257.
Obama is still significantly ahead in the electoral college analysis at the moment. And Romney has never been ahead in this analysis. But the above serves to show just how quickly things can change. Over the last few weeks things have moved quite nicely in Romney’s direction and there are a lot of states that could easily move further.
This isn’t even close to over yet. The amount of time left is getting shorter all the time, but if Romney keeps things moving in this direction, this could get very interesting!
Note: Chart and map from the Abulsme.com 2012 Electoral College Prediction page. Both assume Obama vs Romney with no strong third party candidate and show polling as it currently exists. Things will change before election day. On the map red is Romney, blue is Obama, gold states are too close to call. Lines on the chart represent how many more electoral votes a candidate would have than is needed to tie under several different scenarios. Up is good for Obama, Down is good for Romney.
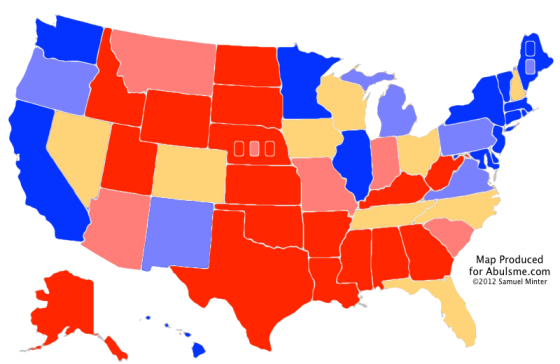
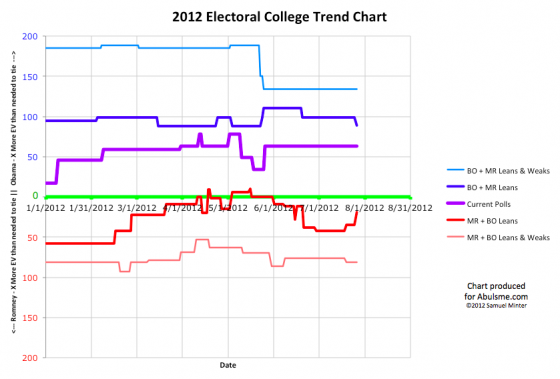
Chart and map from the Abulsme.com 2012 Electoral College Prediction page. Both assume Obama vs Romney with no strong third party candidate. Both show polling as it currently exists. Things will change before election day. On the map red is Romney, blue is Obama, gold states are too close to call. Lines on the chart represent how many more electoral votes a candidate would have than is needed to tie under several different scenarios. Up is good for Obama, Down is good for Romney.
Two states change status today, both moving out of swing status, one toward Obama, one toward Romney. In order by electoral weight:
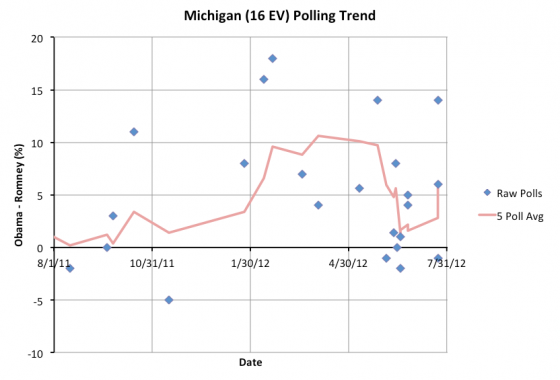
First up, Michigan, with 16 electoral votes. Obama’s lead in Michigan had dropped from over 10% in the 5 poll average back in April, down to just barely over 1% in June. It has now rebounded to 5.6%, which I consider a large enough lead to take it out of reach for Romney, moving it into the “Weak Obama” category. Now, the last three polls, all released in the last couple days, are all over the place… +14 Obama, +1 Romney, +6 Obama. (The two older polls in my average at the moment are +5 Obama and +4 Obama). So there may be a lot of uncertainty here until we get more polls to validate where we really are. But we average out the admittedly huge polling differences, and end up with a decent Obama lead.
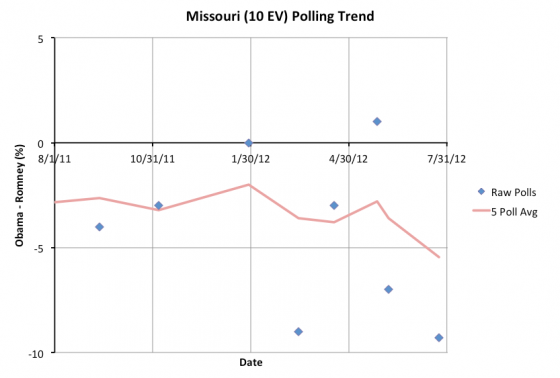
Next up is Missouri with 10 electoral votes. Missouri has been pretty sparsely polled this year, despite most of those polls showing a pretty close race (with Romney slightly ahead). You’d think it would be polled more often since even though there was a consistent Romney lead, it was a small lead, and thus the state might have been vulnerable. At this point though three of the past 5 polls show a Romney lead more than 5%, and the 5 poll average is +5.5% Romney, so Missouri moves out of my swing state category into “Weak Romney”.
The result of all this?
|
Romney |
Obama |
| Romney Best Case |
288 |
250 |
| Current Status |
206 |
332 |
| Obama Best Case |
180 |
358 |
Both Romney’s Best Case and Obama’s best case get a little worse. Since Romney’s best case is weaker, this is more critical to him. His best case now has him with only 19 more electoral votes than needed to tie. This makes Florida once again a must win state. With this configuration of close states, unless he captures some states where Obama is ahead by more than 5% right now, Romney can’t win without Florida. He can still afford to lose Ohio, but only if he then wins EVERY other close state.
With this update Romney’s paths to victory once again narrow. In order to get to a more comfortable place, he needs to be pulling more of Obama’s weak states back into contention. Pennsylvania (20), Michigan (16) and Virginia (13), I’m looking at you.
And then of course he has to actually start pulling states over the line to his side. The “current status” where everybody gets all the states they are even slightly ahead in, hasn’t changed at all since May… We’re at Obama 332 Romney 206… which is only slightly different from where we were in FEBRUARY (Obama 328 Romney 210). There has been movement around the edges, and some short term fluctuations in April and May, but for the most part, not much has moved at all… if Romney wants to win, he needs to start getting some more traction in some of the critical states pretty soon.
The line is always “a lot can change before November”. There is no question that is very true. But there is a lot less time left to make that change happen than there was. Tick tock.
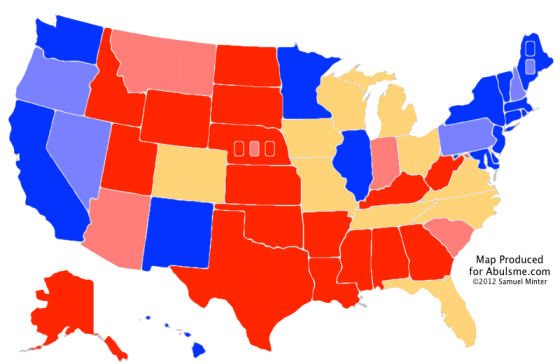
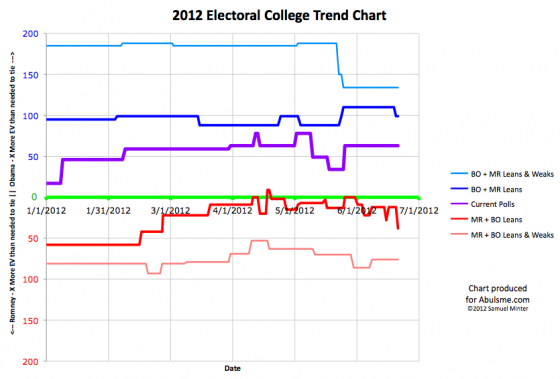
Chart and map from the Abulsme.com 2012 Electoral College Prediction page. Both assume Obama vs Romney with no strong third party candidate. Both show polling as it currently exists. Things will change before election day. On the map red is Romney, blue is Obama, gold states are too close to call. Lines on the chart represent how many more electoral votes a candidate would have than is needed to tie under several different scenarios. Up is good for Obama, Down is good for Romney.
Two states moving today, both toward Romney:
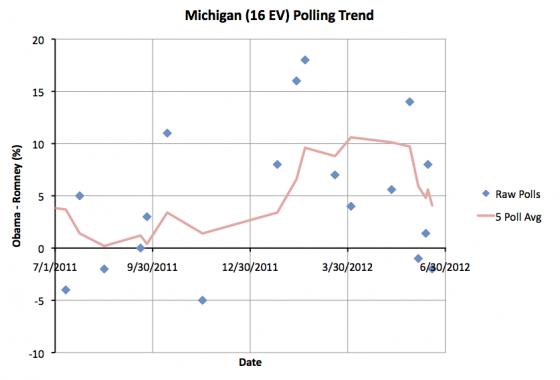
First up, Michigan, with 16 electoral votes. In the last week Obama’s lead in the five poll average in Michigan dropped below 5%, then popped back above 5%, and now it once again drops below 5%. At the moment it sits at a 4.1% lead. The trend toward Romney over the last few polls seems clear though, and this puts Michigan once again into my swing state category.
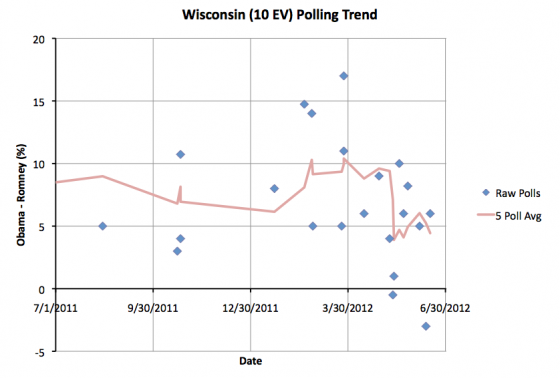
Now Wisconsin, with 10 electoral votes. Wisconsin is looking pretty similar to Michigan. It is also a state where Obama’s lead was briefly over 10% in the spring, but where Obama’s lead has been deteriorating since then. The five poll average had dipped below 5% in mid-May, popped back above 5% on June 8th… and now is falling back below that level again with the latest poll. Obama’s lead in Wisconsin now sits at 4.4%. So Wisconsin becomes a swing state again too.
With both of these states now “too close to call” as far as my model is concerned, Romney’s “best case” improves significantly:
|
Romney |
Obama |
| Romney Best Case |
307 |
231 |
| Current Status |
206 |
332 |
| Obama Best Case |
170 |
368 |
Just yesterday, I was talking about how the current state of the race was about the same as it was two months ago and if Romney wanted to change this, he should get started. So is this the start of that?
Well, maybe. But last time I said it looked like Romney was breaking out, the very next day a new poll moved things back in the other direction. So I’m going to refrain from drawing any conclusions like that yet, even though Romney’s best case is better than it has been since February, he has many more paths to victory than he did in April and May, and not even Florida is a “must win” state any more.
No question that this does look very good for Romney. If the next few polls keep Michigan and Wisconsin close, and if more polls in the “Lean” and “Weak” categories show movement toward Romney, then we’ll know that this isn’t just fluctuations in the polls, but is real motion in Romney’s direction. I just don’t want to jump the gun again.
Obama still has a significant advantage and would be a heavy favorite to win if the election was held today. But stay tuned! If there is broad based movement toward Romney, and a few more critical states move in his direction, things will start looking a lot more competitive and a lot more interesting in a hurry!
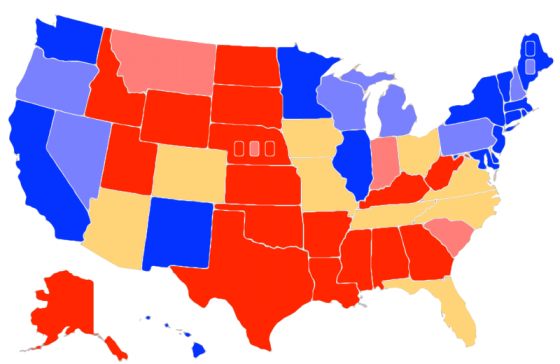
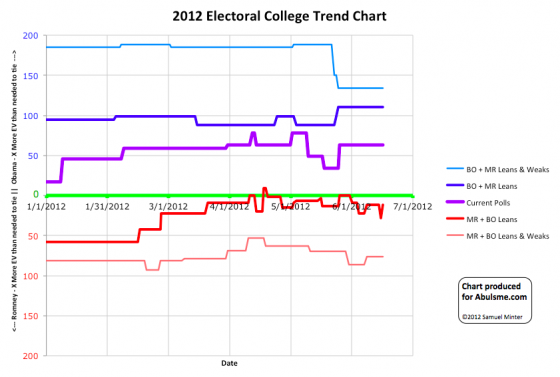
Chart and map from the Abulsme.com 2012 Electoral College Prediction page. Both assume Obama vs Romney with no strong third party candidate. Both show polling as it currently exists. Things will change before election day. On the map red is Romney, blue is Obama, gold states are too close to call. Lines on the chart represent how many more electoral votes a candidate would have than is needed to tie under several different scenarios. Up is good for Obama, Down is good for Romney.
So, um, the change from yesterday, I guess, well, never mind:
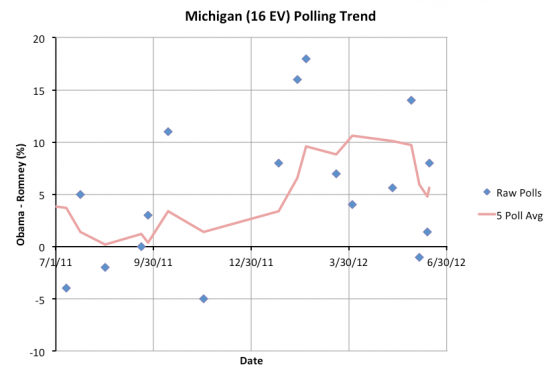
So, yesterday a new poll pulled Obama’s lead in the five poll average in Michigan under 5%. Today another new poll pulls that lead back up over 5% again. Easy come, easy go I guess. This takes Michigan once again out of the set of states we consider going both ways in our models.
|
Romney |
Obama |
| Romney Best Case |
281 |
257 |
| Current Status |
206 |
332 |
| Obama Best Case |
159 |
379 |
So, we can, for the moment anyway, just take everything I said yesterday about momentum in Romney’s direction, and say “OK, maybe not so much after all”. Romney’s best case is now back in the range it has been ever since the end of February, with relatively narrow paths to victory. Maybe we’ll see a more permanent move in that direction soon… but not yet.
Meanwhile, one final correction due to the data from a spreadsheet provided by Darryl at HorsesAss. With more precise information from a poll back in February, one of Wisconsin’s transitions, from Weak Obama to Strong Obama, moves from March 30th to March 31st. The rest of Wisconsin’s history stays the same (it has moved around several times), as does the current situation as a “Weak Obama” state where Obama leads by between 5% and 10%. This only affects the older part of the historical chart. That chart is adjusted starting with today’s update.
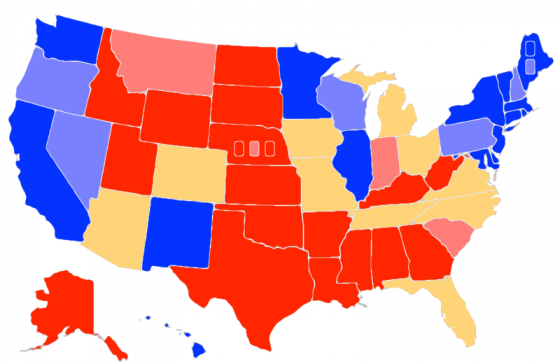
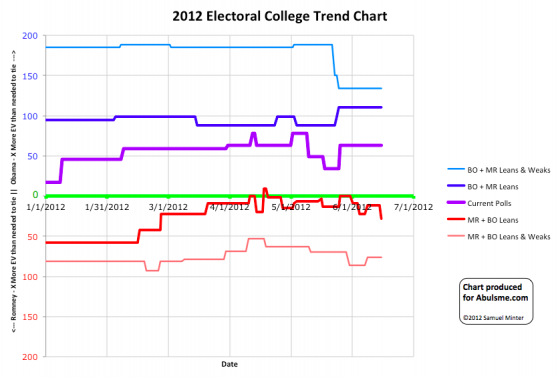
Chart and map from the Abulsme.com 2012 Electoral College Prediction page. Both assume Obama vs Romney with no strong third party candidate. Both show polling as it currently exists. Things will change before election day. On the map red is Romney, blue is Obama, gold states are too close to call. Lines on the chart represent how many more electoral votes a candidate would have than is needed to tie under several different scenarios. Up is good for Obama, Down is good for Romney.
One state changing status today, and it is a big one heading in Romney’s direction…
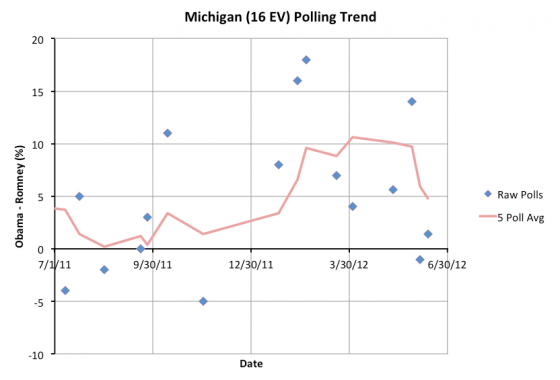
So Michigan, where as recently as the end of May, Obama’s lead in the five poll average had been more than 10%, is now too close to call as Obama’s lead falls below 5%. The state is still leaning Obama, but with the five poll average at an Obama lead of only 4.8%, that lead could disappear overnight with the right combination of events.
This change in Michigan has been very dramatic. In fact, the rapidity with which Obama’s lead in Michigan collapsed should be a reminder than things can and do sometimes change quickly. It is tempting to say in retrospect that the two polls in February showing Obama with 15%+ leads in February may have been outliers… without them the drop would look less dramatic, but still… with sparse polling it is hard to distinguish outlier polls from actual movements in opinion. And there were two of them, not just one. These could have been outliers, but in February Romney was getting beaten up in Michigan by Santorum, so a decline in his support at that time also seems reasonable.
In either case, the most recent five polls show a close race, slightly in Obama’s favor, so Michigan is once again a swing state in our model. This improves Romney’s “best case” where we have him winning all of the states that are currently “close”:
|
Romney |
Obama |
| Romney Best Case |
297 |
241 |
| Current Status |
206 |
332 |
| Obama Best Case |
159 |
379 |
At this point Romney’s best case gives him 28 more electoral votes than is needed to tie. This makes Florida the only “must win” state. Romney can now afford to lose any one of the other close states, or multiple of the smaller close states. He has many more paths to victory than he had a few weeks ago.
Romney’s “Best Case” line is now better than it has been since February. It finally looks like Romney may have put most of the damage caused by the primary season behind him, and is now pulling things his direction… moving this in the direction of actually becoming a competitive race. Romney’s best case still isn’t back where it was in January, but it it certainly looks a lot better for him than it did in April and May, at least in terms of his best case.
Now, the “everybody wins every state they are even slightly ahead in” line still shows a pretty clear Obama victory. But in order to bring states onto your side of that line, you first have to bring down Obama’s lead in those states… and that is exactly what has been happening. Romney is pulling states that looked pretty safe for Obama and starting to make them competitive. If the trend continues, he will start to pull into the lead in some of those… and maybe take some that look competitive now and make them start looking like safe Romney states.
It has also been a bad couple weeks for Obama in the news cycle of course. It is also possible recent events will blow over and Obama will pull some of these states back in his direction. Stay tuned.
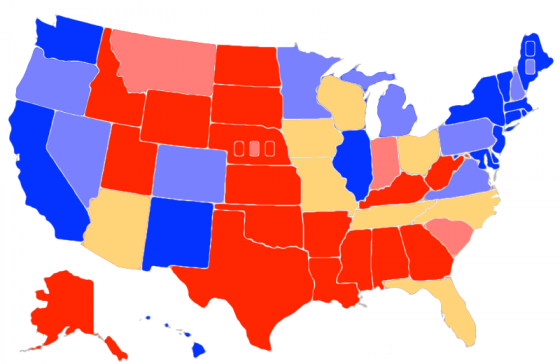
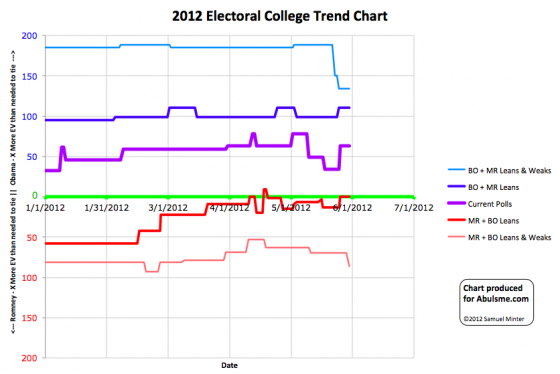
Chart and map from the Abulsme.com 2012 Electoral College Prediction page. Both assume Obama vs Romney with no strong third party candidate. Both show polling as it currently exists. Things will change before election day. On the map red is Romney, blue is Obama, gold states are too close to call. Lines on the chart represent how many more electoral votes a candidate would have than is needed to tie under several different scenarios. Up is good for Obama, Down is good for Romney.
One state changes status today, and it is a move toward Romney:
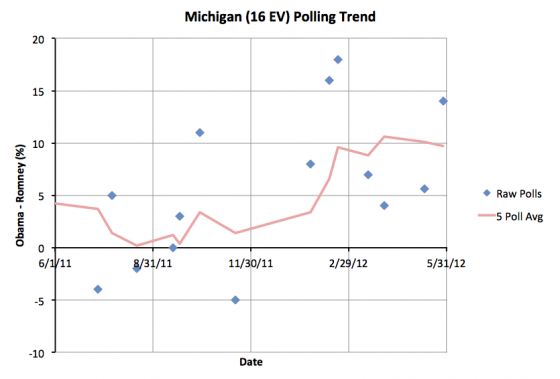
Michigan was in my “Strong Obama” category starting on April 10th. Today the five poll average drops to only a 9.7% lead for Obama, so the state drops to “Weak Obama”. As I’ve described this category many times before, this means that while Obama has a healthy lead, it is not so strong a lead that he can ignore the state. He has to play defense here, otherwise strong efforts from Romney (or big mistakes on his part) could make the state competitive again. As recently as February the five poll averages were such that Michigan was categorized as a swing state. It could go there again.
Since this does not change the inventory of swing states, the summary remains the same:
|
Romney |
Obama |
| Romney Best Case |
269 |
269 |
| Current Status |
206 |
332 |
| Obama Best Case |
159 |
379 |
In addition to the change in Michigan today, I have a correction to the historical timeline for New Hampshire. Based on data provided by Darryl from HorsesAss I found a typo in one New Hampshire poll from March, and a few older polls from 2011 that I had missed when booting up these charts in January. The end result is that New Hampshire’s timeline changes slightly.
Prior to today I had this timeline:
- Jan 1 – Apr 19: Lean Romney (Swing State)
- Apr 19 – May 16: Lean Obama (Swing State)
- May 16 – Now: Weak Obama
With the corrections, the timeline should have been:
- Jan 1 – Feb 4: Weak Romney
- Feb 4 – Mar 31: Lean Romney (Swing State)
- Mar 31 – May 16: Lean Obama (Swing State)
- May 16 – Now: Weak Obama
These changes only effect the historical timeline, the current position remains the same. The chart showing the race over time has been updated with this correction starting with today’s update.
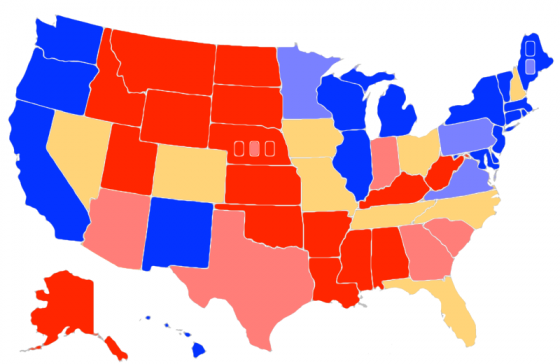
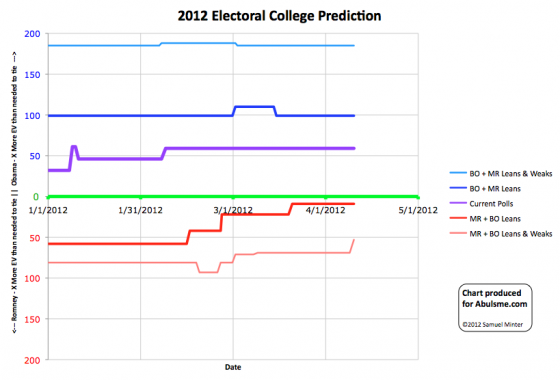
Map and chart from the Abulsme.com 2012 Electoral College Prediction page. Both assume Obama vs Romney with no third party strong enough to win states. On the Map Red is Romney, Blue is Obama, Gold States are too close to call. Lines on the chart represent how many more electoral votes a candidate has than is needed to tie under several different scenarios. Up is good for Obama, Down is good for Romney.
At some point things have to stop getting worse for Romney, right? As he pivots from the primaries to the general election, he’ll start pulling back support from the middle and start gaining ground again, right? Well, probably. But not yet. In today’s update the 5 poll average for Michigan moves to Obama having more than a 10% lead in that state. So we color the state dark blue. Essentially this means it is a state Romney probably shouldn’t bother putting any resources into at all. The situation may change later, but for the moment, it is out of reach.
Since Michigan isn’t moving in or out of Swing State status, the overall summary remains the same with Obama clearly the favorite by a large margin, but Romney still being able to squeak by with a win if he manages to sweep all of the too close to call swing states:
|
Romney |
Obama |
| Romney Best Case |
278 |
260 |
| Current Status |
210 |
328 |
| Obama Best Case |
170 |
368 |
One thing to keep in mind at this stage is that state polling is still sparse. So the “five poll averages” I use for this analysis can cover a lot of time. For instance, in Michigan my five poll average currently has polls that were done all the way back through January. (Specifically it includes one from January, two from February, one from March and one from April.)
There are still just a handful of state polls per week. Some states actually haven’t even been polled at all and I’m extrapolating based on the 2004 and 2008 elections. I’m also doing a straight average, not a recency weighted average. Because of this, this analysis will react more slowly to changes in the political situation.
At least that is the situation here in April. As we get closer and closer to November, we’ll have a faster and faster pace of polls. By the time we get to October we will have many new state polls every week, and changes in this analysis will be much more frequent and catch changes faster.
Edit 2012 May 30 15:49 UTC: It turns out that between the last update on Mar 30 and this one New Hampshire should have moved from Weak Romney to Lean Romney on Mar 31. At that time however, I was missing some polls and thought New Hampshire was already Lean Romney, so no update was posted. This is corrected in the historical charts starting on May 30.
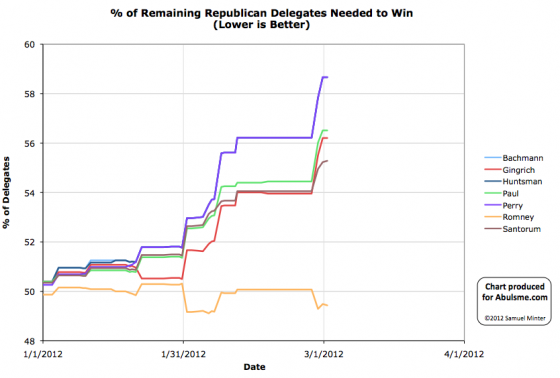
Chart from the Abulsme.com 2012 Republican Delegate Count Graphs page. When a candidate gets down to 0%, they have cinched the nomination. If they get up past 100%, they have been mathematically eliminated. Note that these numbers include estimates of the eventual results of multi-stage caucus processes which will be refined as the later stages occur.
So, everybody expected that 2 of Michigan’s delegates would be allocated proportionately, which meant that unless it was a complete blowout, you’d get one delegate each for the top two candidates statewide. But the Michigan GOP gave both delegates to Romney when they released the official results. They say that the proportional thing was a misunderstanding due to an error in an earlier memo and it was always going to be that way. The Santorum camp is calling shenanigans. More on this here and here. In any case, the result for the day is that Romney gains a delegate and Santorum loses one. It is just one delegate though, so the overall picture remains essentially the same.
|
|


