First of all, I promised to report back after the electoral college vote, just to give the real final results, but I didn’t. There were no “faithless electors” this time around, as fun as that always is, so the end result was as expected from election night. Obama 332, Romney 206.
Now on to the analysis of the accuracy (or lack there of) of my five poll averages:
While my analysis predicted 56 of 56 jurisdictions correctly (50 states, DC, ME & NE congressional districts), this is not the whole story. It is worthwhile to also look at the comparison between the final five point averages and the actual popular vote margins in each of these jurisdictions. Here is what you find:
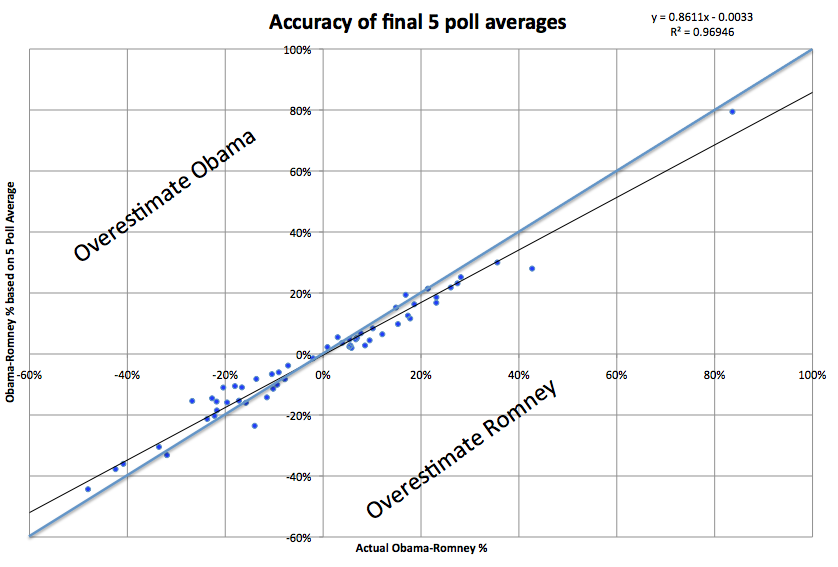
There is no clear overall bias toward either Obama or Romney. The overall count gives 25 jurisdictions where my 5 poll average overestimated Obama’s support, and 31 jurisdictions where my 5 poll average overestimated Romney’s support. If anything, on an overall basis then, there is a slight bias in favor of Romney. But that isn’t the real bias here.
Lets look at this again partitioning based on who won.
- Romney won 27 jurisdictions. Of those, 7 overestimated Romney’s support, while 20 overestimated Obama’s support.
- Obama won 29 jurisdictions. Of those, 5 overestimated Obama’s support, while 24 overestimated Romney’s support.
So the overwhelming pattern here is that although there are clearly exceptions, in general, the polls overrepresented the support level of the person who lost the state.
In other words, the polls are not biased toward either candidate. The polls are biased toward showing a CLOSER RACE than the actual results.
The trend can been seen even more clearly if you subtract out the actual results, leaving only the deviation or bias:
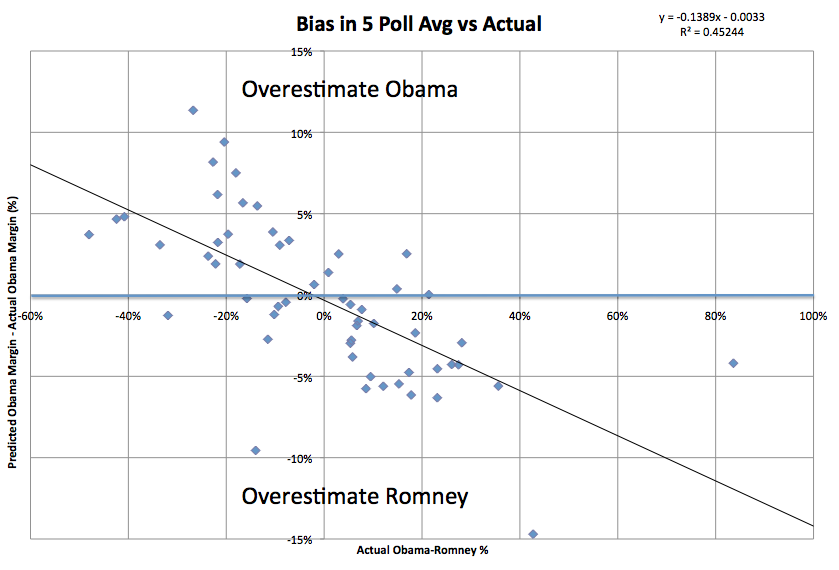
If the polls were very generally right, you would expect a horizontal line very close to zero.
If there was a direct bias for one candidate or another you would expect a horizontal line, above zero for an Obama bias, below zero for a Romney bias.
We see positive to the left and negative to the right though, meaning the bias is generally toward the underdog, whoever that is. (In other words, again, a bias toward a closer race.)
More than that though, the less close the race is, the greater that bias is. It isn’t just that races that are less close are polled less often and so are generally further from the right answer, but rather the bias toward making it closer increases too.
In Hawaii, where it was clear Obama was going to win by very high margins, the polls overestimated Romney by 14.7%! (Polls said Obama would win by 28%, Obama actually won by 43%.)
Similarly, in West Virginia, where it was clear Romney was going to win by very high margins, the polls overestimated Obama by 11.4%! (Polls said Romney would win by 15%, Romney actually won by 27%.)
Those were the two worst states in terms of accuracy of the five poll average. Rounding out the worst five are Alaska (R+9.6%, a big exception to the trend… where there were no polls at all and the 5 poll average was based on the 2004 and 2008 elections), Tennessee (O+9.4%), Kentucky (O+8.2%).
The best five were: Maine-1 (O+0.03%), Texas (R+0.2%), Virginia (R+0.2%), Washington (O+0.4%), Georgia (R+0.4%).
Now, in the end, the degree to which each candidate wins (especially in the states they are way ahead in) doesn’t really matter. We have a winner take all system, so this bias actually makes a lot of sense in terms of how pollsters work. Having the margin wrong doesn’t matter much in these kinds of races, only the winner matters (and the poll averages were all correct on that front). Also of course, close races are more interesting, and people are more likely to commission polls if it looks closer… so the biases all make sense.
But lets take a closer look at the states that were even remotely in contention, where the margins were under 15%. That actually includes a lot of places I wouldn’t really consider “close” but it gives a good number to look at:
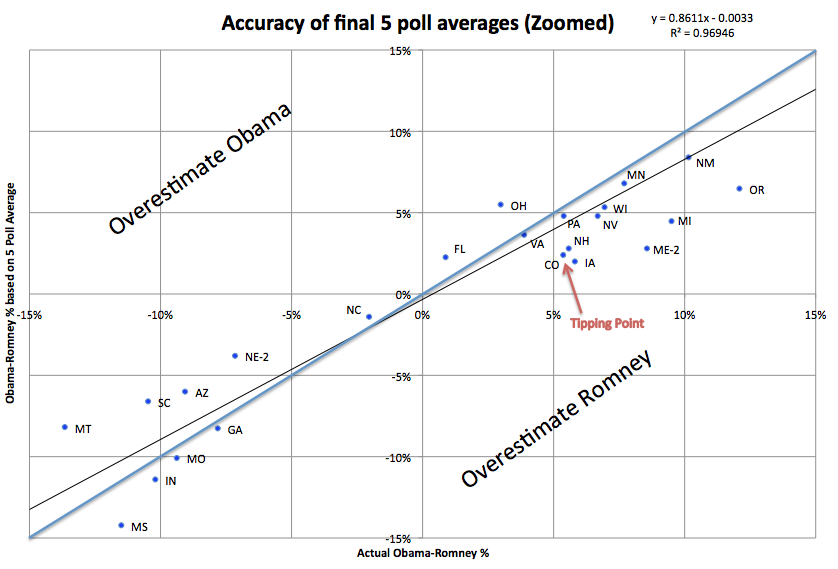
Now, I had categorized using “Strong Romney”, “Weak Romney”, “Lean Romney”, “Lean Obama”, “Weak Obama”, “Strong Obama”. Lets look at how things stacked up in terms those categorizations… specifically the “lean” states.
You can see from the chart above, that even among the states near the “tipping point” where you would think polling would be most robust, the error is significant. The tipping point is of course on Obama’s side, since he won. But what we see is that of states that the last five poll average identified as “Lean Obama”… that is, Obama ahead, but with a margin under 5%… so close enough you could conceivably think Romney might take it… only TWO actually ended up with margins under 5%. That would be Florida and Virginia.
On the other hand, the five poll average identified each of these states (and one congressional district) as “close”, but in fact it was pretty much an Obama blow out:
| 5 Poll O-R | Actual O-R | Bias | |
|---|---|---|---|
| Colorado | 2.4% | 5.5% | R+3.0% |
| Pennsylvania | 4.8% | 5.4% | R+0.6% |
| New Hampshire | 2.8% | 5.6% | R+2.8% |
| Iowa | 2.0% | 5.8% | R+3.8% |
| Nevada | 4.8% | 6.7% | R+1.9% |
| Maine-2 | 2.8% | 8.6% | R+5.8% |
| Michigan | 4.5% | 9.5% | R+5.0% |
There was only one state with the opposite pattern… that is, the five poll average indicated Obama with a healthy safe lead of more than 5%, and the actual results were a win by less than 5%. That would be Ohio. The 5 Poll average had Obama ahead by 5.5%. In actuality he won by only 3.0%
On the Romney side, there were less close places to look at. There were no cases where the five poll average classified something with Romney having a greater than 5% where it ended up being closer than that. There was ONE case where the five poll average showed a close race where it really wasn’t. That would be Nebraska-2, where the five poll average showed only a 3.8% lead. In fact, Romney won Nebraska-2 by 7.2%.
The lesson in all this for 2016? Probably just that “Lead under 5%” isn’t enough to actually think that a state has a real possibility of going either way, that it is really up for grabs. Especially if the form of bias evident here (bias toward the races looking closer than they really are) repeats next time around, which I think is a reasonable assumption.
Some tighter criteria is needed. Maybe just a narrower percentage lead, but maybe also something else. Perhaps an actual history of the lead bouncing back and forth, or the actual current set of polls including results going both way.
Of the five closest states based on actual results (Florida, North Carolina, Ohio, Virginia, Colorado) only Florida had even one of the last five polls indicating the opposite winner (although North Carolina and Colorado had last minute polls showing a tie). Of course five results showing a lead of 0.1% should probably be considered differently than 5 results showing a lead of 4.9%.
The more mathematically proper thing would probably be to take into account the margins of errors on each poll, and come up with an actual probability of the result being on the opposite side than the simple five poll average. There is a place for more complicated models (and I love them!) but part of the point of my analysis is that you can come up with results that are essentially just as good through very simple models with no fancy stuff, just simple averages.
If we went by a rule saying we would only consider a state to be a true toss up if at least one of the last five polls showed a different result, then on election eve 2012, the only Toss-Up state would have been Florida.
I have yet to decide what I will do in 2016, but considering Florida to be the only true toss-up seems closer to the truth than the analysis that put the seven entities in the table above (and NE-2) in the toss-up category.
This analysis is also posted on my Election 2012 Wiki where you can see the original analysis as well.
OK… now to start setting up the 2016 analysis… :-)


