This is the website of Abulsme Noibatno Itramne (also known as Sam Minter).
Posts here are rare these days. For current stuff, follow me on Mastodon
|
With just a few days until Iowa, the concentration is naturally on the delegate races, but general election polling continues as well. Until we have actual delegate counts, we’re still following changes for the five best polled candidate combination. With the newest batch of polls, we have two of the Republicans strengthening their position against Clinton in Minnesota.
Clinton vs Rubio
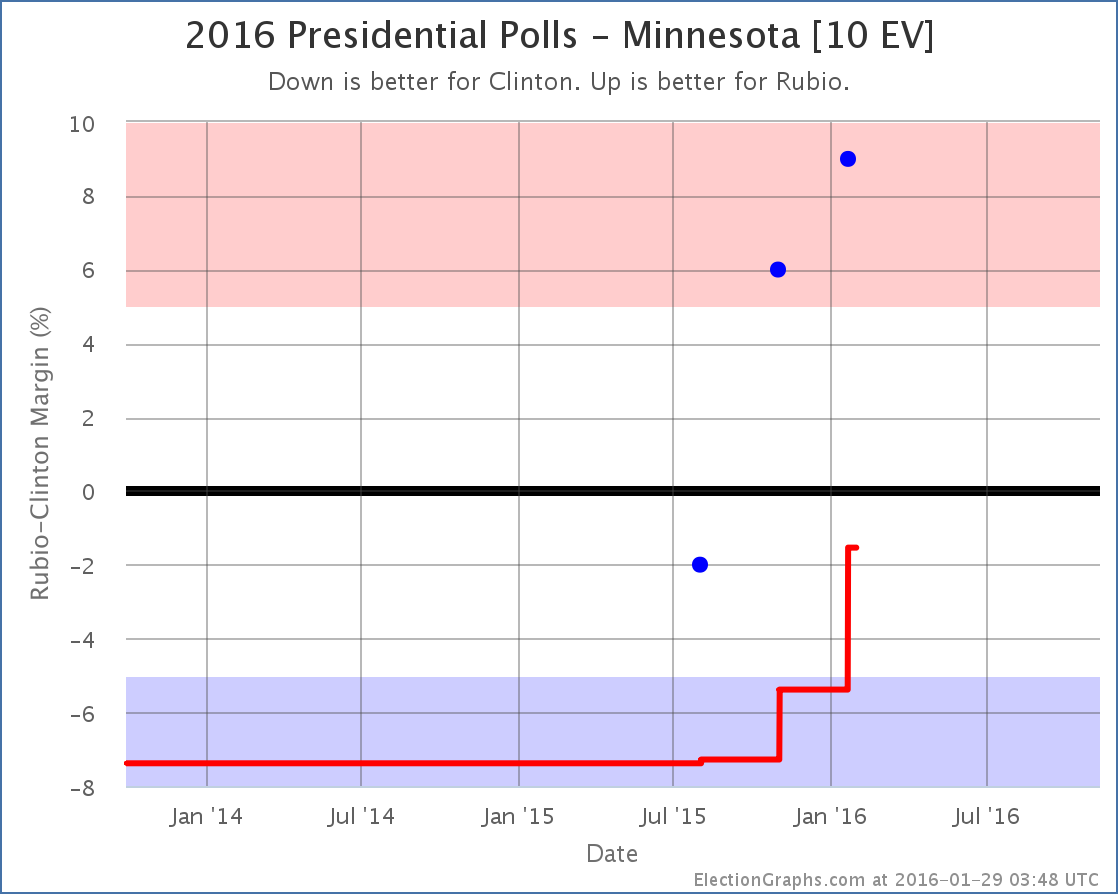
There hasn’t been a lot of polling in Minnesota, but what there is has been tilted further toward the Republicans than the five election average I use as a starting point for my poll averages. With the latest poll, the average moves to a Clinton lead of only 1.5%. This makes Minnesota start looking like a pretty close state. It makes Minnesota a possible pick up for Rubio, and therefore improves his “best case” against Clinton:
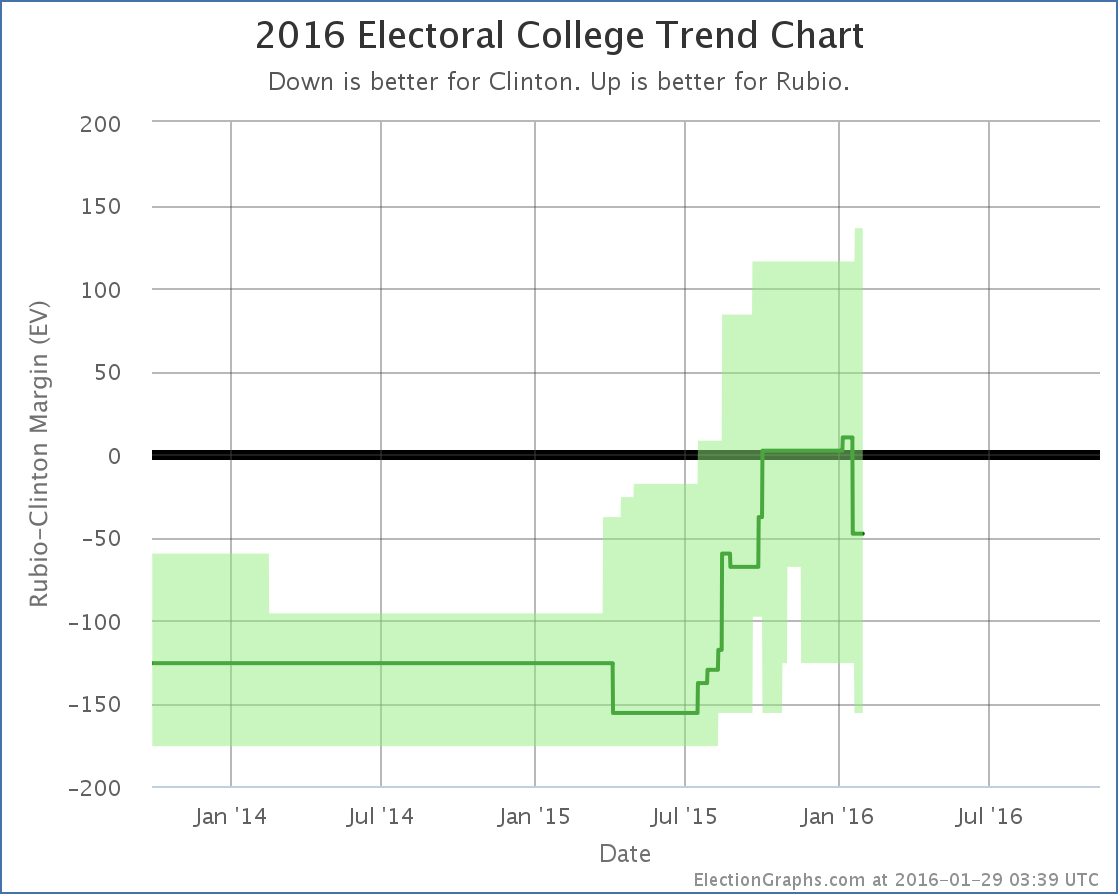
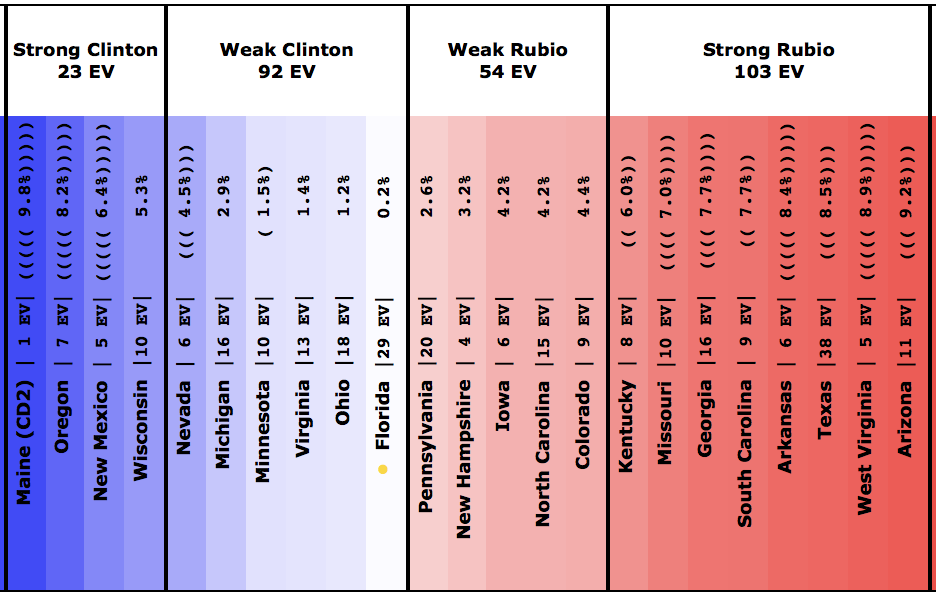
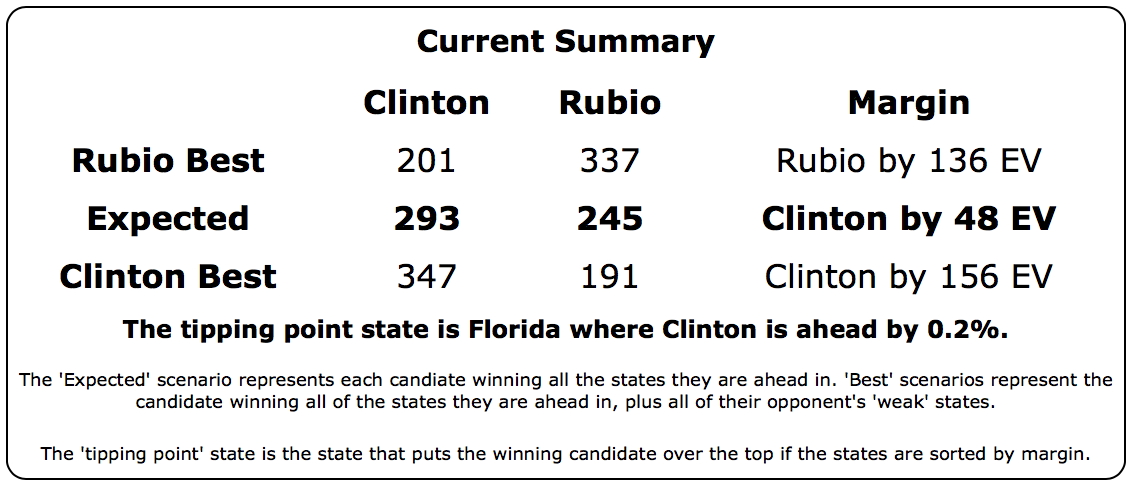
What’s remarkable looking at Clinton vs Rubio at this point is the huge number of close states. There are 146 electoral votes in the “up for grabs” category, where the polling margin is under 5% and it would be very easy to imagine the state going either way. Add to that that the tipping point is only a 0.2% Clinton lead, and Clinton vs Rubio is the most evenly matched of the five best polled candidate combinations by a decent margin. The race is very close, and the “best cases” for the two candidates are relatively close to being symmetric.
If the Republican race was about picking the candidate most likely to beat Clinton, Rubio would be way ahead. But it isn’t, and he isn’t.
Clinton vs Cruz
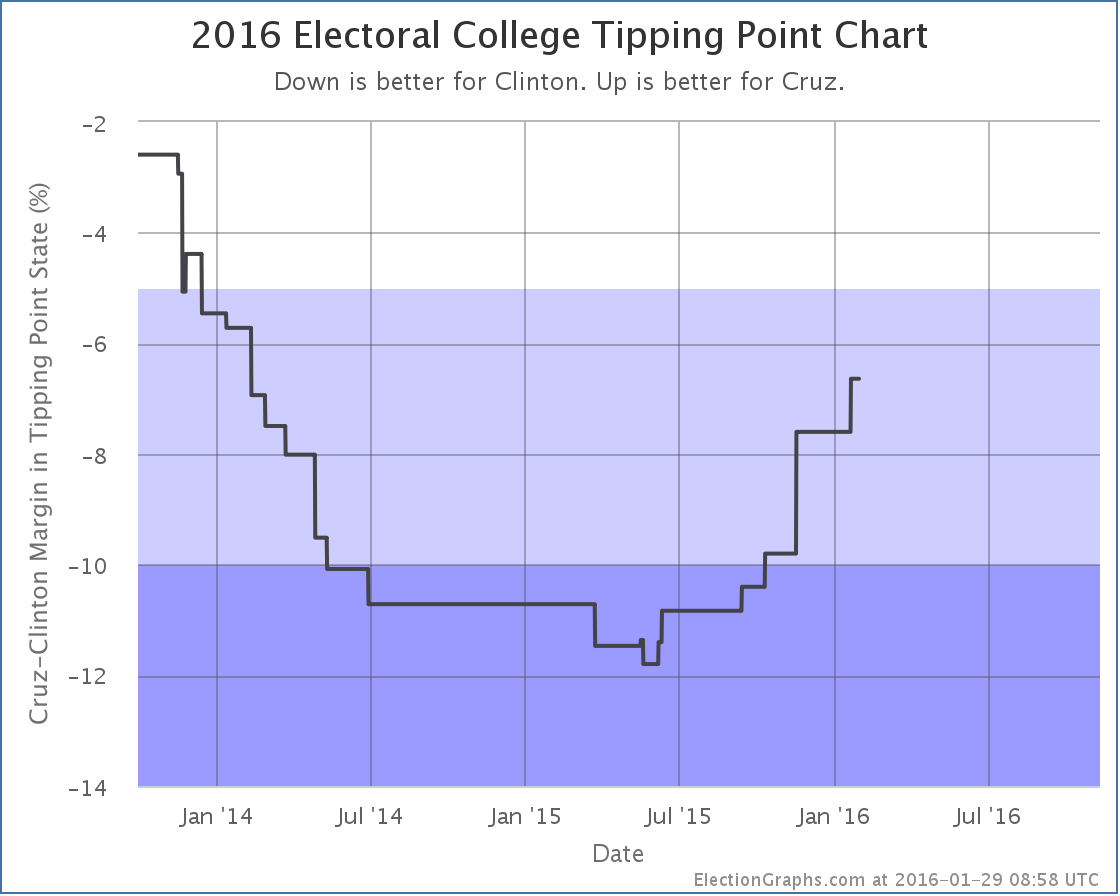
Cruz improved in Minnesota from being behind Clinton by 8.8%, to only being behind by 6.3%. This did not result in a category change, but it did move the tipping point… the state that puts the winning candidate over the edge if you put the states in order. We go from the tipping point being Virginia with a 7.6% Clinton lead, to being Florida with a 6.6% Clinton lead. This still means Cruz is very far behind. He is clearly losing to Clinton. It isn’t particularly close. But it is closer than it was. Cruz has been consistently improving on this metric since June. If Cruz stays in contention in the primaries, watch this number to see if this trend continues and Cruz starts making it an actually competitive race, or if Clinton vs Cruz continues to look like an easy Clinton win.
Clinton vs Trump
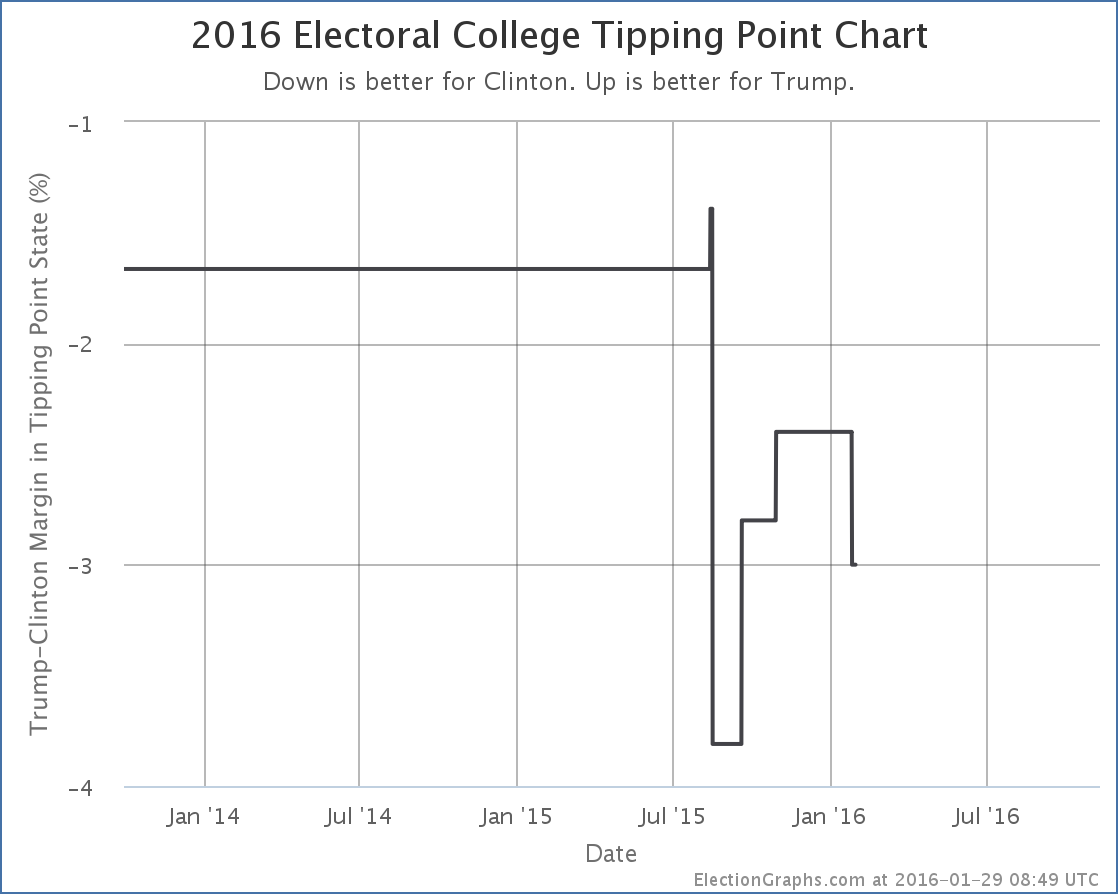
OK, technically Clinton vs Trump is #6 in terms of how well polled the candidate combination is, which means by my rules I wouldn’t be talking about it right now. But given Trump’s position in the polls, I’ll mention it anyway. New Clinton vs Trump polling in Michigan (not in Minnesota like the other two) increases Clinton’s lead from 2.4% to 3.0%. This does not move Michigan to a new category, but it does move the tipping point. In this case the tipping state was and still is Michigan, so the tipping margin just moves from 2.4% to 3.0%. There isn’t enough here to declare a real trend. And both 2.4% and 3.0% are “close”. So either way, a Clinton vs Trump race is one with a small Clinton advantage, but still a race that could go either way.
In just a few more days, we’ll have actual delegate leaders in both parties. Things are moving fast.
284.6 days until polls start to close on Election Day 2016.
Note: This post is an update based on the data on ElectionGraphs.com. Election Graphs tracks both a poll based estimate of the Electoral College and a numbers based look at the Delegate Races. All of the charts and graphs seen in this post are from that site. Additional graphs, charts and raw data can be found there. All charts above are clickable to go to the current version of the detail page the chart is from, which may contain more up to date information than the snapshots on this page, which were current as of the time of this post. Follow @ElectionGraphs on Twitter or like Election Graphs on Facebook to see announcements of updates or to join the conversation. For those interested in individual general election poll updates, follow @ElecCollPolls on Twitter for all the polls as they are added.
It is getting boring to keep saying “Republican getting stronger against Clinton”, but it is time for yet another update saying just that. As has been common lately, the Republican in question is Rubio, so lets look at these moves:
North Carolina
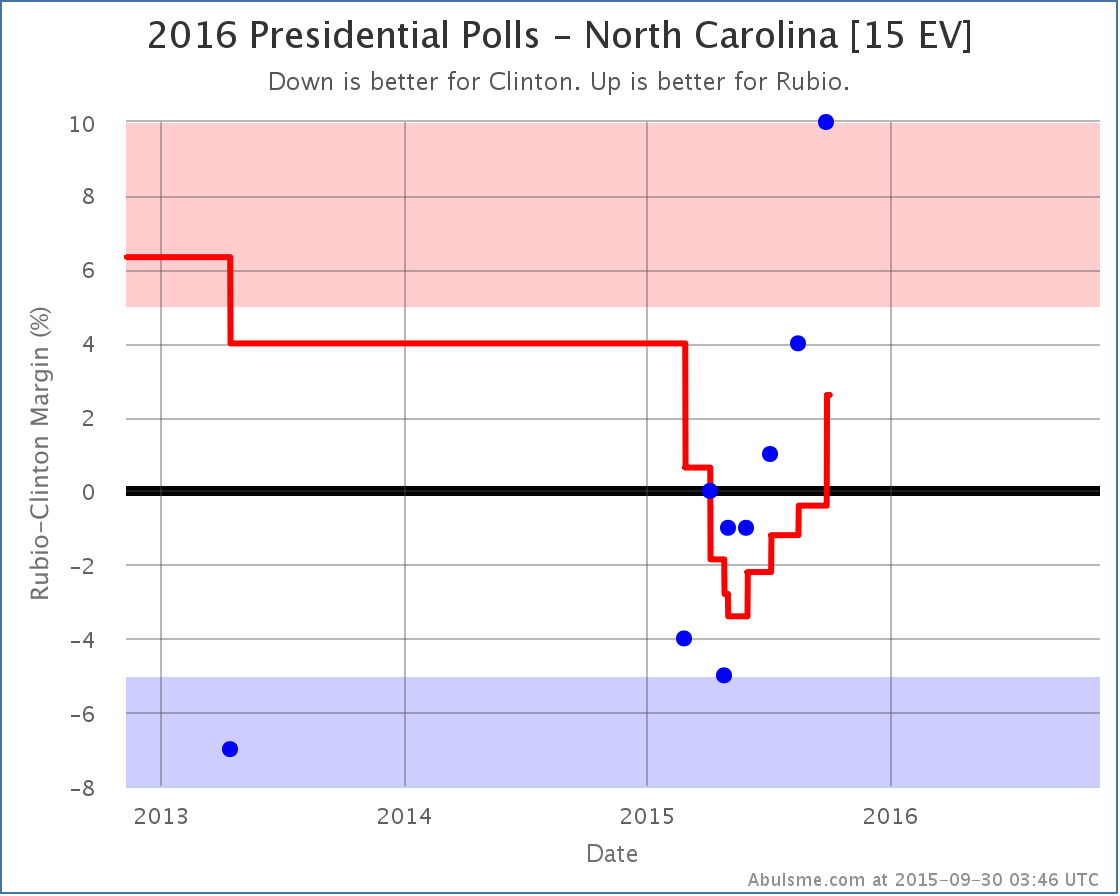
Look at that trend! It just gets worse and worse for Clinton. Every new poll in the last few months has been worse than the poll before. And with the latest, the average flips to Rubio’s side of the line.
North Carolina was never going to be a blow out for Clinton, but it was looking for awhile that she was in a good position to pull out a narrow win. That possibility seems to be evaporating quickly.
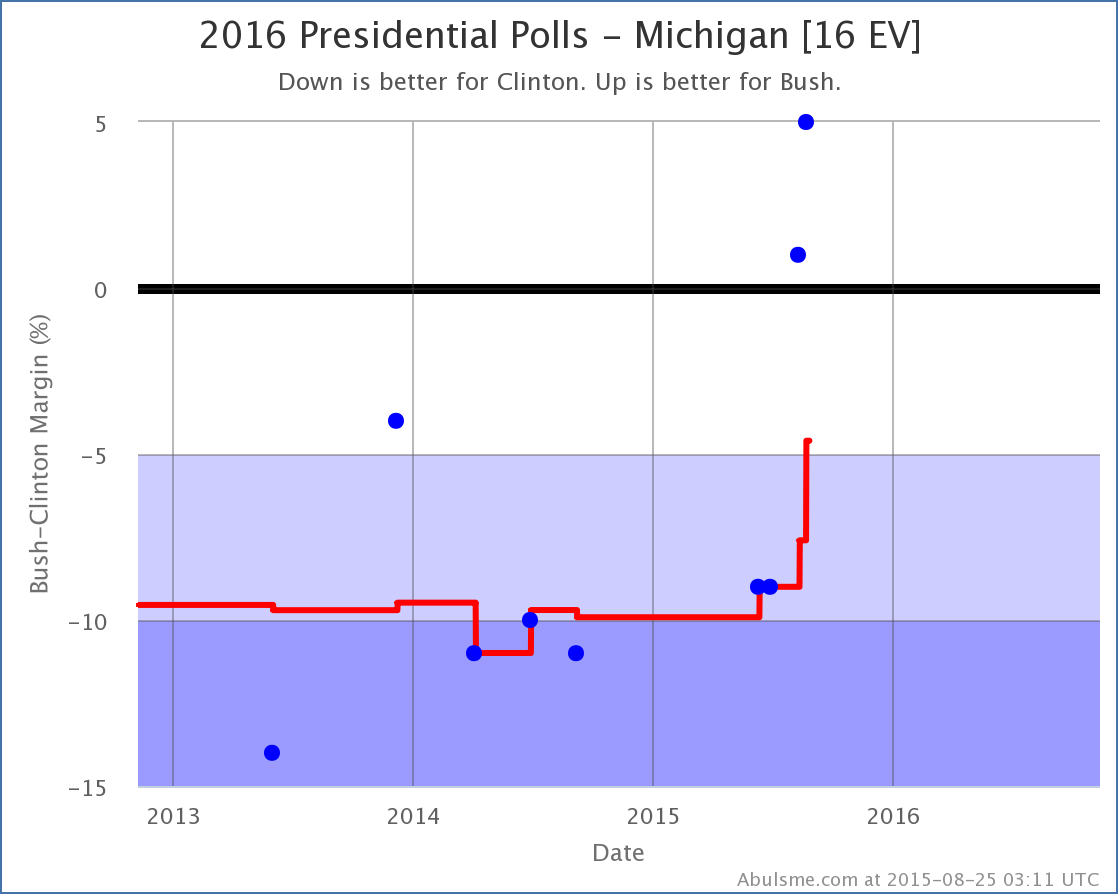
Michigan
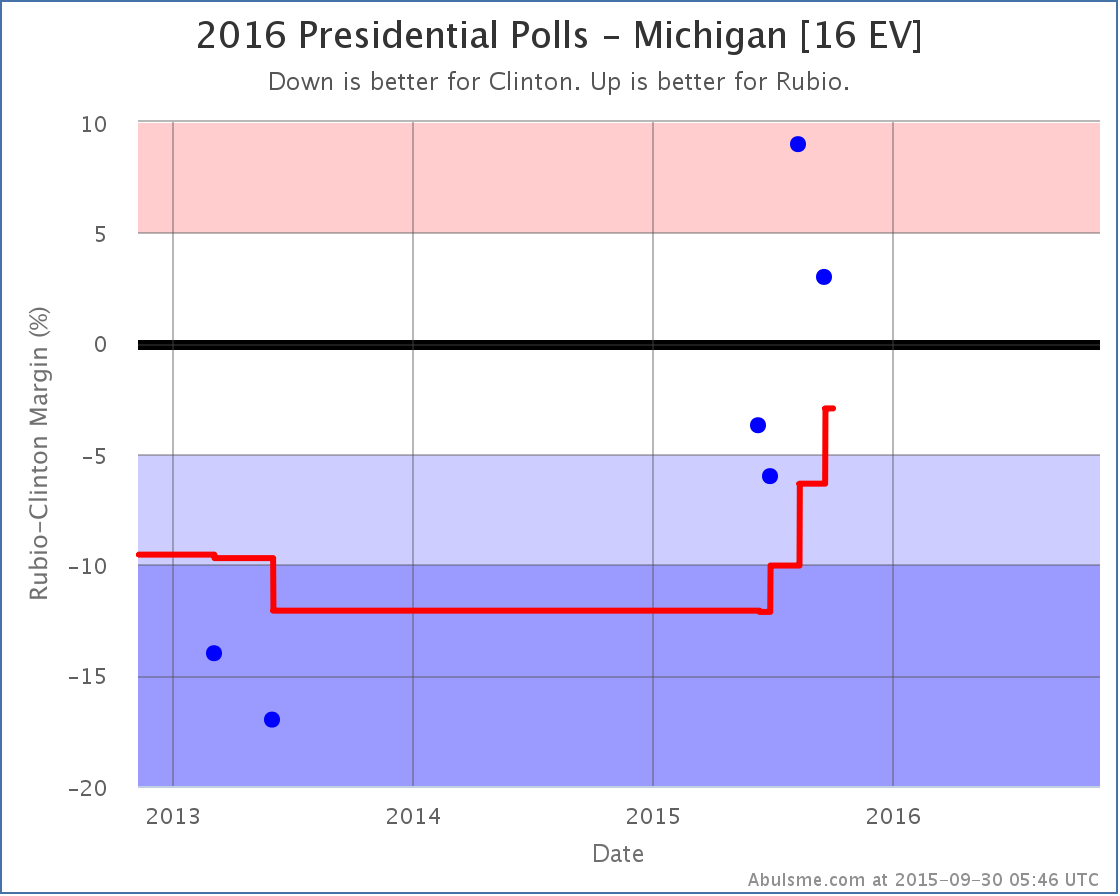
There are less polls to back it up, but the move in Michigan is potentially more dramatic. In a few months the average has gone from a strong Clinton lead, to Michigan essentially being a toss up.
Once again, not a good trend for Clinton. Michigan has not gone Republican since voting for George HW Bush in 1988. In 5 of those 6 elections the winning margin for the Democrats was over 5%. In two of them it was over 10%. A close Michigan means a Clinton in trouble.
National Overview
Yes, if everybody wins the states where they are leading in my poll average, Clinton still wins… barely. But there are a HUGE number of states where it is close. In this matchup, nine states are in play and the range of possible outcomes is very wide. Right now Rubio’s best case (if he sweeps all the close states) is actually better than Clinton’s best case (if she sweeps the close states).
Clinton still has an advantage here, but just by the slimmest of margins. There is a long way to the election, but for the moment, at least in the Clinton vs Rubio matchup, this is a close race…
Other Candidates
So Rubio is doing well against Clinton, and that is the only one of the five best polled candidate combinations with a change today, but a quick look at the comparison is still useful.
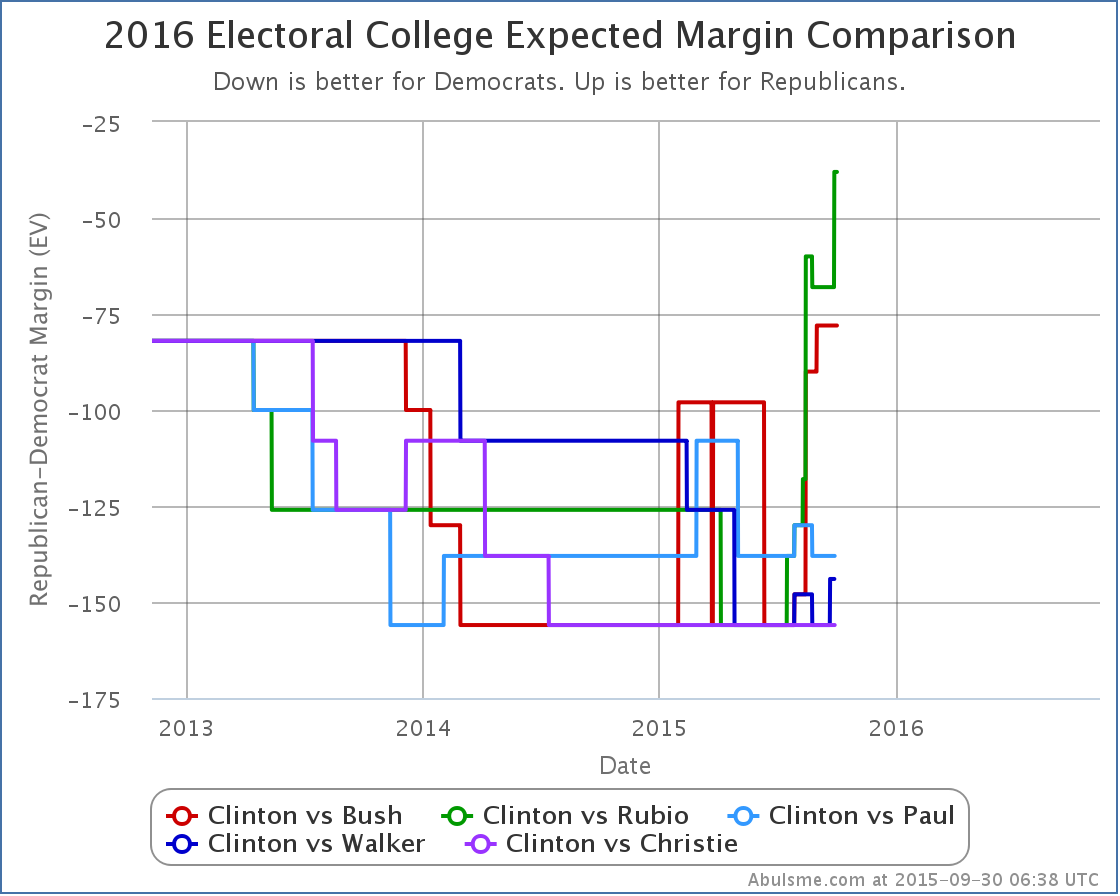
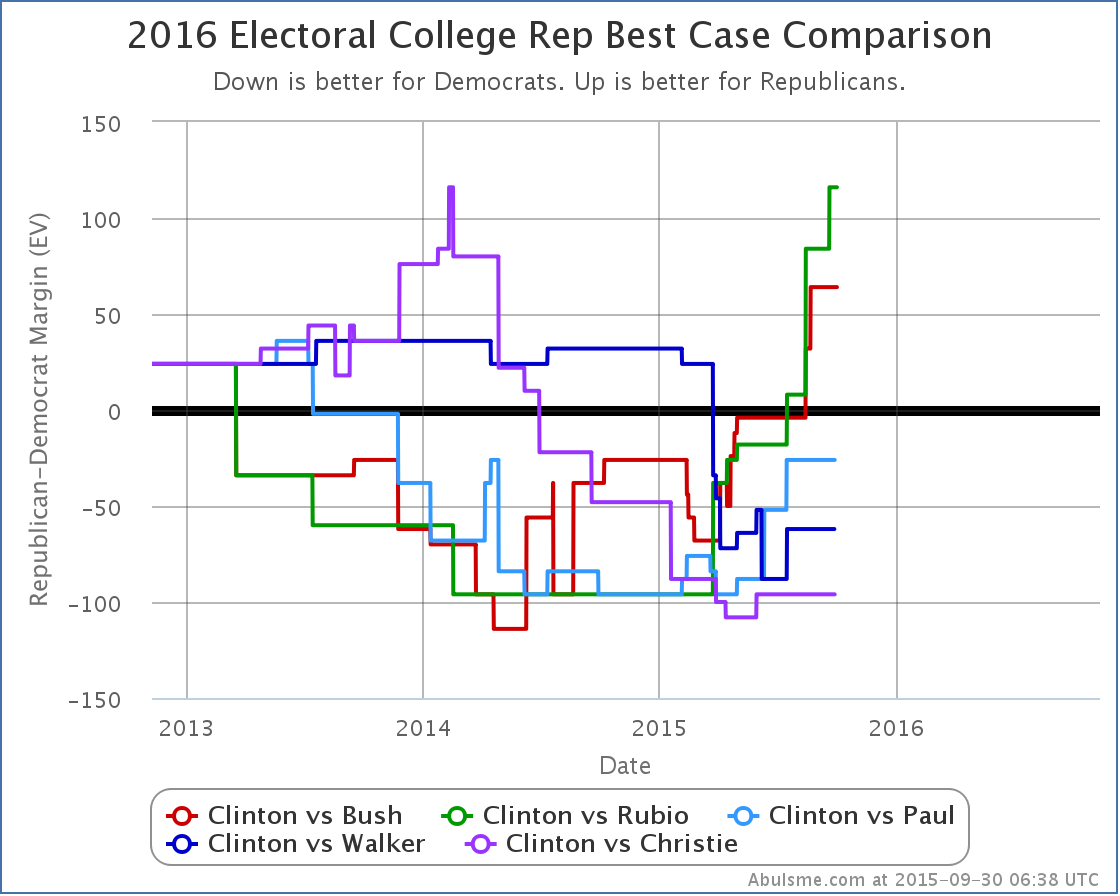
Highlighting these two comparisons specifically because of the Rubio changes today, but similar trends show up for the other comparisons. Of the five best polled combinations, Bush and Rubio are standing out and have been dramatically improving their positions vs Clinton. Paul, Walker and Christie… have not. At least not lately. Of course, Walker has already dropped out at this point, and Christie and Paul are on life support, with their national Real Clear Politics polling averages at 3% or less right now. So they just aren’t getting the attention… or the polling volume lately… of Bush and Rubio.
As I’ve mentioned before, other candidates are getting a lot more attention now, but they are still way behind these five in the arbitrary polling quality metric I use. They just haven’t had enough sustained polling to get a comparable picture yet. That will change if the folks like Trump and Carson and Fiorina remain viable and folks like Paul, Walker and Christie fade away. Same thing for Sanders and Biden. It just takes a bit of time to get enough good state polls to start paying serious attention to the results in an analysis like this.
405.1 days until polls start to close.
Note: This post is an update based on the data on ElectionGraphs.com. All of the charts and graphs seen here are from that site. Graphs, charts and raw data can be found there for the race nationally and in each state for every candidate combination that has been polled at the state level. In addition, comparisons of the best polled candidate combinations both nationally and each in each state are available. All charts above are clickable to go to the current version of the detail page the chart is from, which may contain more up to date information than the snapshots on this page, which were current as of the time of this post. Follow @ElecCollPolls on Twitter for specific poll details as I add them.
Clinton’s deterioration against the Republican field continues. There are two changes of note today, both show Republicans getting stronger against Clinton.
Clinton vs Rubio
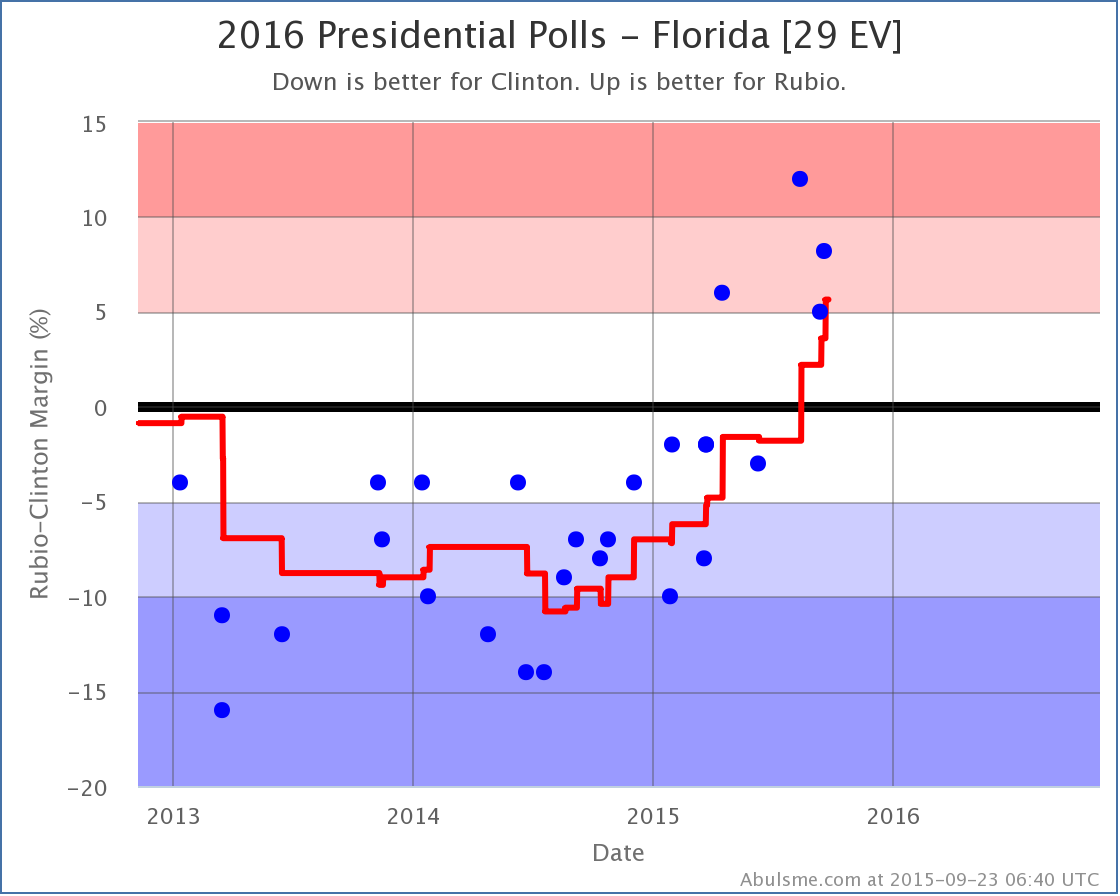
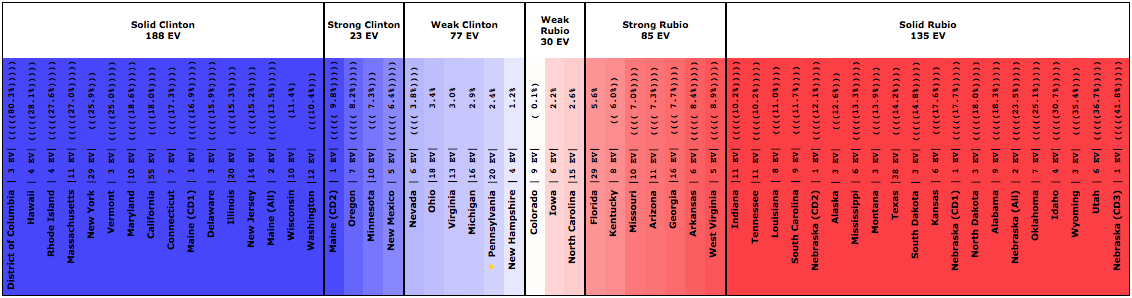
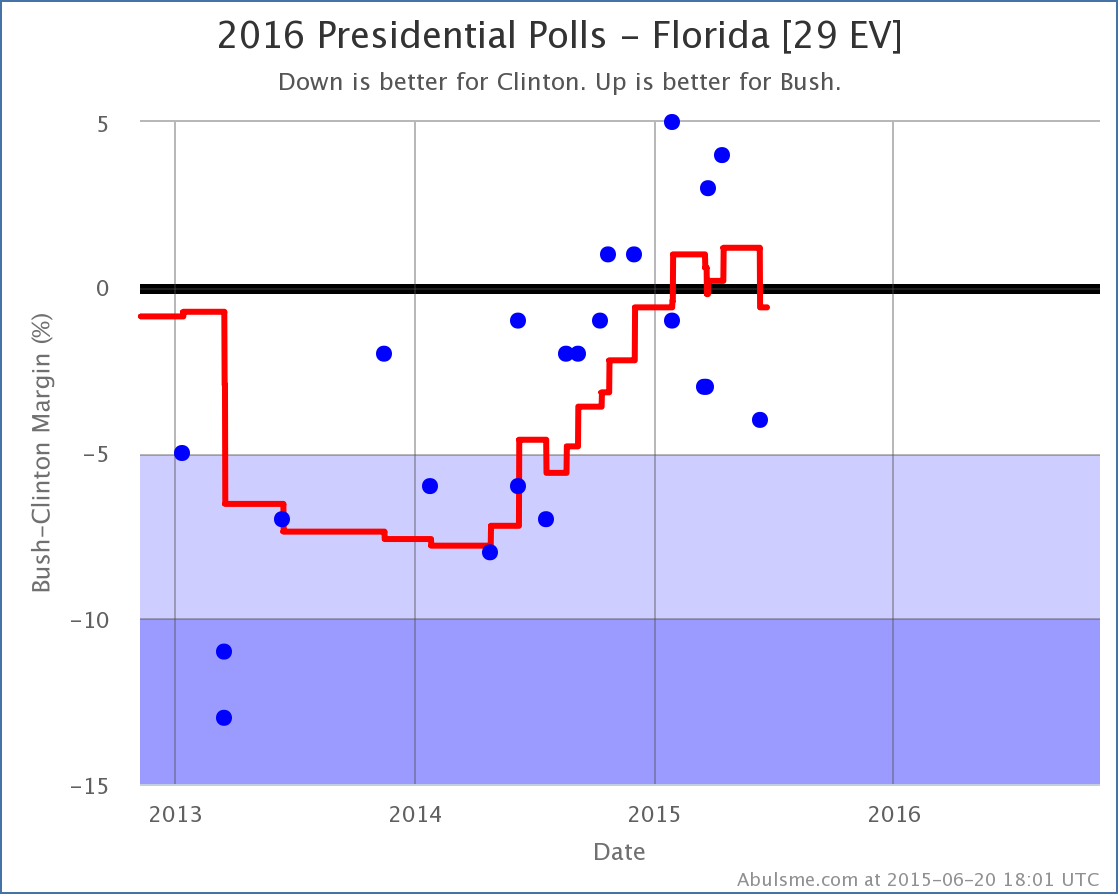
Clinton has now not been ahead in a Clinton vs Rubio poll in Florida since June. And four of the five polls in the average show Rubio leads of 5% or more. With the latest one of these polls, my poll average now shows Rubio’s lead in Florida as 5.6%. That takes Florida out of the “close state” category. So Clinton’s “best case” no longer includes winning Florida.
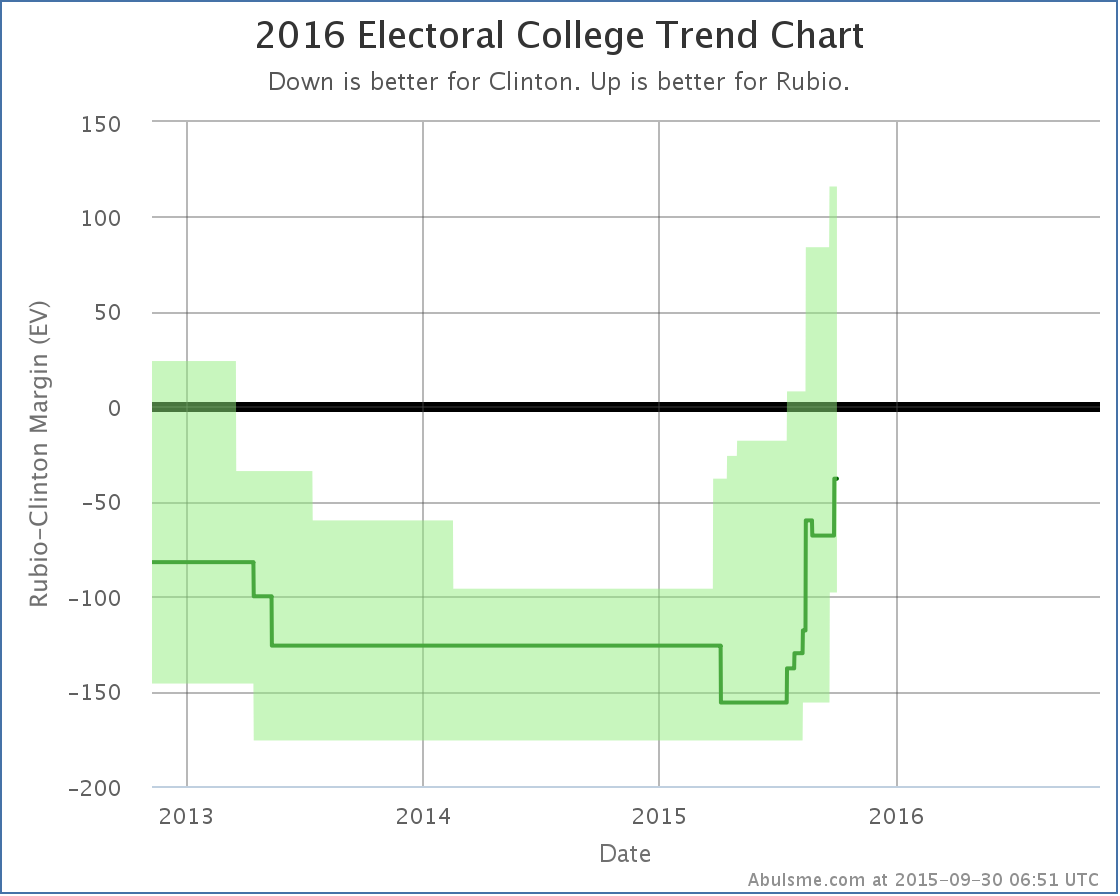
The scale of this collapse in Florida is particularly striking. As recently as last October, Clinton had a greater than 10% lead against Rubio in Florida. This put Florida in the “Solid Clinton” category. But over the course of the last year, that lead evaporated. And now Rubio is not just ahead, but significantly ahead. Now, this chart itself is a perfect example of how much things can change in a year. We are too far away for election day for this to be predictive of what would actually happen in Florida in a Clinton vs Rubio race next year. But this still looks very bad for Clinton.
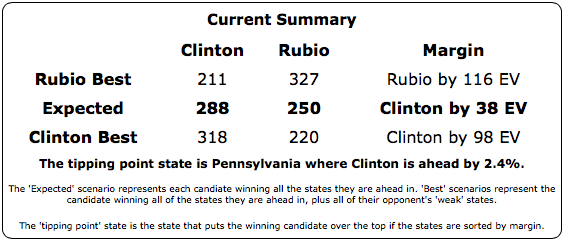
The new situation summary for Clinton looks like this:
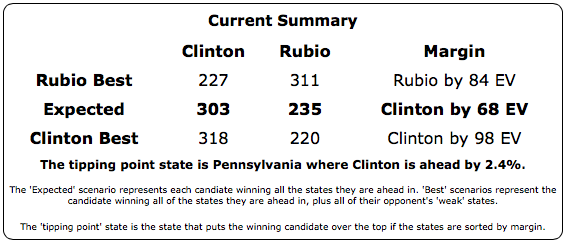
Clinton is still ahead… barely. But it is looking much more like a toss up. A tipping point of 2.4% could literally disappear overnight with the right events happening in the campaign. As recently as March, Rubio’s best case was to lose by 96 electoral votes. Now Clinton vs Rubio is too close to make a confident prediction, and even Clinton’s best case is deteriorating.
Florida is a big state, Florida is important. Clinton being this far behind in Florida is a significant issue for Clinton. Clinton doesn’t NEED Florida to win, but the paths without it are much tighter.
Clinton vs Bush

The latest results in Michigan for Clinton vs Bush don’t change the category of the state. It was “Weak Clinton” before the latest poll, and is “Weak Clinton” after the poll. But the move from Clinton by 4.2% to Clinton by 2.2% moved Michigan past several other states when you order the states by Clinton vs Bush margin, including moving past Ohio, which had been the tipping point state. Without Michigan to the left of Ohio, the tipping point moved from Clinton by 3.8% in Ohio, to Clinton by 2.4% in North Carolina.
Only four very close states, all with margins at 2.4% or less, need to flip to put Bush in the lead. In terms of tipping point, Clinton vs Bush is now tied with Clinton vs Rubio as the two of the five best polled candidate pairs that do the best against Clinton.
(Walker has of course now dropped out, he will likely be replaced in this comparison chart soon.)
When looking at the tipping point across these five candidate matches, while all but Huckabee made significant gains over Clinton in the last year, it is clear that in the last few months only Rubio and Bush have continued that movement in the last few months… but they have moved things significantly. The picture for the general election is starting to look very different depending on which Republican is up against Clinton.
What about Trump? Carson? Fiorina? Or what about Sanders and Biden? The bottom line is that compared to the candidates above, they simply have not been considered “serious candidates” for long enough to have a significant amount of state level polling. In my ranking of the best polled candidate combinations, Clinton vs Fiorina is #21, Clinton vs Carson is #22, Clinton vs Trump is #23. The highest combination with Sanders is #9. The highest with Biden is #10. You can look at these combinations if you want, but frankly there simply has not been enough polling yet on the state level to get a good picture of what those races really would look like, so interpret anything you see there with extreme caution.
412.4 days until polls start to close.
Note: This post is an update based on the data on ElectionGraphs.com. All of the charts and graphs seen here are from that site. Graphs, charts and raw data can be found there for the race nationally and in each state for every candidate combination that has been polled at the state level. In addition, comparisons of the best polled candidate combinations both nationally and each in each state are available. All charts above are clickable to go to the current version of the detail page the chart is from, which may contain more up to date information than the snapshots on this page, which were current as of the time of this post. Follow @ElecCollPolls on Twitter for specific poll details as I add them.
The streak continues. More bad news for Clinton. This time in Michigan.
With the addition of Michigan polls from Mitchell and EPIC-MRA, Michigan moves from Strong Clinton to Weak Clinton:
This pattern, a hockey stick type movement away from Clinton and toward various Republicans, has now shown up on the charts for quite a few different states, across a wide variety of Republicans. One or two of these in isolation look like outliers, but together they look like a real movement. Over the last few months Clinton has been weakening, and weakening quickly and dramatically.
So far, none of the Republicans are leading overall, but the best cases from Rubio and Bush both now include winning, and with Michigan now on the potential list for Bush as well, he improves his best case further:
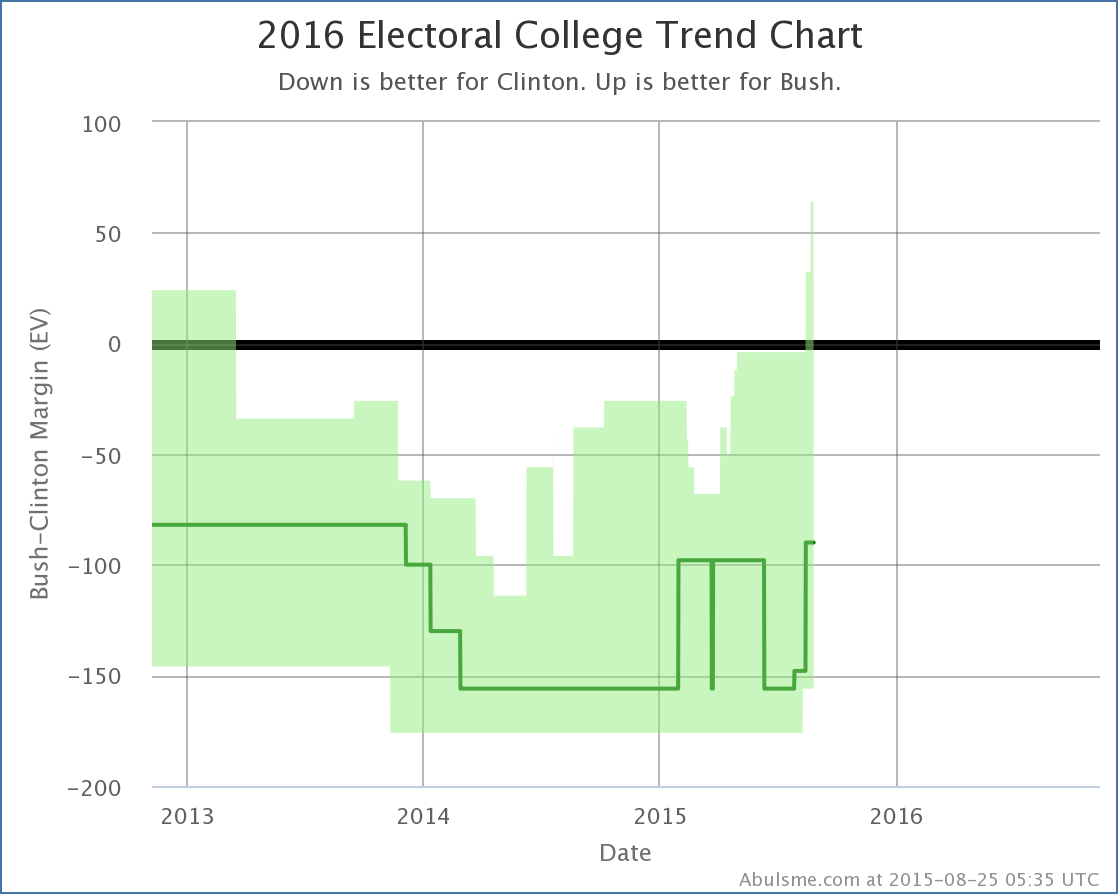
Bush’s best case, where he wins all of the states where he leads, plus all the states where Clinton is ahead by less than 5%, now is Clinton 237, Bush 301, a 64 electoral vote win for Bush. The expected case is still a 90 electoral vote loss for Bush, but he’s only a handful of close states away from a win. If the drumbeat against Clinton continues, do not be surprised if some of those states start to flip.
Clinton can’t be happy here. She is now below 50% in the Real Clear Politics national view of the Democratic nomination race, and her position in the general election has been slipping fast against the major Republican contenders. No wonder we’re getting all the Biden buzz, and people keep looking at Sanders. Right now she is showing weakness. The question is if she hits a floor, or keeps falling. And if she does keep falling, who takes advantage of it?
441.7 days until the polls start closing.
Note: This post is an update based on the data on ElectionGraphs.com. All of the charts and graphs seen here are from that site. Graphs, charts and raw data can be found there for the race nationally and in each state for every candidate combination that has been polled at the state level. In addition, comparisons of the best polled candidate combinations both nationally and each in each state are available. All charts above are clickable to go to the current version of the detail page the chart is from, which may contain more up to date information than the snapshots on this page, which were current as of the time of this post. Follow @ElecCollPolls on Twitter for specific poll details as I add them.
Today’s update (which included a Detroit News poll in MI and Quinnipiac polls in Florida, Ohio and Pennsylvania) brings seven changes of note to the five best polled candidate pairs. Plus Clinton vs Bush once again takes the top spot as the best polled candidate pair, but there isn’t much else to say about that. As usual, click on any of the charts for more details from election2016.abulsme.com or follow @ElecCollPolls on Twitter for detailed poll information as I add it.
Tipping Point Moves
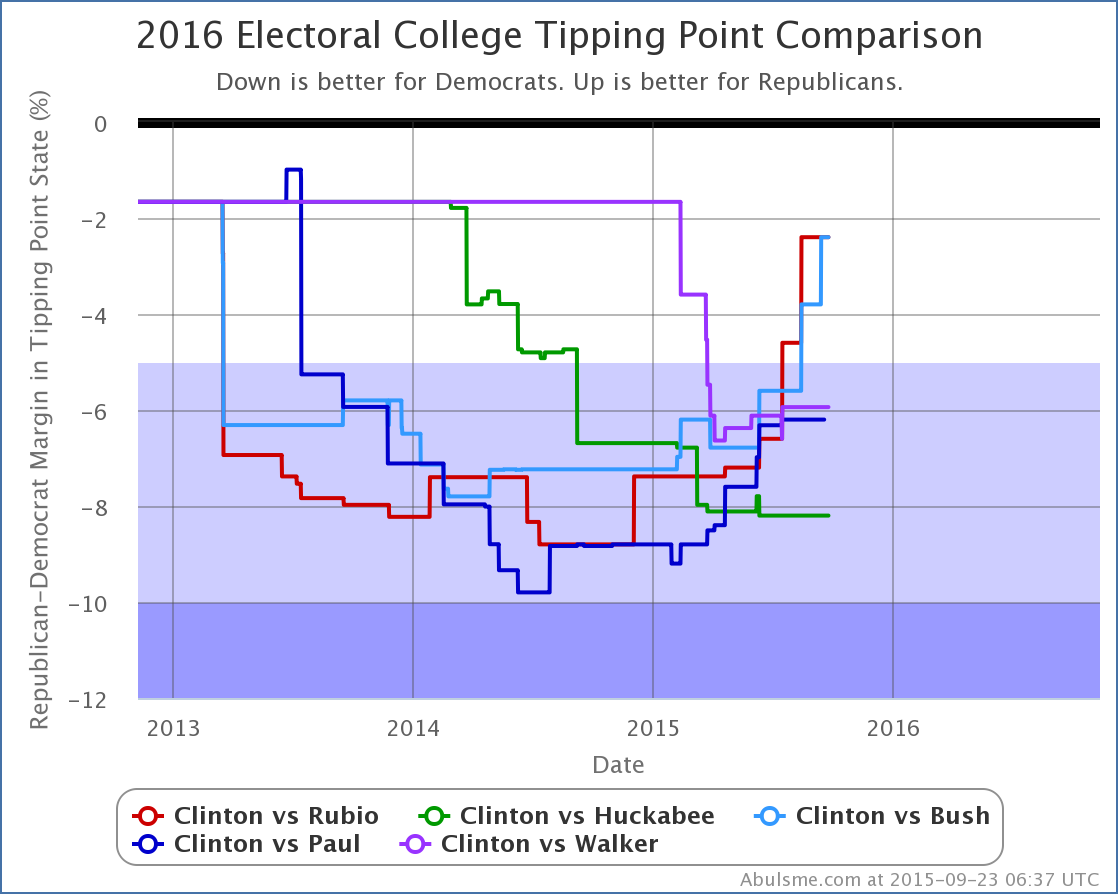
Five of those seven changes are tipping point changes. (Reminder: The tipping point is the margin in the state that would put the winning candidate “over the top” in the electoral college.) The tipping point changed for all five of the candidate pairs, so instead of looking at them individually, lets look at the comparison:
Looking both at the most recent change, and also at the change over the last three months, Bush, Paul, Christie and Rubio have all improved vs Clinton. Only Huckabee’s situation has worsened. For the candidates that are improving, the movement seems to be accelerating.
Bush’s tipping point specifically is down to only 5.6%. This still translates into a “Strong” lead for Clinton according to the categories I have defined, but we’re getting pretty close to the 5.0% boundary. Just a few more good polls for Bush in the right states, and the tipping point could move into the “Weak Clinton” zone, meaning that if Bush managed to win all of the close states (including the ones where Clinton is a little ahead) he would win. At that point, we would have an actual competitive race. Clinton would still be ahead, but a Bush win would be within the realm of reasonable possibility.
Clinton vs Bush
In addition to the tipping point changes, a couple of states changed categories. First up, Bush in Florida.
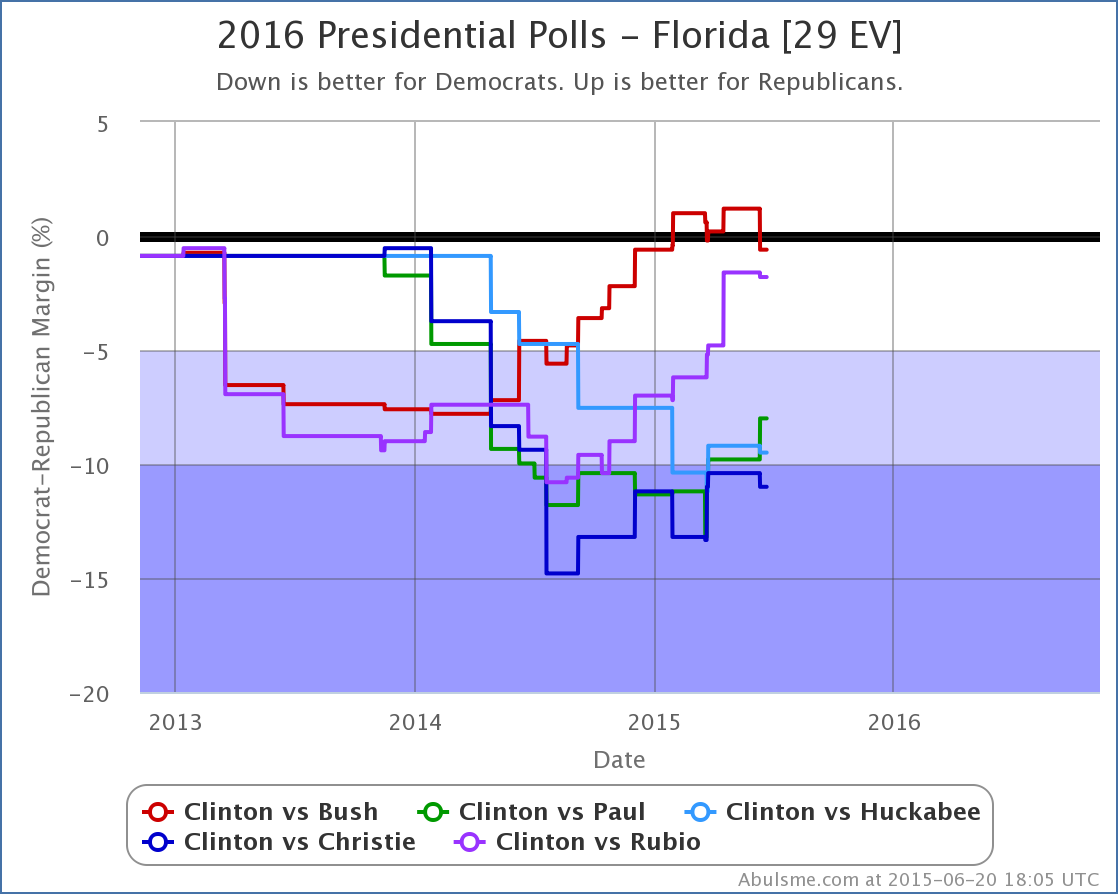
Florida moves from just barely Bush, to just barely Clinton. Bottom line, in this paring, Florida is close. Right now this is true for only Bush and Rubio. The other three Republican candidates in the top five polled pairs trail Clinton badly:
For Bush though, for the moment, Florida slips off the list of states he is ahead in, and his “expected case” drops:
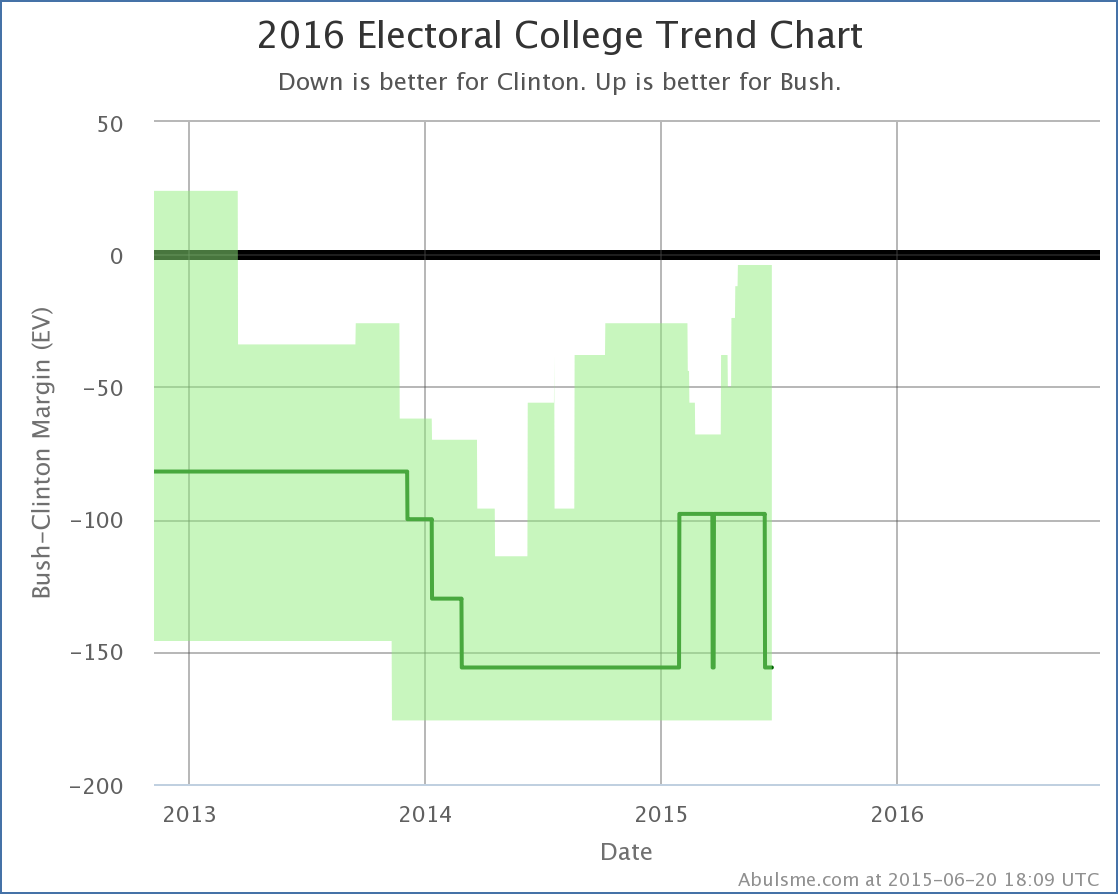
This brings Bush’s “expected” result back to Clinton 347 to Bush 191, a 156 electoral vote loss. (This is the same margin at the moment as Huckabee, Christie and Rubio… only Paul differs right now, losing by only 138 electoral votes because unlike the others, Paul is ahead in Colorado.)
Clinton vs Paul
The other category change is that in Clinton vs Paul, Ohio moves from Strong Clinton to Weak Clinton:
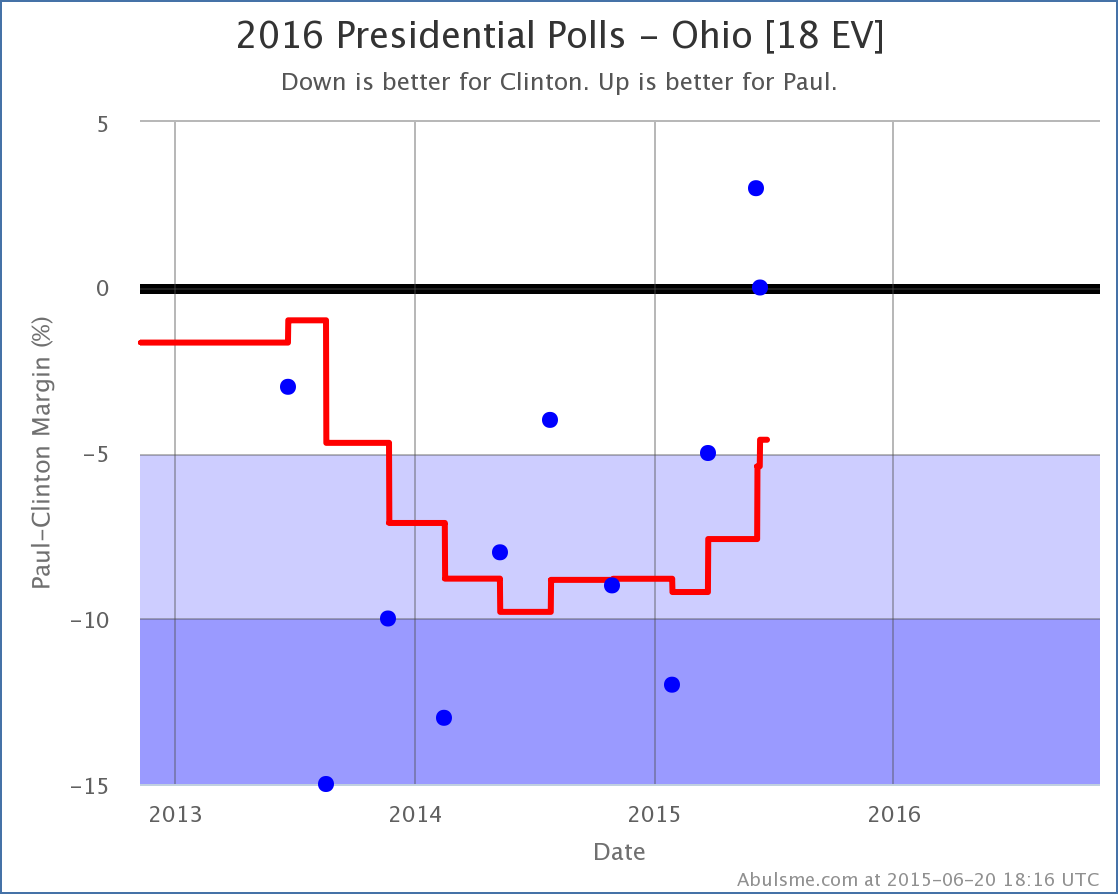
The last two polls actually show Paul ahead in Ohio. The average, which covers almost 8 months of polls at the moment, isn’t there yet, but it is moving in Paul’s direction. Ohio is looking closer and closer.
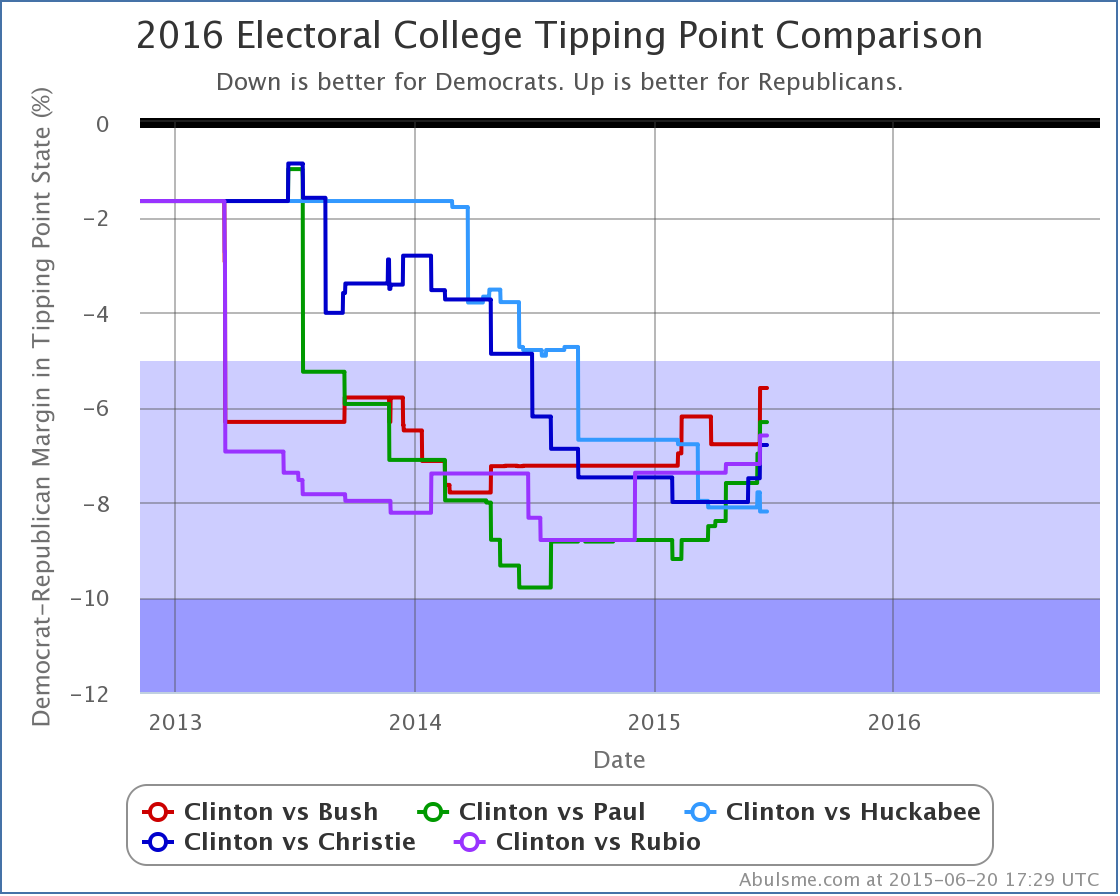
And that isn’t just Paul. If we do the comparison in Ohio, we see this movement is broader:
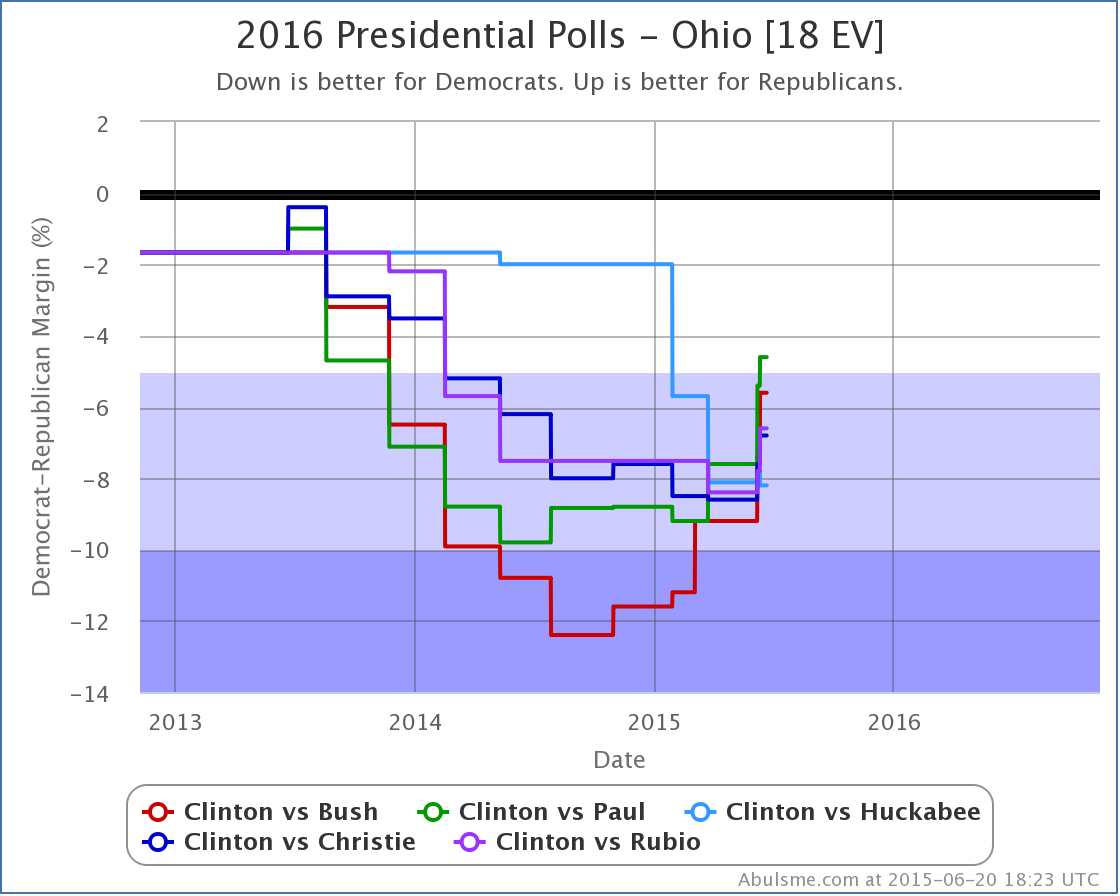
Once again, everybody except Huckabee is improving against Clinton. Or perhaps it would be better to say that Clinton is falling. Either way, Ohio is looking closer than it did. Paul is the first of these five candidates to move Ohio into the “potential win” category according to my classifications, but Bush isn’t far behind.
For Paul, this improves his “best case” where we give him all of the states he is ahead in, plus all the states where Clinton’s lead is less than 5%:
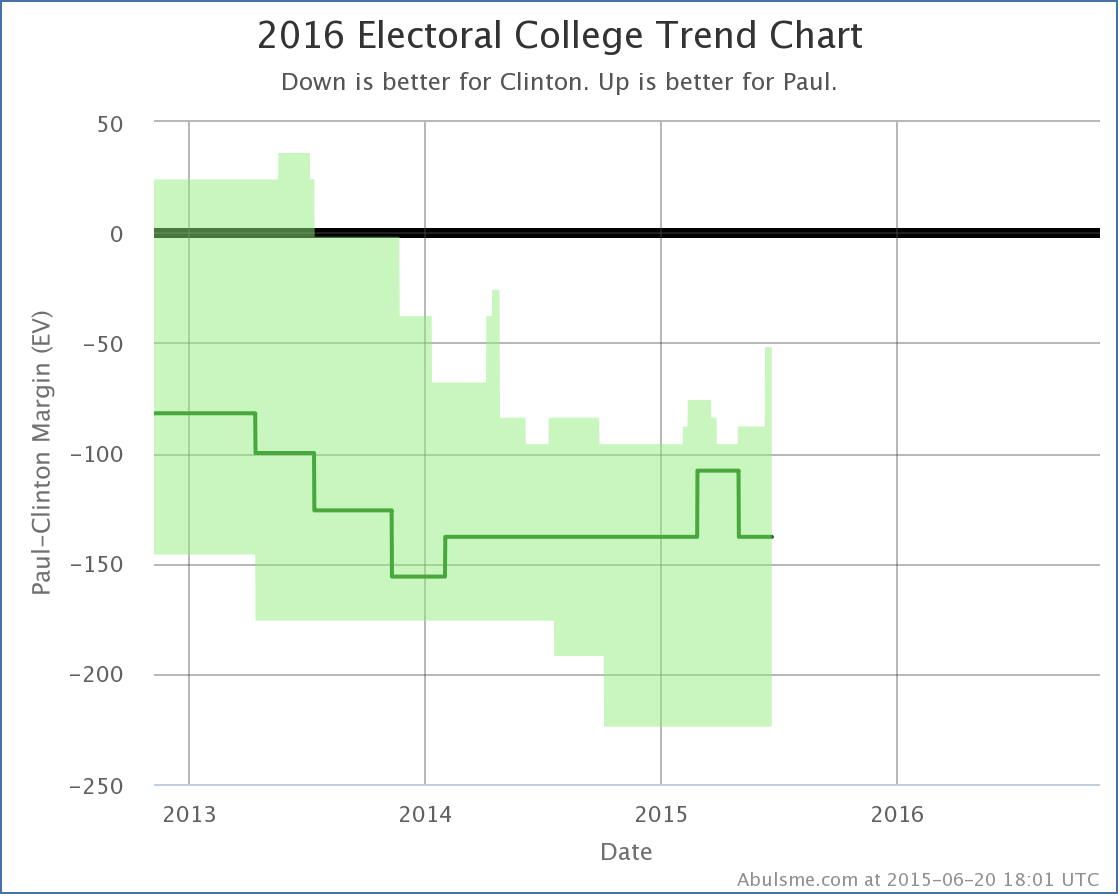
In his “best case” Paul now only loses to Clinton by 52 electoral votes. This is Paul’s best best case since I officially launched this analysis after the November election.
Pennsylvania
The polls this time around in Michigan didn’t change anything, but the ones in Pennsylvania are worth mentioning even though there were no category changes for any of the five candidate pairs.
Brandon Finnigan (@ConArtCritic) of the Ace of Spades HQ Decision Desk election tracking site tweets constantly about how Republicans should be targeting Pennsylvania as the keystone (get it?) to their election strategy. In his recent article “How The GOP Could Win Pennsylvania” he outlines the argument. So lets look at how the state is going given current polling. (Which of course will change a lot before we get to the election.)
Moves in Pennsylvania did contribute to some of the tipping point changes we talked about today, and when we look at Pennsylvania, we are seeing what looks like clear movement toward the Republicans, even though it isn’t quite switching categories yet:
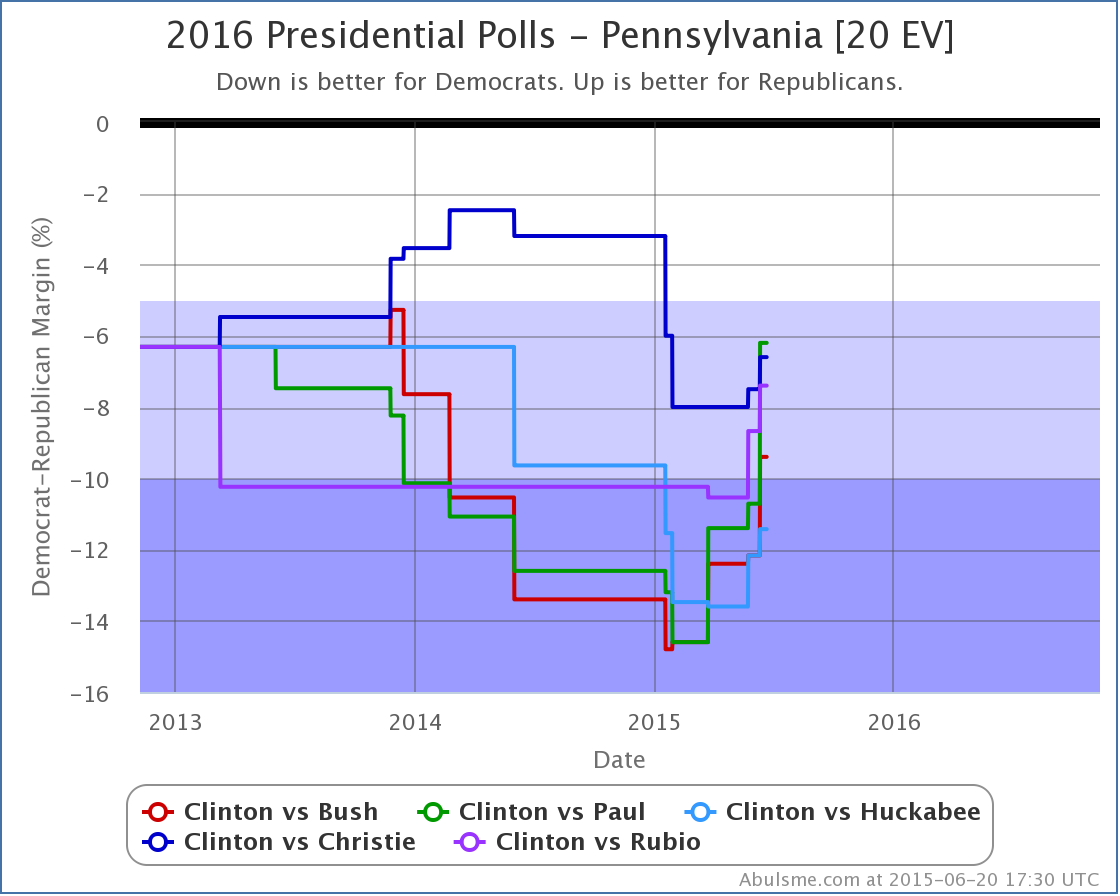
All five candidates have improved against Clinton in the last three months, some of them by large margins. Paul went from down by 14.6% in March, to down by only 6.2% right now. That is a huge move!
Now, this probably isn’t because any of the candidates are specifically targeting Pennsylvania at this point, but more likely just a reflection of Clinton’s overall decline nationally. None of the candidates have made it close in my poll averages yet, but Clinton’s margins have been narrowing rapidly.
Finnigan is certainly right that if the Republicans can make Pennsylvania close, let alone turn it red, this probably means an overall Republican victory in the electoral college, because whatever they did that could flip Pennsylvania would almost certainly flip other blue states that currently are closer than Pennsylvania as well.
Now, does that mean targeting Pennsylvania specifically rather than going after those closer states first is the best strategy? I don’t know.
For Bush for instance, if you start with the states he is already ahead in and then see which states he would need to flip to win, you get this list (in order by how far behind Bush is right now in my poll averages):
At that point Bush would have enough electoral votes to win. To get to Pennsylvania on this list, you’d have to also go past Minnesota, Nevada, Wisconsin, and Michigan. Then Pennsylvania.
Would it be better to concentrate directly on the seven states above? Or is jumping forward to Pennsylvania’s 20 electoral votes somehow an easier path? If Pennsylvania is specifically more vulnerable due to some of the factors Finnigan mentions, then maybe.
I think Finnigan’s point is broader than that though. It isn’t that Pennsylvania is a better target than Ohio or Colorado, although maybe it is. It is more that if the Republicans took Pennsylvania seriously, and did everything they needed to do to win Pennsylvania, then those same things could be applied more broadly, and a lot of other states would move too, and the Republicans would not just win, but win clearly, not a “just barely” sort of win like they got in 2000 and 2004.
The movement we’re seeing so far does show that Pennsylvania is movable. Can it move enough to make it red? I have my doubts absent the Democratic candidate simply collapsing on a nationwide basis. But Pennsylvania might be worth watching anyway…
Bottom Line
Aside from Florida moving her direction but remaining pretty close, and Huckabee generally not doing well, Clinton seems to be continuing to weaken against most Republicans. This reflects the campaign beginning to get under way in earnest, and the name recognition gap slowly diminishing. The question is where this trend ends. After a few debates happen, do we reach some sort of steady state Clinton lead a bit narrower than it is today, or do the Republicans continue to gain on her until we really have a race that could go either way, or even with Republicans in the lead?
As usual, stay tuned. 507 days to go!
Note: This post is an update based on the data on my 2016 Electoral College Analysis Site. All of the charts and graphs seen here are from that site. Graphs, charts and raw data can be found there for the race nationally and in each state for every candidate combination that has been polled at the state level. In addition, comparisons of the best polled candidate combinations both nationally and each in each state are available. All charts above are clickable to go to the current version of the detail page the chart is from, which may contain more up to date information than the snapshots on this page, which were current as of the time of this post. Follow @ElecCollPolls on Twitter for specific poll details as I add them.
Edit 23:07 UTC to add some additional links to the election site and Twitter.


|
Romney |
Obama |
| Romney Best Case |
294 |
244 |
| Current Status |
206 |
332 |
| Obama Best Case |
190 |
348 |
No states were called between 01:45 UTC and 02:00 UTC, but a ton were called between 02:00 UTC and 02:15 UTC:
- Romney: KS, LA, NE-All, NE-1, ND, SD, TX, WY, MS
- Obama: MI, NY, NJ
All of these were no brainer expected states, except for Michigan. Michigan is the first state of the night to be called where the margin was less than 5% in the polls, so winning this state made a difference between the “best cases” that I present. Obama was ahead here by 4.5%, so a win here was predicted, but it was a close state and one that Romney really needed.
As of the final update I made on election day, Michigan was the tipping point state. That means Romney had to win all the states he was doing better in than Michigan PLUS Michigan in order to win. He just lost Michigan, which means he now needs a state he was further behind in that Michigan in order to win.
This is very bad news to Romney. His path to victory is now not quite impossible, but very close. Let’s look:
With all the states he has already won, plus the uncalled states where Romney was ahead by more than 5%, he had 190 electoral votes. Then the areas he was ahead in:
- Nebraska 2nd (1): 3.8% Romney lead
- North Carolina (15): 1.4% Romney lead
That gets Romney to 206. He needs 63 more electoral votes. Looking at the remaining states that haven’t yet been called:
- Iowa (6): 2.0% Obama lead
- Florida (29): 2.3% Obama lead
- Colorado (9): 2.4% Obama lead
- New Hampshire (4): 2.8% Obama lead
- Maine 2nd (1): 2.8% Obama lead
- Virginia (13): 3.6% Obama lead
- Pennsylvania (20): 4.8% Obama lead
- Nevada (6): 4.8% Obama lead
If Romney wins all of those through Pennsylvania, it gets him to 288 electoral votes, which wins him the Presidency. If he doesn’t win Pennsylvania to win, he needs every other one of those states, including Nevada, which would get him to 274. If he does win Pennsylvania, then he could afford to lose Virginia, New Hampshire and Maine’s 2nd (and Nevada).
But that is a very tall order! And there will be another update coming soon…

As election day approaches, the number of polls coming in each day has increased dramatically, and that means some states will be jiggling just from the higher volume of polling, although some of it may represent actual movement too.
Today according to the five poll average, five states change categories today, and they all move toward the center, toward being more competitive. But when we look at them, it turns out none of these (with one possible exception) look like they will be in a position to make any difference in this race. Let’s take a look at each of them anyway:

Missouri had been trending further toward Romney, but the last poll looks like Obama may be gaining a bit of support there. It doesn’t matter though, Romney is going to win Missouri.

Wisconsin had bounced up to over a 5% Obama lead. It now falls below that level to a 4.5% Obama lead. This is close enough that I once again classify Wisconsin as “Lean Obama” and therefore a state that Romney could win. But of all the close states, this is the one with the second largest Obama lead. There are many closer states that are better Romney targets as he tries to claw his way to 270.

Ever since Thursday I have been mentioning the big ugly outlier in Virginia. Well, today it finally rolls off the five poll average. With this the average drops to a 3.6% Obama lead. Virginia would never have left the “close state” category without the outlier, but even without the outlier, Obama has been making gains in Virginia. A week ago all the polling indicated a tied race in Virginia. No longer. It is still close, but now Obama has a clear lead.
Of the states changing status today, Virginia is currently the closest, and it is also the only one with a history of actually being very close. At the moment, Virginia isn’t close enough compared to the other close states to actually be part of Romney’s “easiest path to victory” which I’ll cover later in the post, but given the history of polling in the state, it could easily get closer again before we are done, so it still has a chance of making a difference in the race if Romney can win it.
This state is “getting closer” only because the outlier is rolling off the average though. Without the outlier, the trend is actually toward Obama in Virginia. Virginia seems to be slipping away from Romney.

I am showing a chart since August to show a bit more context for Georgia. The five poll average moved to a greater than 10% lead for Romney due to what is a clear outlier in September. Polling has been sparse in Georgia, because it hasn’t been in contention this cycle, so that outlier only rolled off the average today. I now have Romney with a 7.5% lead in Georgia.
So this “gain” for Obama doesn’t matter. Romney will be winning in Georgia.

Michigan has been hovering right around the 5% Obama lead mark for the last month or so. Usually Obama’s lead is slightly more, with today’s update it is slightly less… 4.7%. This is due to one recent poll that actually shows Romney ahead in Michigan! This is out of line with all other recent polling, but as usual, I do not manually remove outliers, I let the averages do their thing. (Although I keep thinking that maybe in 2016 I should use a median, which is less sensitive to these things.)
Anyway, at 4.7%, Michigan has the biggest Obama lead of any of the current crop of “close states”. Like Wisconsin, this means that there are a lot of other states that would be easier for Romney to take the lead in that Michigan. If Romney actually pulls ahead in Michigan, this means it is very likely that he has already pulled ahead in all of the other close states… at which point he would not only have won, but be heading for a pretty comfortable victory.
So while it might be a bit closer than it was (maybe), Michigan is still quite unlikely to end up flipping to Romney, or to be one of the critical states in the last days.
This brings us to the new map and summary:

|
Romney |
Obama |
| Romney Best Case |
338 |
200 |
| Current Status |
206 |
332 |
| Obama Best Case |
190 |
348 |
Romney’s best case now actually is the best it has been ALL YEAR LONG, exceeding his best case at the peak after the 1st presidential debate. In a sense, this does represent a Romney comeback in the last few days. He *is* making a bunch of states closer. He has taken a bunch of states where Obama had been ahead by more than 5%, and pulled them back so they are somewhat close. This may help him in the popular vote, but in the electoral college, it doesn’t look like he has moved any of these states ENOUGH. He may be making states closer, but he is NOT pulling them over the line to him.
Meanwhile, while Obama hasn’t been pulling ahead by more than 5% in more states, and he hasn’t managed to pull any more states to his side either, he actually has been increasing his lead in some of the most critical states.
Time to take a look in more detail by comparing the five poll average now to the five poll average 7 days ago:
- Nebraska 2nd (1): 3.8% Romney lead a week ago, 3.8% Romney lead now (no change)
- North Carolina (15): 2.4% Romney lead a week ago, 2.4% Romney lead now (no change)
- Colorado (9): 2.8% Obama lead a week ago, 0.4% Obama lead now (2.4% move toward Romney)
- Florida (29): 0.8% Romney lead a week ago, 1.1% Obama lead now (0.3% move toward Obama)
- New Hampshire (4): 1.0% Obama lead a week ago, 2.6% Obama lead now (1.6% move toward Obama)
- Ohio (18): 2.0% Obama lead a week ago, 3.4% Obama lead now (1.4% move toward Obama)
- Iowa (6): 1.2% Obama lead a week ago, 3.4% Obama lead now (1.2% move toward Obama)
- Virginia (13): 0.4% Obama lead a week ago, 3.6% Obama lead now (3.4% move toward Obama)
- Pennsylvania (20): 4.6% Obama lead a week ago, 3.8% Obama lead now (0.8% move toward Romney)
- Maine 2nd (1): 6.1% Obama lead a week ago, 4.2% Obama lead now (1.9% move toward Romney)
- Nevada (6): 2.8% Obama lead a week ago, 4.2% Obama lead now (1.4% move toward Obama)
- Wisconsin (10): 3.8% Obama lead a week ago, 4.5% Obama lead now (0.7% move toward Obama)
- Michigan (16): 6.5% Obama lead a week ago, 4.7% Obama lead now (1.8% move toward Romney)
That is a lot of close states! But what can be seen here? Out of 13 close areas, only FOUR moved toward Romney in the last week. Colorado, Pennsylvania, Maine’s 2nd congressional district, and Michigan. Of these only Colorado is in Romney’s easiest path to victory. I listed the states above in order by the level of Romney support from highest to lowest.
That means the states he NEEDS to be improving in the most in order to win are Colorado, Florida, New Hampshire, Ohio and Iowa. Looks like Colorado is almost tied now, so I guess whatever Romney is doing there is working and is time well spent. But the rest of these critical states are moving the wrong direction for Romney.
There has been speculation that Romney is trying to do a “hail mary” of some sort, trying to actually win Pennsylvania and Michigan as an alternate path to victory. The states he is ahead in, plus Florida, Colorado, Pennsylvania and then Michigan is certainly another path to victory. But given Obama’s current leads in those states, going through New Hampshire, Ohio and Iowa certainly seems like an easier path than Pennsylvania and Michigan. Perhaps Romney’s internal polling shows Obama’s support is “softer” in these states though.
For the most part though, this looks like effort put into the wrong places, while Obama consolidates his leads in the states more likely to be the tipping point. And that is the cue for today’s tipping point graph:

The Virginia outlier is gone, so now the chart can be interpreted directly. (I’ve removed the little x’s showing what things would have looked like if I had manually removed the outlier.) Iowa is now the tipping point state, and Obama is ahead by 3.4% in Iowa. There was a dip in the past few days (which was slightly more without the Virginia outlier) but Obama’s popped up again. If Romney manages to move the polls in all the close states by at least 3.4%, he can win. But that is a tall order at this point. A very tall order.
As I type there are 48 hours and a few minutes left until the first polls start closing on election night. 3.4% is a huge move in such a short time. Something incredibly dramatic would have to happen to move opinion that much in the final moments.
Romney’s only real hope at this point is that all the polls are wrong.
Absent that, Obama wins a second term.
Note: Chart and map from the Abulsme.com 2012 Electoral College Prediction page. Both assume Obama vs Romney with no strong third party candidate and show polling as it currently exists. Things will change before election day. On the map red is Romney, blue is Obama, gold states are too close to call. Lines on the chart represent how many more electoral votes a candidate would have than is needed to tie under several different scenarios. Up is good for Obama, Down is good for Romney.


Three states move between my categories today. One moves toward Romney, two move toward Obama. That sounds like a mixed day, but on balance the benefit goes to Obama. As usual, lets look at the states in order by electoral college weight, but now I’ll zoom in to only show 3 months of polls rather than a year since we are getting close to the end (under three weeks!) and polls are coming in so quickly…

First up, Colorado. According to the five poll average, the state went from an Obama lead of 4.9% on September 23rd, down to a Romney lead of 1.3% on October 8th. With today’s update, Obama takes a very slim 0.5% lead again. This is essentially a tie, but with this the state tips ever so slightly back onto the Obama side of the ledger.

Georgia is Romney’s one piece of good news for the day, but there are a bunch of caveats.
Romney’s lead in Georgia hits 10%, so we move it to the “Strong Romney” category. But this is largely due to one poll from September that looks like an outlier, so absent other movement backing up that poll, Georgia is likely to revert back to “Weak Romney” once that poll ages off. If we even have enough more polls in Georgia before the election to do that. It has been pretty sparsely polled.
More to the point though, it doesn’t really matter if Romney’s lead in Georgia is just under 10% or just over 10%. Either way, Georgia is a Romney state, and there is no realistic scenario where Obama wins Georgia. Georgia is safe for Romney. So while winning by a bit larger margin may be “nice” for Romney, it doesn’t actually help him at all in the contest with Obama.

Obama’s lead in Michigan topped out at 9.7% on September 20th. It declined to a 4.0% lead on October 8th. It has now popped back up to 6.1%. It seems that the post-debate movement toward Romney was relatively short lived. In the last three months the degree of Obama’s lead in Michigan has bounced around quite a bit. It has however always been a lead. A few isolated polls aside, Romney has never held the lead in the five poll average in Michigan. For awhile there it looked like Michigan was close. Not so much any more.
All of this leads us to the new summary:
|
Romney |
Obama |
| Romney Best Case |
301 |
237 |
| Current Status |
248 |
290 |
| Obama Best Case |
191 |
347 |
Since Georgia doesn’t affect any of these three situations, what we see here is basically just Obama strengthening again. Some of the gains Romney had made in the last couple of weeks are just slipping back away from him. Yesterday Obama’s lead in Pennsylvania once again became substantial enough to not call it a close state. Today the same happens to Michigan. And Obama retakes the lead in Colorado.
It certainly looks like Romney peaked between August 12th and August 15th and things are now heading back in Obama’s direction, without Romney ever actually taking the lead in the electoral college model. If initial reactions to the second debate are any indication, at the very least we should expect no further downward plummeting by Obama, and perhaps even more additional upside for Obama beyond that.
Caution needs to be urged in interpreting this though. Only a small number of states have moved so far, and just barely over the respective category lines. More polls could easily reverse the recent changes. If these initial trends continue over the next few days though, we’ll get a very solid picture.
None of the polls included so far include the time period after the second debate. That will of course be the next thing to watch for. Will there be big noticeable effects from the second debate as there were after the first one?
Of course to win, Romney needs to do more than just hold on to his previous gains. He actually needs to bring even more states over to his side in order to win. If he couldnt’ do it last week, then what exactly can he do now to make it happen?
At the moment Obama’s lead is still very narrow. Romney has many potential ways to win. It is still a close race. But the movement seems to be shifting toward Obama again.
Note: Chart and map from the Abulsme.com 2012 Electoral College Prediction page. Both assume Obama vs Romney with no strong third party candidate and show polling as it currently exists. Things will change before election day. On the map red is Romney, blue is Obama, gold states are too close to call. Lines on the chart represent how many more electoral votes a candidate would have than is needed to tie under several different scenarios. Up is good for Obama, Down is good for Romney.


In terms of the categories I use to classify states based on the average of the last five polls, today was another brutal day for Obama. It just keeps getting worse. There had been some talk about the “bump” from the debate having bottomed. I’m just not quite seeing it yet. One state does move in Obama’s direction today, and I’ll get to that, but for the most part the theme today is states that had once looked pretty safe for Obama now once again looking competitive.
So lets look at the states, from smallest to largest in the electoral college:

Immediately before the debate, Obama’s lead in Wisconsin stood at 9.2%. As of today’s update, it has dropped to a 3.6% lead with 4/5 polls now from after the debate. Huge drop. This of course puts Wisconsin back in “Lean Obama” territory, meaning Obama is ahead, but by a small enough margin it is easy to imagine Romney taking the state. Wisconsin has been in this category before of course. But it is a big change from the time period right before the debate.

Michigan looks pretty similar to Wisconsin. Right before the debate Obama had a 9.0% lead. Now he has a 4.0% lead with all five polls in the average after the debate. So Michigan also returns to “Lean Obama” and I include a win here in Romney’s best case.

Does the pattern look familiar? Before the debates, Obama had a 8.6% lead in Pennsylvania. Now with all five polls in the average after the debate, Obama’s lead is down to 4.0%. So Pennsylvania also comes within reach for Romney. Yes, he is still behind. In all three of these states. But they are all close. Another bad new cycle for Obama, and seeing these states move over to Romney does not seem impossible.

The one move toward Obama today is the biggest state moving today, but Obama folks should not get too excited. The five poll average for Florida moves from a 0.2% Romney lead yesterday to a 0.2% Obama lead today. Those margins are negligible. Either way, Florida is incredibly close and could very easily go either way. Before the debates Obama had a 3.2% lead in Florida, so his drop has not been as large here as elsewhere. But in a state this big and this close, every little bit counts.
Florida is hyper close, but I have to classify it somewhere, and for the moment, for today, it goes back into the Obama column, where it has been most of the year. Just barely.
Which brings us to the new summary of the race:
|
Romney |
Obama |
| Romney Best Case |
333 |
205 |
| Current Status |
215 |
323 |
| Obama Best Case |
191 |
347 |
Romney’s best case is better than it has been all year. He beats his post-primary peak from the beginning of September, and he even passes all time peak from January. Obama’s lead in state after state has just been washed away in the aftermath of the first debate. Obama is still ahead in these states for the most part… but what once had been substantial leads are now very narrow.
This is clearly not where Obama wanted to be right now.
Now, the current status does improve for Obama compared to yesterday because of Florida flipping categories, but as I mentioned above, the margin in Florida is essentially zero. So the difference between today and yesterday isn’t really substantive on that front. Either way, Florida is a toss up at the moment.
So to try to get a little more insight, although I won’t do this every time, lets once again look at the actual current margins in all of the close states to see how they rank. With just the states he is ahead in by more than 5%, Romney starts out with 191 electoral votes. From there Romney needs 78 more electoral votes to tie, 79 to win.
Ranked in order of current polling, these are the current “close” states:
- North Carolina (15 ev): 3.5% Romney lead – 2/5 polls after debate
- Colorado (9 ev): 0.7% Romney lead – 5/5 polls after debate
- Florida (29 ev): 0.2% Obama lead – 4/5 polls after debate
- Nevada (6 ev): 1.6% Obama lead – 5/5 polls after debate
- Ohio (18 ev): 2.2% Obama lead – 5/5 polls after debate
- Virginia (13 ev): 2.2% Obama lead – 5/5 polls after debate
- Iowa (6 ev): 3.2% Obama lead – 1/5 polls after debate
- Wisconsin (10 ev): 3.6% Obama lead – 4/5 polls after debate
- Pennsylvania (20 ev): 4.0% Obama lead – 5/5 polls after debate
- Michigan (16 ev): 4.0% Obama lead – 5/5 polls after debate
That is a lot of “close” states. Before the debate, we were down to just a handful of close states. No more.
Anyway, if Romney pulls those states toward him “evenly” then a move of just over 2.2% more in his direction would get him all the states through Virginia on the list above, which would give him an over all win.
Obama is still ahead. It is worth repeating that. But this race is so much closer than it was before the first debate. And Romney has so many more “paths to victory”. The easiest route is though Florida, Ohio and Virginia. But there are now many more options available as well.
Are we now at a ceiling for Romney though? Has he picked up about all of the “persuadable” votes that he can? Is there really headroom to move higher? If not, then it still isn’t enough. Obama will win.
If the Obama folks screw up more, and the Romney folks effectively capitalize on it though… then maybe Romney ends up with more room to go up further.
The next event expected to have the potential to move numbers is of course the Vice Presidential debate… a few hours from the time I am posting this update. We probably won’t really start seeing any move from that debate in the state polls for a few days, but this is probably one of the last moments we’ll really be able to look at the poll numbers and attribute the motion directly to the first debate. Starting with the VP debate, things get more muddled again, and more factors are at play.
But looking at things right now, it is clear that the debate had a devastating short term effect. It was NOT enough to put Romney in the lead when you look at the electoral college. But it was enough to take what looked like an insurmountable lead for Obama and turn it into a tight race. The big question now is does it stay a close race, or does Obama start to claw back his previous lead. Or… of course the third option… does Romney/Ryan score some more big blows and actually start taking the lead in this race.
Note: Chart and map from the Abulsme.com 2012 Electoral College Prediction page. Both assume Obama vs Romney with no strong third party candidate and show polling as it currently exists. Things will change before election day. On the map red is Romney, blue is Obama, gold states are too close to call. Lines on the chart represent how many more electoral votes a candidate would have than is needed to tie under several different scenarios. Up is good for Obama, Down is good for Romney.


The rate of polling has increased dramatically since the convention ended. It is now not uncommon for my daily sweep for new polls to pick up six or more new polls. In the pre convention days, having three polls on a single day would be a big day. This increase in poll frequency of course makes it likely that we’ll have more days where states flip categories, even if it is just from the natural jittering of random samples rather than real movements. So be sure to watch not just for the states that change on a given day, but also look to see if that change “sticks” as time goes on and new polls come in.
Today we have two states change status. In order by Electoral College weight:

First up Michigan with 16 electoral votes. It has bounced back and forth across the 5% Obama lead line the past few weeks in the five poll average. September started with Obama having an 0.7% lead in the state. September 13th his lead increased to over 5%, but then dropped below 5% again on the 16th. Now on the 19th it heads above 5% again.
The general trend has been toward Obama, but at 5.2% the state is still quite close to the boundary between my categories. So it would be easy for the very next poll to pull the average back below 5%. For the moment, the state moves from my “Lean Obama” category to my “Weak Obama” category, meaning that I no longer consider Romney winning Michigan a possibility strong enough to include in his “best case”.
But don’t be surprised if it gets closer and changes categories again. It looks like it is having fun bouncing back and forth at the moment.

Next up, Indiana with 11 electoral votes. Indiana has been very sparsely polled. Only four Romney/Obama polls in the state since the 2008 election. To round out the five poll average I have to include the 2008 McCain/Obama election results. In any case, prior to the last poll, the five poll average (which then included the 2004 election too) had the state with a 10.1% Romney lead. Shifting the new poll in, and 2004 out… 2004 was a huge 20.7% Bush victory over Kerry in Indiana… makes Romney’s lead drop to 7.2%.
This moves Indiana out of my “Strong Romney” category into my “Weak Romney” category, but make no mistake, Romney’s lead in Indiana is still quite substantial. At the moment nobody is expecting Obama to be able to reprise his 2008 win in the state. We’d need more polls than just the four to discern if there is actually any sort of trend making the state closer, but a little bit closer or not, it still isn’t close enough to be one of the states that could go either way.
This is a Romney state this year unless we get a huge Romney collapse in the next seven weeks.
So only Michigan changes anything in the models, making Romney’s best case slightly weaker, but still a win:
|
Romney |
Obama |
| Romney Best Case |
301 |
237 |
| Current Status |
206 |
332 |
| Obama Best Case |
180 |
358 |
Once again no mathematically “must win” states for Romney, but the paths are still narrow… this is a hard map for Romney. If he doesn’t win Florida, he has to win every other close state to win. If he does win Florida, he can afford a few losses in the close states, but not many. But if he loses Florida, it is hard seeing how he wins the other close states he would need to win.
Romney still needs a game changer to move things in his direction. And I’m pretty sure the events of the last few news cycles are not the kinds of game changers he needs.
Note: Chart and map from the Abulsme.com 2012 Electoral College Prediction page. Both assume Obama vs Romney with no strong third party candidate and show polling as it currently exists. Things will change before election day. On the map red is Romney, blue is Obama, gold states are too close to call. Lines on the chart represent how many more electoral votes a candidate would have than is needed to tie under several different scenarios. Up is good for Obama, Down is good for Romney.
|
|


