This is the website of Abulsme Noibatno Itramne (also known as Sam Minter). Posts here are rare these days. For current stuff, follow me on Mastodon

Categories

Calendar

March 2024
S M T W T F S
 12
3456789
10111213141516
17181920212223
24252627282930
31  

Curmudgeon’s Corner: Into Knots

On this week’s Curmudgeon’s Corner, Ivan and Sam cover all the big items from the last crazy week. They’ve got tariffs and North Korea, but also that Seychelles meeting, Russia maybe vetoing Romney, the Belarusian escort, Nunberg’s meltdown, the poisoned spy in the UK… and there is still more! They didn’t forget Kellyanne Conway, or Stormy, or Trump’s hotel in Panama, or Zinke’s door. A fun packed week for sure!

Click below to listen and subscribe!

CCCover20151125bw


1-Click Subscribe in iTunes
View Podcast in iTunes
View Raw Podcast Feed
Download MP3 File
Follow the podcast on Facebook
patreon-30x30 Support us on Patreon

Show Details:

Recorded 2018-03-09
Length this week – 1:56:47

  • (0:00:15-0:07:51) Intro Stuff
  • (0:08:28-0:36:20) Policy Stuff
  • (0:38:20-1:26:56) Russia Stuff
  • (1:28:23-1:56:26) Other Stuff


The Curmudgeon’s Corner theme music is generously provided by Ray Lynch.

Our intro is “The Oh of Pleasure” (Amazon MP3 link)

Our outro is “Celestial Soda Pop” (Amazon MP3 link)

Both are from the album “Deep Breakfast” (iTunes link)

Please buy his music and support his GoFundMe.

Curmudgeon’s Corner: Annoy People Again

This week on Curmudgeon’s Corner, Sam and Ivan talk about Trump breaking the Romney barrier, the Trump Foundation, Clinton’s basket of deplorables comment, Clinton’s health issues, and the unhelpful way she responds to things. So they pretty much have the Election 2016 developments covered. In the last segment of the show they spend some time going over the new features in Apple’s iOS 10 update. So some tech too this week!

Click below to listen or subscribe… then let us know your own thoughts!

CCCover20151125bw


1-Click Subscribe in iTunes
View Podcast in iTunes
View Raw Podcast Feed
Download MP3 File
Follow the podcast on Facebook
patreon-30x30 Support us on Patreon

Show Details:

Recorded 2016-09-15
Length this week – 1:51:59

  • (0:00:10-0:15:28) But First
    • Agenda
    • Wells Fargo Fine
    • Mom iPhone
    • Another Patron
    • Ivan travels
  • (0:17:28-0:39:33) Election 2016 – Trump
    • Trump breaks the Romney barrier!
    • The New Trump?
    • Trump Foundation
  • (0:42:35-1:16:02) Election 2016 – Clinton
    • Basket of Deplorables
    • Clinton Collapse and Pneumonia
    • Clinton and Secrecy
    • Bad Week for Clinton?
    • What if people stay home?
    • Trump unpredictability
  • (1:16:41-1:51:39) iOS 10
    • Lock Screen
    • Bilingual Support
    • Messages Enhancements
    • Parking Spot
    • Alternate Calling Apps
    • Music
    • Maps
    • Mail
    • Bedtime
    • Photos


The Curmudgeon’s Corner theme music is generously provided by Ray Lynch.

Our intro is “The Oh of Pleasure” (Amazon MP3 link)

Our outro is “Celestial Soda Pop” (Amazon MP3 link)

Both are from the album “Deep Breakfast” (iTunes link)

Please buy his music and support his GoFundMe.

Curmudgeon’s Corner: Something Made A Noise

On this week’s Curmudgeon’s Corner podcast Ivan and Sam start off talking about things OTHER than Election 2016. The upcoming small iPhone announcement, corporate reorgs, Kanye and The Pirate Bay, feedback on the show, and more! But of course then it is election time. They cover the Super Tuesday results in both parties, the Republican delegate math, the possibilities of a Republican schism, and everything else surrounding the race that they can think of.

Click below to listen or subscribe… then let us know your own thoughts!

CCCover20151125bw
Recorded 2016-03-03

Length this week – 1:59:20

1-Click Subscribe in iTunes
View Podcast in iTunes
View Raw Podcast Feed
Download MP3 File
Follow the podcast on Facebook

Show Details:

  • (0:00:10-0:10:30) But First
    • Agenda
    • Small iPhone
    • Mexico City
    • Reorgs
  • (0:11:50-0:42:03) Lightning Round
    • Carillian prelude
    • Apple wins a round
    • Malaysian Plane
    • Kanye and Pirate Bay
    • Nearby House Fire
    • North Korea
    • Syria
    • Feedback
    • Sam’s Vote?
  • (0:43:08-1:28:41) Election 2016 Part 1
    • Democratic Super Tuesday Results
    • Sanders lost, get over it
    • Carson out
    • Christie and Trump
    • Rubio attacking Trump
    • Trump’s Business Success
    • Effect of Rubio’s Attacks?
    • Trump Delegate Math
    • Forcing a contested convention?
    • Delegate Shenanagans
    • Odds of President Trump?
    • Trump’s Policy Details
    • The Mexican Wall
    • Trump and Duke/KKK
  • (1:29:44-1:59:01) Election 2016 Part 2
    • Never Trump Republicans
    • Will the Republicans Split?
    • Is Clinton more conservative than Trump?
    • Trump’s Supporter’s Motivations
    • Immigrant Debate
    • Romney Attacks
    • Trump’s Free Media
    • Buying votes not working
    • The Next Contests

Curmudgeon’s Corner: Push It Out The Window!

In the latest Curmudgeon’s Corner Sam and Ivan talk about:
* Introduction
* Apple WWDC 2015
* Twitter CEO Departure
* Hastert / Election 2016
* Lightning Round

CCCover20141121-bigheads-2
Recorded 2015-06-12

Length this week – 1:32:53

1-Click Subscribe in iTunes
View Podcast in iTunes
View Raw Podcast Feed
Download MP3 File
Follow the podcast on Facebook

Curmudgeon’s Corner: Freaky Man Children

In the latest Curmudgeon’s Corner with Sam and Jenn:
* Universal Time
* Boston Verdict
* Silicon Valley
* Election 2016
* Lightning Round

CCCover20141121-bigheads-2
Recorded 2015-05-21

Length this week – 1:20:10

1-Click Subscribe in iTunes
View Podcast in iTunes
View Raw Podcast Feed
Download MP3 File
Follow the podcast on Facebook

Curmudgeon’s Corner: Only a Facade

In the latest Curmudgeon’s Corner Sam and IvГЎn talk about:
* Ukraine
* ISIS
* Antivaxxers
* Lightning Round

CCCover20141121-bigheads-2
Recorded 2015-02-06

Length this week – 1:11:55

1-Click Subscribe in iTunes
Download MP3 File
View Podcast in iTunes
View Raw XML Feed

Curmudgeon’s Corner: At Least You Have Internet in Texas

In the latest Curmudgeon’s Corner Sam and IvГЎn talk about:
* Sam’s Books / Economy / Bitcoin
* Charlie Hebdo Followup / Media Attention
* Lone or Small Group Terrorism / Violence Trends / Obama Unleashed
* Romney 2016 / Election 2016

CCCover20141121-bigheads-2
Recorded 2015-01-15

Length this week – 1:13:43

1-Click Subscribe in iTunes
Download MP3 File
View Podcast in iTunes
View Raw XML Feed

Electoral College: A Note on Field Changes

There has been polling going on about the 2016 election since the 2012 election. (Actually, earlier, the first state level 2016 matchup poll in my database is from May 2012.) For most of that timeframe, the pollsters have been polling people who they deemed likely to run. Candidates were not for the most part outright declaring their intentions one way or another, and even when they seemed to, sometimes they were not believed.

That is now changing rapidly. While “formal” announcements that candidates are running 100% for sure for realsies may yet be a little further out, we now have candidates being pretty explicit that they are “exploring the possibility” or “considering” or whatnot, and we have a few that are being more and more definitive that they will not be running. Now, many of the people who are looking like they are running may decide not to after all before we get to the Iowa caucuses. And some of the ones saying they won’t run may change their minds. But we are starting to get a much better sense of who is in and who is out.

So, for instance, in the last couple weeks, we’ve had Romney making strong moves indicating he is in, while Ryan has stated that he has decided not to run. So why does the top of my 2016 Electoral College Analysis look like this?

Screen Shot 2015-01-15 at 17.41.57152

Clinton vs Ryan is listed right there, but Clinton vs Romney is not. Why is this? Ryan is not running, shouldn’t he be dropped? Romney looks like he is running, and a number of polls on the Republican nomination show him in the lead at the moment, shouldn’t he be here?

The short answer is that I show the five “best polled” candidate combinations at the top of the page, and there is a lot of polling on Clinton vs Ryan (52 state level polls in my database) while there have been very few so far on Clinton vs Romney (only 4 state level polls in my database).

As pollsters start deciding to poll Clinton vs Romney more, and Clinton vs Ryan less (or not at all), this list of the five best polled combinations will update automatically and Clinton vs Ryan will drop off and Clinton vs Romney will very likely move onto this list. I choose not to hand edit this list by who seems to up or down in the primary polls at the moment, instead, I’ll let the fact that pollsters will show more interest in candidates that seem more likely to win take care of that. But it will take a little time for that to catch up, since actual polls have to be done first.

Of course, I also provide the drop downs, so anybody who wants to see any combination at all can go look. But the top five really are the ones that have decent polling, and beyond that there really isn’t a lot to see.

(Note: Once we actually get to the primaries and caucuses and have actual delegate counts, I will probably keep the five “best polled” list, but instead of defaulting to the best polled combination in terms of what I show on the rest of the page, I’d default to the delegate leaders in both parties… probably. Of course, there is a good chance these will match.)

Now, even for most of you who have already read the above, this is probably enough information. You can consider yourselves done now…

OK… for those few of you (if any) that want more detail and are still here…

I am trying to show the “best polled” combinations, which isn’t necessarily the same as the “most polled”. There are a number of ways one could calculate this, and none are perfect. I chose one way in particular, and it isn’t perfect either, and it certainly has its flaws, but it does the job well enough for these purposes.

Namely, my whole site is based on looking at a “5 poll average” for each candidate pair in each state. In certain cases this can actually include more than 5 polls to break various sorts of ties I care about. But these polls cover a certain amount of time.

For instance, right now if you look at Clinton vs Paul in North Carolina you’ll see that the average currently include five polls, which span the last 5.0 months. (The oldest poll in the average is from August 16th, just about 5 months ago as I’m making this post.)

As a contrast, if you look at Cuomo vs Perry in Vermont you’ll see that it has NEVER been polled, which means I pull in the last five general elections in Vermont as an approximation. That means the oldest data included in the average here is from November 6th 1996, so the average goes back 18.2 years.

States where this timespan is low are better polled than those where it is high. By the time we get to the election in 2016, I expect to see many close states with timespans measured in days.

But, if 2008 and 2012 are guides, some of the less contentious states may not get polled at all, or maybe just have one poll in the whole cycle. After all, everyone knows the Democrat is going to win DC by a huge margin, and the Republican is going to win Nebraska’s 3rd congressional district by a huge margin, and there aren’t that many electoral votes there either, so why bother?

Given that polling is concentrated in close states (and to some degree in big states even if they aren’t particularly close) and close states matter a lot more if you are trying to determine the electoral college outcome, I didn’t want to just average the timeframes of the 50 states (plus DC and 5 congressional districts).

So I decided to do a weighted average of the timeframes, weighted by the inverse of the absolute value of the margin. Since my method doesn’t allow exact ties in the averages, I don’t have to worry about division by zero, although really close states will have a very strong influence on the average.

So, for example, a really close state with a margin of 0.1% would get a weight of 1000, while something like DC (average margin of 80.3% over the last five presidential elections) would only get a weight of about 1.2. Using these weights, I construct an average of the 56 jurisdictions with electoral votes.

There is also the possibility of further weighting this by electoral college strength, I didn’t do that though. Isn’t this already complicated enough to explain?

In any case, from this you get a number from which you can compare how well various candidate pairs have been polled so far. Lets look at this for the top 25 candidate pairs:

Screen Shot 2015-01-15 at 17.41.24639
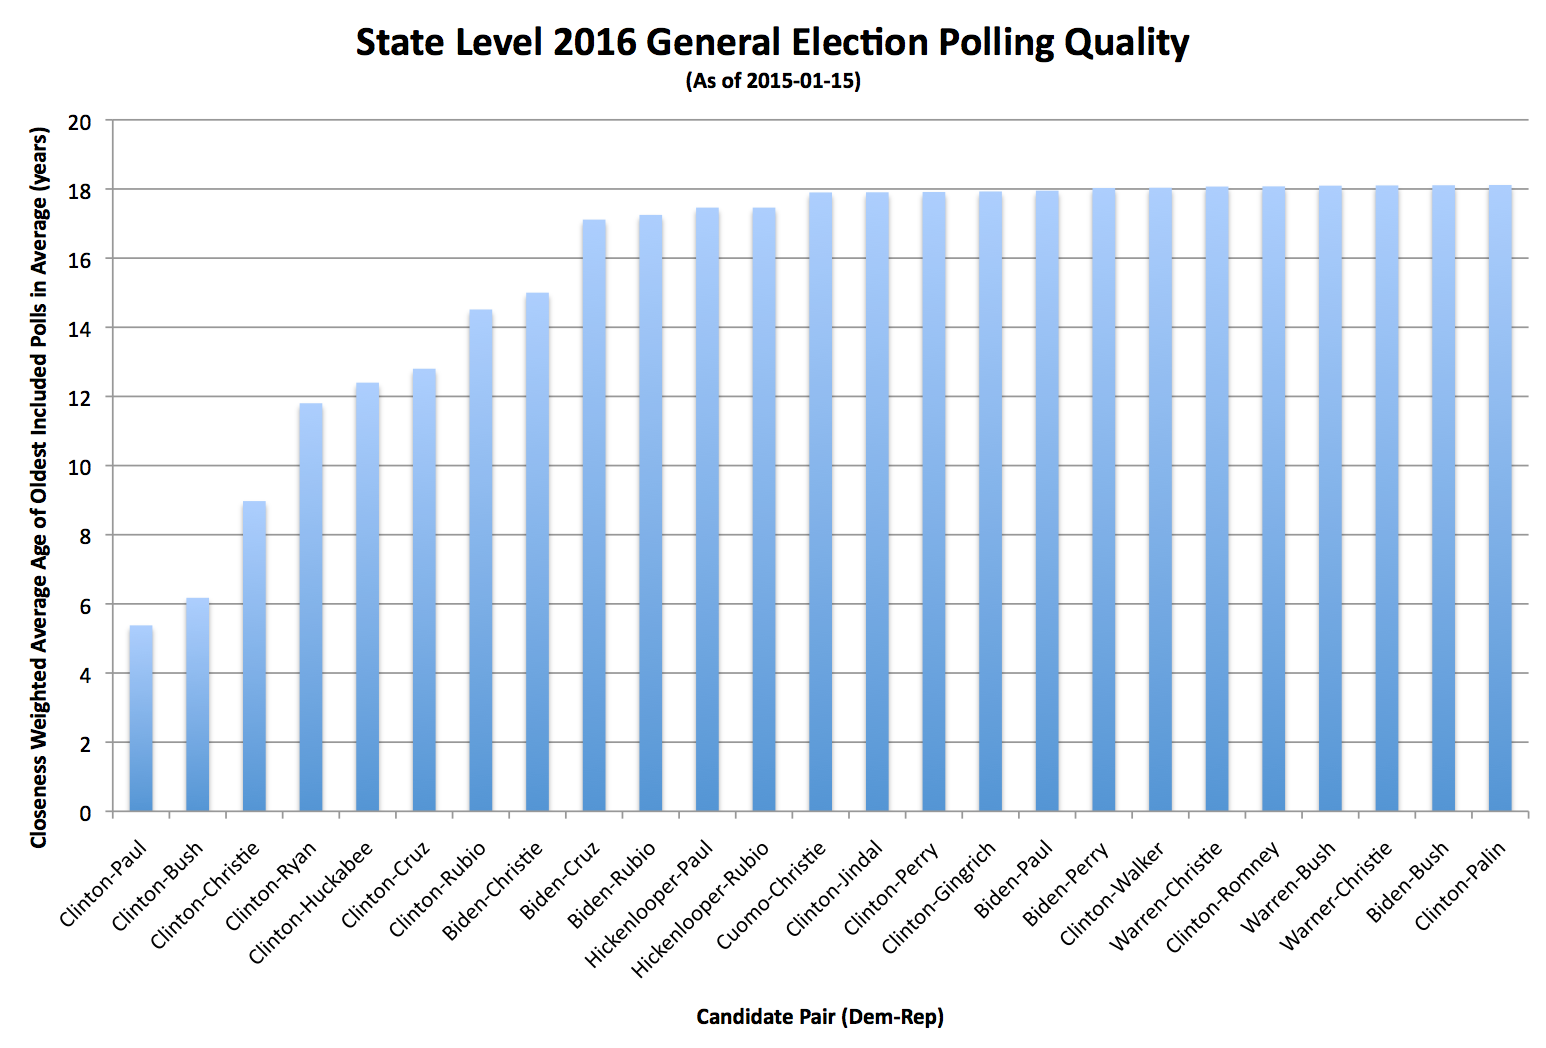
Click through on the image for a bigger version if desired.

The lower this number is, the better polled the combination has been. Candidate combinations that have not been polled at all will show up at 18.2 years at the moment.

You can see that Clinton vs Paul is best polled (5.4 years), with Clinton vs Bush right behind (6.2 years). Then we have a gap until Clinton vs Christie (9.0 years). Then another gap before Clinton vs Ryan (11.8 years), Huckabee (12.4 years) and Cruz (12.8 years). At this point we’re past the top five and you can tell we’re relying quite a lot on old elections and less and less on actual polling of these candidates.

The first non-Clinton combination comes in at #8: Biden vs Christie (15.0 years).

Where is Clinton vs Romney in this? #21. 18.1 years. Just BARELY better than no polling at all.

Hickenlooper vs Rubio has better polling by this metric than Clinton vs Romney. (#11, 17.5 years).

Looking at specific polls, there is only ONE poll for Hickenlooper vs Rubio, but it is in Colorado where the margin is 0.7%. Clinton vs Romney has been polled once each in New Jersey (margin 14.6%), New Hampshire (margin 3.3%), Iowa (margin 2.8%) and Florida (margin 1.1%). While some of those are close, they are less close, so lower weight is given to those.

There are NO states where Clinton vs Romney has a full five poll average (that would of course be impossible with only four polls).

By contrast, Clinton vs Paul has full five poll averages not including any old general election results in New Jersey (Clinton+22.4%), Pennsylvania (Clinton+12.6%), Florida (Clinton+11.3%), Virginia (Clinton+10.6%), Ohio (Clinton+8.8%), Michigan (Clinton+8.6%), New Hampshire (Clinton+6.1%), Iowa (Clinton+5.7%), North Carolina (Clinton+0.2%), Colorado (Paul+2.0%), Kentucky (Paul+4.2%), Kansas (Paul+6.8%) and Alaska (Paul+7.4%).

Bottom line, we can’t say much about a Clinton vs Romney matchup on a state by state level yet, there just hasn’t been enough polling yet. That will probably change rapidly over the next few months if Romney goes all in. And Ryan will fall off. And the “top five” list will otherwise adjust appropriately to changes in the field.

If you do look at Clinton vs Romney you will of course see something. The little polling there is has improved Romney’s “best case” from winning by 24 electoral votes to winning by 44 electoral votes. In this, he does better than any of the Republicans currently in the Top 5 best polled… but it is based on so little data, it is too early to make anything of it at all. You are still basically looking at the last five presidential elections, not any real Clinton vs Romney trend.

This is why I show only the Top 5 as highlighted combinations. Polling quality drops off very quickly, once you get much beyond that, you’re not looking at real data yet. This is also why while all changes will show up in the @ElecCollPolls twitter feed, I’ll only be posting analysis here when something significant changes in the status of one of the top five candidate combinations.

Well, not counting this post. :-) But I wanted to explain why Ryan is showing up, while Romney is not, and why even if we start getting some status changes in states for Clinton vs Romney, I most likely won’t start talking about them much until that combination has enough polls to show up on the top five best polled. Until then, we don’t really have a decent picture of what is going on in this sort of state poll based analysis.

Edit 22:15 to add more links and to change the “Clinton vs Romney has lower quality polling than” example from Hickenlooper vs Paul to Hickenlooper vs Rubio, so I would have an example that didn’t include any candidate showing up in the top five pairings.

Edit 2015-01-17 22:30 to correct Clinton vs Paul results in Colorado. It is Paul+2.0%, not Clinton+2.0% as previously stated.

Curmudgeon’s Corner: It would be perfect if I hadn’t gotten caught!

In the latest Curmudgeon’s Corner Sam and Ivan talk about:
* Kids / Bikes
* No Strategy / ISIS / 2nd terms
* Romney 2016 / Election 2016
* Nude Picture Leak
* Oculus / 3D

Recorded on 4 Sep 2014

Length this week – 1:31:13

1-Click Subscribe in iTunes Download MP3 File
View Podcast in iTunes View Raw XML Feed

A final look back at my 2012 election models

First of all, I promised to report back after the electoral college vote, just to give the real final results, but I didn’t. There were no “faithless electors” this time around, as fun as that always is, so the end result was as expected from election night. Obama 332, Romney 206.

Now on to the analysis of the accuracy (or lack there of) of my five poll averages:

While my analysis predicted 56 of 56 jurisdictions correctly (50 states, DC, ME & NE congressional districts), this is not the whole story. It is worthwhile to also look at the comparison between the final five point averages and the actual popular vote margins in each of these jurisdictions. Here is what you find:

Screen Shot 2013-07-07 at 22.00.54094

There is no clear overall bias toward either Obama or Romney. The overall count gives 25 jurisdictions where my 5 poll average overestimated Obama’s support, and 31 jurisdictions where my 5 poll average overestimated Romney’s support. If anything, on an overall basis then, there is a slight bias in favor of Romney. But that isn’t the real bias here.

Lets look at this again partitioning based on who won.

  • Romney won 27 jurisdictions. Of those, 7 overestimated Romney’s support, while 20 overestimated Obama’s support.
  • Obama won 29 jurisdictions. Of those, 5 overestimated Obama’s support, while 24 overestimated Romney’s support.

So the overwhelming pattern here is that although there are clearly exceptions, in general, the polls overrepresented the support level of the person who lost the state.

In other words, the polls are not biased toward either candidate. The polls are biased toward showing a CLOSER RACE than the actual results.

The trend can been seen even more clearly if you subtract out the actual results, leaving only the deviation or bias:

Screen Shot 2013-07-14 at 21.13.12403

If the polls were very generally right, you would expect a horizontal line very close to zero.

If there was a direct bias for one candidate or another you would expect a horizontal line, above zero for an Obama bias, below zero for a Romney bias.

We see positive to the left and negative to the right though, meaning the bias is generally toward the underdog, whoever that is. (In other words, again, a bias toward a closer race.)

More than that though, the less close the race is, the greater that bias is. It isn’t just that races that are less close are polled less often and so are generally further from the right answer, but rather the bias toward making it closer increases too.

In Hawaii, where it was clear Obama was going to win by very high margins, the polls overestimated Romney by 14.7%! (Polls said Obama would win by 28%, Obama actually won by 43%.)

Similarly, in West Virginia, where it was clear Romney was going to win by very high margins, the polls overestimated Obama by 11.4%! (Polls said Romney would win by 15%, Romney actually won by 27%.)

Those were the two worst states in terms of accuracy of the five poll average. Rounding out the worst five are Alaska (R+9.6%, a big exception to the trend… where there were no polls at all and the 5 poll average was based on the 2004 and 2008 elections), Tennessee (O+9.4%), Kentucky (O+8.2%).

The best five were: Maine-1 (O+0.03%), Texas (R+0.2%), Virginia (R+0.2%), Washington (O+0.4%), Georgia (R+0.4%).

Now, in the end, the degree to which each candidate wins (especially in the states they are way ahead in) doesn’t really matter. We have a winner take all system, so this bias actually makes a lot of sense in terms of how pollsters work. Having the margin wrong doesn’t matter much in these kinds of races, only the winner matters (and the poll averages were all correct on that front). Also of course, close races are more interesting, and people are more likely to commission polls if it looks closer… so the biases all make sense.

But lets take a closer look at the states that were even remotely in contention, where the margins were under 15%. That actually includes a lot of places I wouldn’t really consider “close” but it gives a good number to look at:

Screen Shot 2013-07-14 at 05.31.28514

Now, I had categorized using “Strong Romney”, “Weak Romney”, “Lean Romney”, “Lean Obama”, “Weak Obama”, “Strong Obama”. Lets look at how things stacked up in terms those categorizations… specifically the “lean” states.

You can see from the chart above, that even among the states near the “tipping point” where you would think polling would be most robust, the error is significant. The tipping point is of course on Obama’s side, since he won. But what we see is that of states that the last five poll average identified as “Lean Obama”… that is, Obama ahead, but with a margin under 5%… so close enough you could conceivably think Romney might take it… only TWO actually ended up with margins under 5%. That would be Florida and Virginia.

On the other hand, the five poll average identified each of these states (and one congressional district) as “close”, but in fact it was pretty much an Obama blow out:

5 Poll O-R Actual O-R Bias
Colorado 2.4% 5.5% R+3.0%
Pennsylvania 4.8% 5.4% R+0.6%
New Hampshire 2.8% 5.6% R+2.8%
Iowa 2.0% 5.8% R+3.8%
Nevada 4.8% 6.7% R+1.9%
Maine-2 2.8% 8.6% R+5.8%
Michigan 4.5% 9.5% R+5.0%

There was only one state with the opposite pattern… that is, the five poll average indicated Obama with a healthy safe lead of more than 5%, and the actual results were a win by less than 5%. That would be Ohio. The 5 Poll average had Obama ahead by 5.5%. In actuality he won by only 3.0%

On the Romney side, there were less close places to look at. There were no cases where the five poll average classified something with Romney having a greater than 5% where it ended up being closer than that. There was ONE case where the five poll average showed a close race where it really wasn’t. That would be Nebraska-2, where the five poll average showed only a 3.8% lead. In fact, Romney won Nebraska-2 by 7.2%.

The lesson in all this for 2016? Probably just that “Lead under 5%” isn’t enough to actually think that a state has a real possibility of going either way, that it is really up for grabs. Especially if the form of bias evident here (bias toward the races looking closer than they really are) repeats next time around, which I think is a reasonable assumption.

Some tighter criteria is needed. Maybe just a narrower percentage lead, but maybe also something else. Perhaps an actual history of the lead bouncing back and forth, or the actual current set of polls including results going both way.

Of the five closest states based on actual results (Florida, North Carolina, Ohio, Virginia, Colorado) only Florida had even one of the last five polls indicating the opposite winner (although North Carolina and Colorado had last minute polls showing a tie). Of course five results showing a lead of 0.1% should probably be considered differently than 5 results showing a lead of 4.9%.

The more mathematically proper thing would probably be to take into account the margins of errors on each poll, and come up with an actual probability of the result being on the opposite side than the simple five poll average. There is a place for more complicated models (and I love them!) but part of the point of my analysis is that you can come up with results that are essentially just as good through very simple models with no fancy stuff, just simple averages.

If we went by a rule saying we would only consider a state to be a true toss up if at least one of the last five polls showed a different result, then on election eve 2012, the only Toss-Up state would have been Florida.

I have yet to decide what I will do in 2016, but considering Florida to be the only true toss-up seems closer to the truth than the analysis that put the seven entities in the table above (and NE-2) in the toss-up category.

This analysis is also posted on my Election 2012 Wiki where you can see the original analysis as well.

OK… now to start setting up the 2016 analysis… :-)