This is the website of Abulsme Noibatno Itramne (also known as Sam Minter). Posts here are rare these days. For current stuff, follow me on Mastodon

Categories

Calendar

May 2024
S M T W T F S
 1234
567891011
12131415161718
19202122232425
262728293031  

Electoral College: Michigan Weakens for Obama (plus New Hampshire Correction)

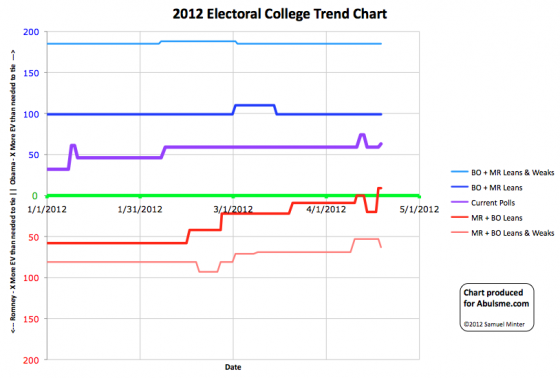
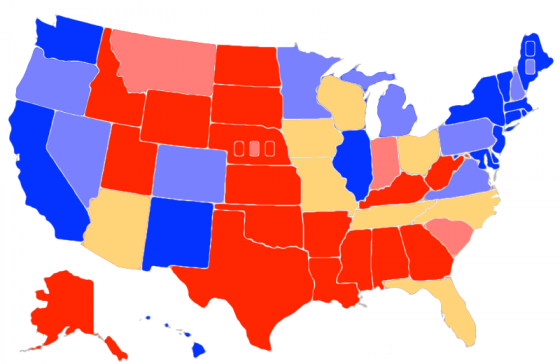
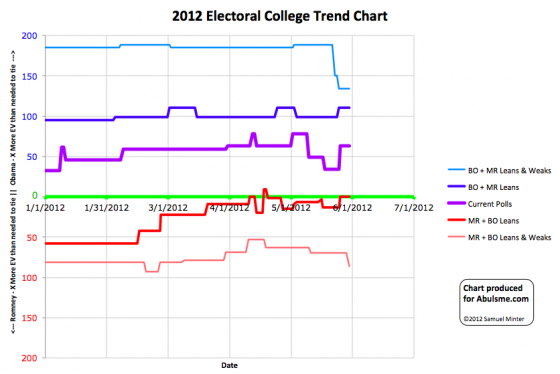
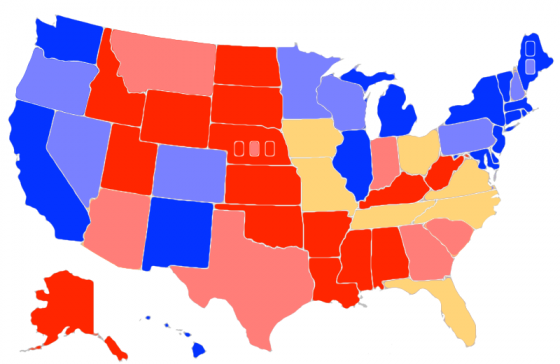
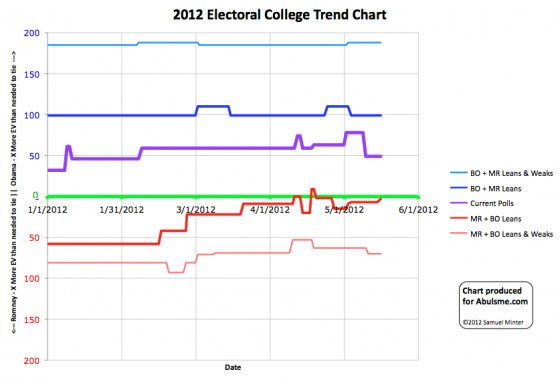
Chart and map from the Abulsme.com 2012 Electoral College Prediction page. Both assume Obama vs Romney with no strong third party candidate. Both show polling as it currently exists. Things will change before election day. On the map red is Romney, blue is Obama, gold states are too close to call. Lines on the chart represent how many more electoral votes a candidate would have than is needed to tie under several different scenarios. Up is good for Obama, Down is good for Romney.

One state changes status today, and it is a move toward Romney:
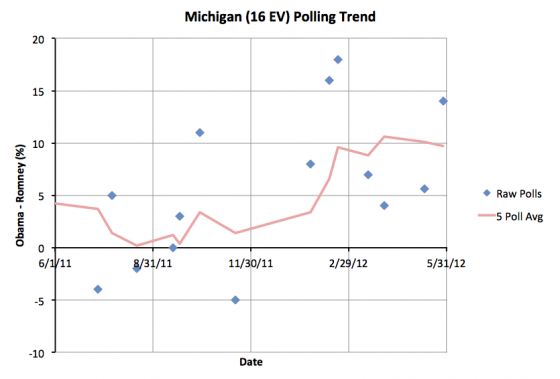
Michigan was in my “Strong Obama” category starting on April 10th. Today the five poll average drops to only a 9.7% lead for Obama, so the state drops to “Weak Obama”. As I’ve described this category many times before, this means that while Obama has a healthy lead, it is not so strong a lead that he can ignore the state. He has to play defense here, otherwise strong efforts from Romney (or big mistakes on his part) could make the state competitive again. As recently as February the five poll averages were such that Michigan was categorized as a swing state. It could go there again.

Since this does not change the inventory of swing states, the summary remains the same:

Romney Obama
Romney Best Case 269 269
Current Status 206 332
Obama Best Case 159 379

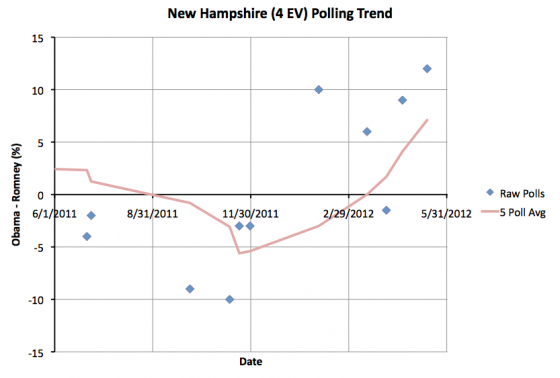
In addition to the change in Michigan today, I have a correction to the historical timeline for New Hampshire. Based on data provided by Darryl from HorsesAss I found a typo in one New Hampshire poll from March, and a few older polls from 2011 that I had missed when booting up these charts in January. The end result is that New Hampshire’s timeline changes slightly.

Prior to today I had this timeline:

  • Jan 1 – Apr 19: Lean Romney (Swing State)
  • Apr 19 – May 16: Lean Obama (Swing State)
  • May 16 – Now: Weak Obama

With the corrections, the timeline should have been:

  • Jan 1 – Feb 4: Weak Romney
  • Feb 4 – Mar 31: Lean Romney (Swing State)
  • Mar 31 – May 16: Lean Obama (Swing State)
  • May 16 – Now: Weak Obama

These changes only effect the historical timeline, the current position remains the same. The chart showing the race over time has been updated with this correction starting with today’s update.
Electoral College: New Hampshire Goes Blue

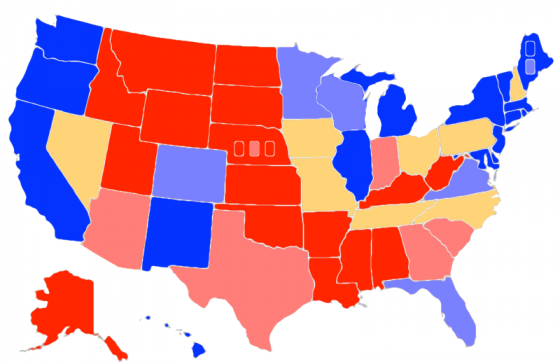
Chart and map from the Abulsme.com 2012 Electoral College Prediction page. Both assume Obama vs Romney with no strong third party candidate. Both show polling as it currently exists. Things will change before election day. On the map red is Romney, blue is Obama, gold states are too close to call. Lines on the chart represent how many more electoral votes a candidate would have than is needed to tie under several different scenarios. Up is good for Obama, Down is good for Romney.

One state changes status today. This time it is a move toward Obama:

The five poll average goes from an Obama lead of 4.1%, which we consider close enough to call the state a swing state, to a 7.1% lead, which we consider large enough to call New Hampshire a “Weak Obama” state. So it gets colored blue for now.

Since New Hampshire is no longer in our swing category, we take the possibility of winning it out of Romney’s Best case. This leaves us with:

Romney Obama
Romney Best Case 272 266
Current Status 220 318
Obama Best Case 170 368

Romney’s new best case has him with just 3 more electoral votes than a 269-269 tie. This leaves his path to victory very narrow indeed. Assuming he retains all of the states he is ahead by more than 5% in, he would then have to still win ALL of the swing states that are currently too close to call. Florida (27), Ohio (18), North Carolina (15), Virginia (13), Tennessee (11), Missouri (10), and Iowa (6) all become must win states. Lose any one of those, and the election is lost.

Of course, there is still plenty of time to pull more states that are currently “Weak Obama” states back into the swing state category. Pull Pennsylvania (20), Minnesota (10) or Wisconsin (10) back from Obama and make them competitive, and all of a sudden there would be a lot more ways to win. Colorado (9), Oregon (7), Nevada (6) or New Hampshire (4) would help too, just not as much. I suppose a play might even be made at Maine’s 2nd Congressional District (1). At the moment though, Obama has healthy leads in those states (and the CD).

Edit 2012 May 20 06:35 UTC – Fixed Map, SC was incorrectly colored as a swing state, it is now correctly colored as “Weak Romney”.

Electoral College: Obama weakens in Wisconsin, New Hampshire Leans Obama

Chart and map from the Abulsme.com 2012 Electoral College Prediction page. Both assume Obama vs Romney with no strong third party candidate. Both show polling as it currently exists. Things will change before election day. Lines on the chart represent how many more electoral votes a candidate would have than is needed to tie under several different scenarios. Up is good for Obama, Down is good for Romney. On the map Red is Romney, Blue is Obama, Gold States are too close to call.

Two changes in our poll classifications today based on new additions to our five poll averages.

First, Obama’s lead in Wisconsin (10 electoral votes) drops to less than 10% bringing Wisconsin into the “Weak Obama” category. Since this is still not a swing state, our “Romney Best Case” scenario still doesn’t include Romney winning Wisconsin. But this does mean that Wisconsin is potentially in play. With the right combination of campaigning and events, Obama’s lead in Wisconsin could drop below 5%, putting it into contention as a swing state. It is not there today… Obama’s lead in the five poll average is still 8.8%… but it is close enough now to be worth spending time and money in the state.

Second, New Hampshire (4 electoral votes) moves from being just barely Romney to being just barely Obama. (Obama’s lead in the five point average is 1.7%, which is negligible and can disappear in an instant.) New Hampshire remains too close to call and therefore one of our swing states. But this does change our “everybody wins the states they are ahead in” scenario.

Romney Obama
Romney Best Case 260 278
Current Status 210 328
Obama Best Case 170 368

Romney’s best case with current polling results remains a loss. And the “current status” improves for Obama because of New Hampshire.

But Wisconsin does show there is some movement in Romney’s direction at the moment. Over the last eight days we’ve seen Obama’s lead in RCP’s National Poll average drop from 5,4% to 1.7%. That is a very significant drop. We’ll see over the next few weeks as more state polls come in whether this starts to translate into electoral college gains as well. The expectation is that as long as the national poll trend is sustained, the state numbers will move correspondingly as soon as we have enough state polls to show it.

Edit 2012 Apr 19 07:10 UTC – Added number of electoral votes for each state mentioned.

Edit 2012 May 30 15:47 UTC – It turns out New Hampshire’s move from Lean Romney to Lean Obama should actually have happened on Mar 31. Details of correction and revised historical chart posted on May 30.

Curmudgeon’s Corner: 2011-2012 Prediction Show, Part 2

In the latest Curmudgeon’s Corner…

Sam and Ivan talk about:

  • Iowa / New Hampshire / South Carolina
  • 2012 Economic Predictions
  • 2012 Tech Predictions and Other Predictions

Just click to listen now:

[wpaudio url=”http://www.abulsme.com/CurmudgeonsCorner/cc20120108.mp3″ text=”Recorded 8 Jan 2012″]

or

1-Click Subscribe in iTunes

View Podcast in iTunes

View XML Feed