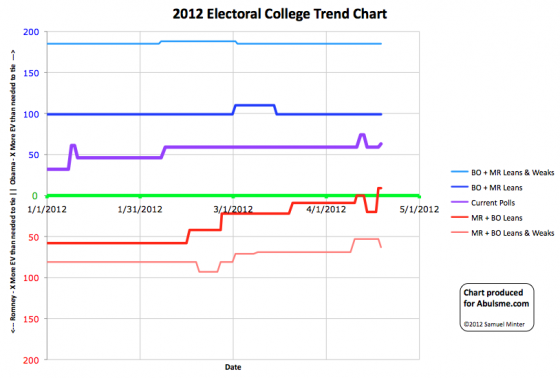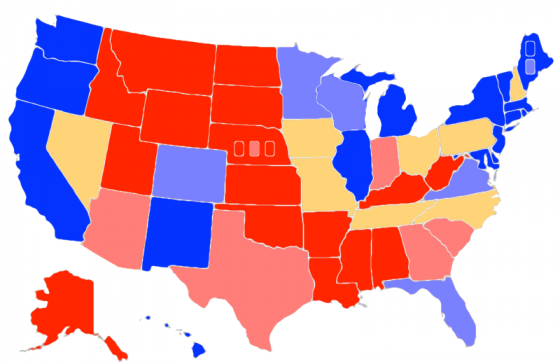

Chart and map from the Abulsme.com 2012 Electoral College Prediction page. Both assume Obama vs Romney with no strong third party candidate. Both show polling as it currently exists. Things will change before election day. Lines on the chart represent how many more electoral votes a candidate would have than is needed to tie under several different scenarios. Up is good for Obama, Down is good for Romney. On the map Red is Romney, Blue is Obama, Gold States are too close to call.
Two changes in our poll classifications today based on new additions to our five poll averages.
First, Obama’s lead in Wisconsin (10 electoral votes) drops to less than 10% bringing Wisconsin into the “Weak Obama” category. Since this is still not a swing state, our “Romney Best Case” scenario still doesn’t include Romney winning Wisconsin. But this does mean that Wisconsin is potentially in play. With the right combination of campaigning and events, Obama’s lead in Wisconsin could drop below 5%, putting it into contention as a swing state. It is not there today… Obama’s lead in the five poll average is still 8.8%… but it is close enough now to be worth spending time and money in the state.
Second, New Hampshire (4 electoral votes) moves from being just barely Romney to being just barely Obama. (Obama’s lead in the five point average is 1.7%, which is negligible and can disappear in an instant.) New Hampshire remains too close to call and therefore one of our swing states. But this does change our “everybody wins the states they are ahead in” scenario.
| Romney | Obama | |
|---|---|---|
| Romney Best Case | 260 | 278 |
| Current Status | 210 | 328 |
| Obama Best Case | 170 | 368 |
Romney’s best case with current polling results remains a loss. And the “current status” improves for Obama because of New Hampshire.
But Wisconsin does show there is some movement in Romney’s direction at the moment. Over the last eight days we’ve seen Obama’s lead in RCP’s National Poll average drop from 5,4% to 1.7%. That is a very significant drop. We’ll see over the next few weeks as more state polls come in whether this starts to translate into electoral college gains as well. The expectation is that as long as the national poll trend is sustained, the state numbers will move correspondingly as soon as we have enough state polls to show it.
Edit 2012 Apr 19 07:10 UTC – Added number of electoral votes for each state mentioned.
Edit 2012 May 30 15:47 UTC – It turns out New Hampshire’s move from Lean Romney to Lean Obama should actually have happened on Mar 31. Details of correction and revised historical chart posted on May 30.
What is going on? Missouri polls show Obama far behind in a state he lost in 2008. Tennessee a swing state? It should be solidly red. South Carolina leaning Republican? Should be solid red. Texas only leaning Romney?
This map is useless.
You picked a few states to highlight where polling has been pretty sparse so far. Polls are much more frequent in some other states. But the classifications are solidly backed up by the few polls that have actually been done so far.
Because polling is still sparse in those states, and the most recent poll may even be months old, the numbers do indicate averages over many months in these states, so they won’t have picked up yet on recent changes. As polling frequency increases as we approach November, this methodology will pick up on changes faster and faster. By November response time in most states that are even remotely in contention will be in days. (Meanwhile, small places that are very strongly one party or the other, like DC or Wyoming for instance, will be lucky to even see two or three polls between now and November.)
If you haven’t clicked through to the wiki where all the details of my classifications are, it is important to note that the for purposes of this map, the dark colored states are where the person in the lead is ahead by greater than 10% in the average of the last five polls in that state. I call those “Strong” states. Lighter colors indicate a lead of between 5% and 10%. I call those “Weak” states. (This is how I would classify Texas and South Carolina, not “Leaning”, which I reserve for the next category.) The “too close to call” states are where the lead is less than 5%. I call those “Lean”.
In my model I give the “best cases” for each candidate by giving them all of the swing states on the grounds that any lead under 5% can be gone in a day or two given the right conditions. The “Weak” states aren’t included in those scenarios as it is considered that the lead of the candidate there is strong enough it won’t disappear over night. However it should be considered that states in this “weak” category can be converted into swing states by the events of the campaign, so are worth both campaigns spending time and money on. (By contrast, the darkly colored “Strong” states can probably be effectively ignored by both sides.)
Looking specifically at the polling in the four states you mention:
Missouri
————
2011 May 1 – Romney +2
2011 Sep 12 – Romney +4
2011 Nov 6 – Romney +3
2012 Jan 29 – Tie
2012 Mar 15 – Romney +9
5 Poll Average = Romney +3.6 (Lean Romney Swing State)
(That was as of yesterday’s update… there is actually a new Missouri poll just out that shows Romney +3, which will make the 5 poll aveage Romney +3.8 but not change the status of the state as a Lean Romney Swing State.)
Tennessee
—————
2011 Feb 13 – Romney +7
2011 Jun 8 – Obama +2
2011 Nov 5 – Romney +4
2012 Feb 22 – Romney +3
2012 Feb 25 – Romney +6
5 Poll Average = Romney +3.6 (Lean Romney Swing State)
South Carolina
——————–
2011 Jun 5 – Romney +9
2011 Aug 28 – Romney +15
2011 Oct 12 – Romney +6
2011 Dec 6 – Obama +3
2012 Jan 13 – Romney +6
5 Poll Average = Romney +6.6 (Weak Romney)
Texas
———
2011 Jan 16 – Romney +7
2011 Jun 27 – Romney +8
2011 Oct 26 – Romney +2
2012 Jan 15 – Romney +7
2012 Feb 15 – Romney +13
5 Poll Average = Romney +7.4 (Weak Romney)
As you can see, some of those 5 poll averages go back a LONG time. I would very much like there to be more frequent and more recent polls in these sorts of states. There just aren’t yet. Now that we are in general election mode, there will be more and more polls in a wider variety of states and we’ll get a clearer and clearer picture. But for the moment, these are the polls we have, so that’s the only choice we have when trying to get a polling picture of a state.
(I have considered at times recency weighting the polls, but in general it wouldn’t make a huge difference.)