This is the website of Abulsme Noibatno Itramne (also known as Sam Minter).
Posts here are rare these days. For current stuff, follow me on Mastodon
|
States with new poll data added since the last update: All 50 states, plus the Maine congressional districts. Notable changes caused by Colorado, Florida, Missouri, New Hampshire, Maine (CD2), and South Carolina.
There were a ton of changes with this batch of new polls. Four of the changes favored Trump, two favored Clinton. We’ll look at each of these in order. The “good for Trump” states first, then the “good for Clinton” states, then we’ll review the net national changes due to all of these together.
Good for Trump
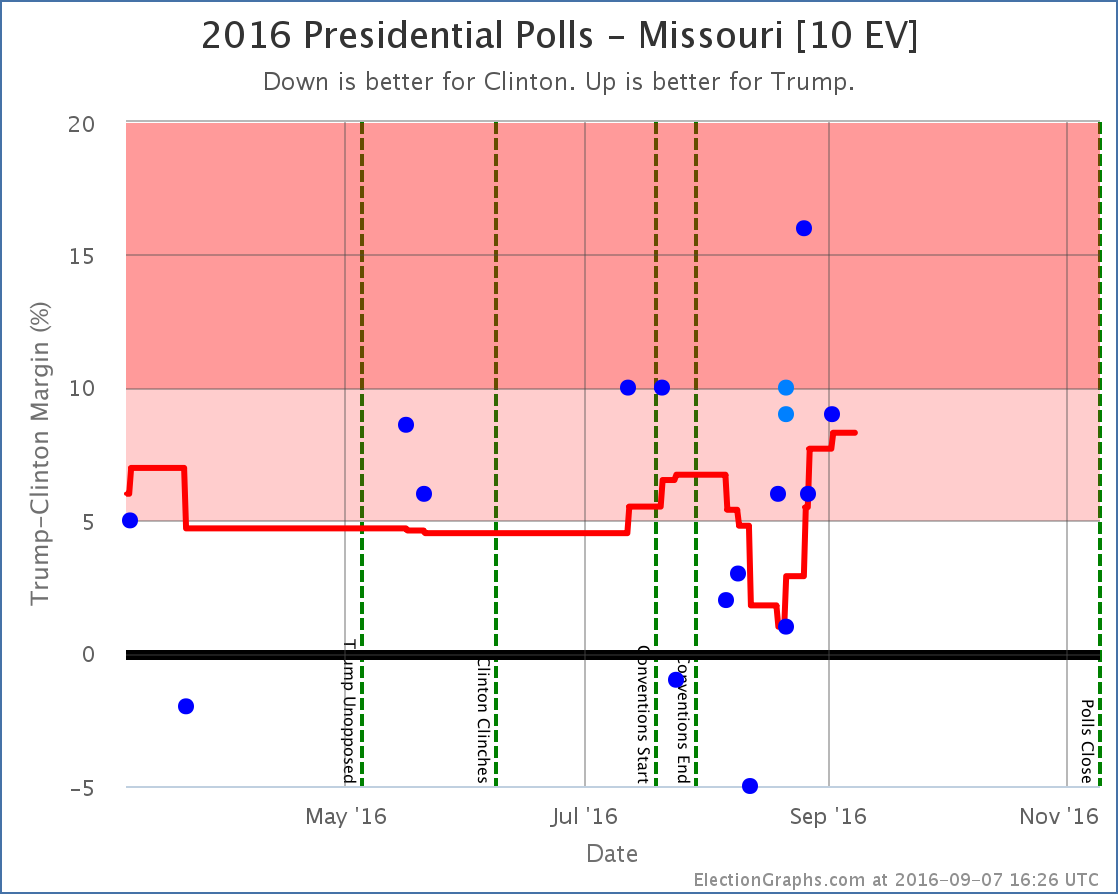
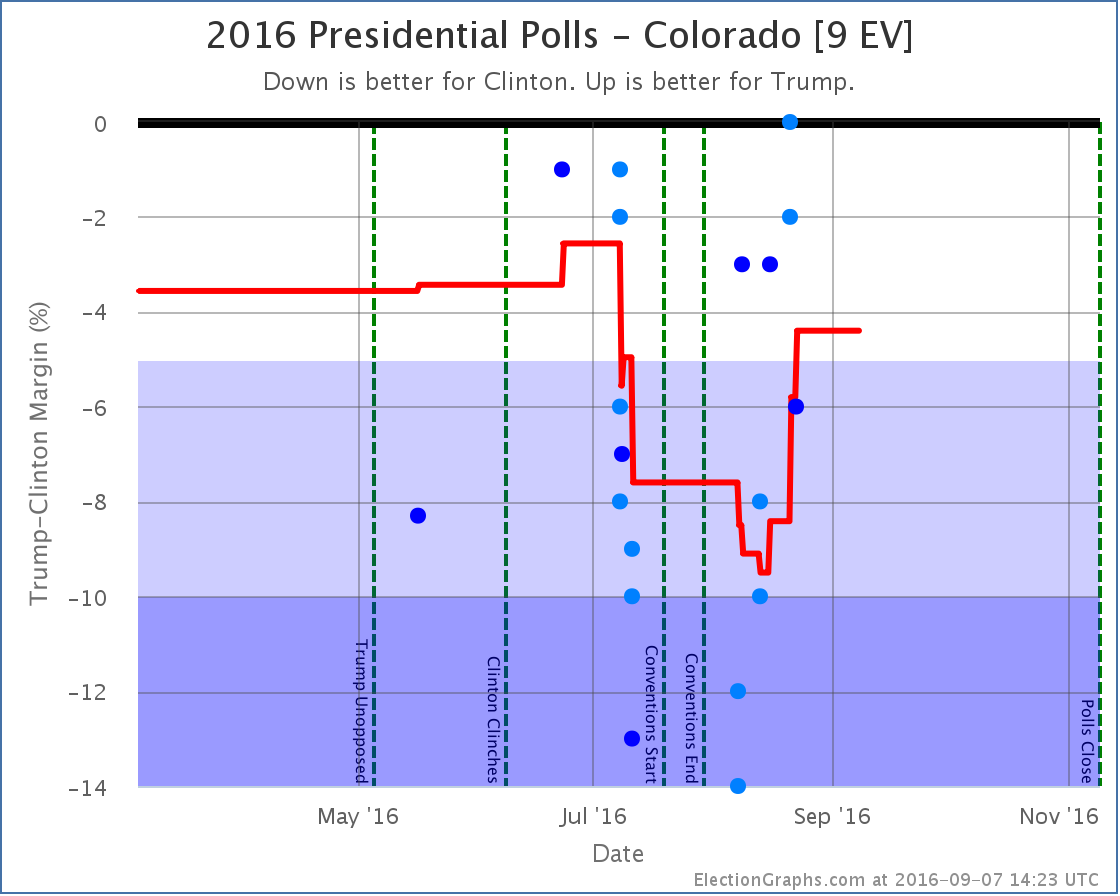
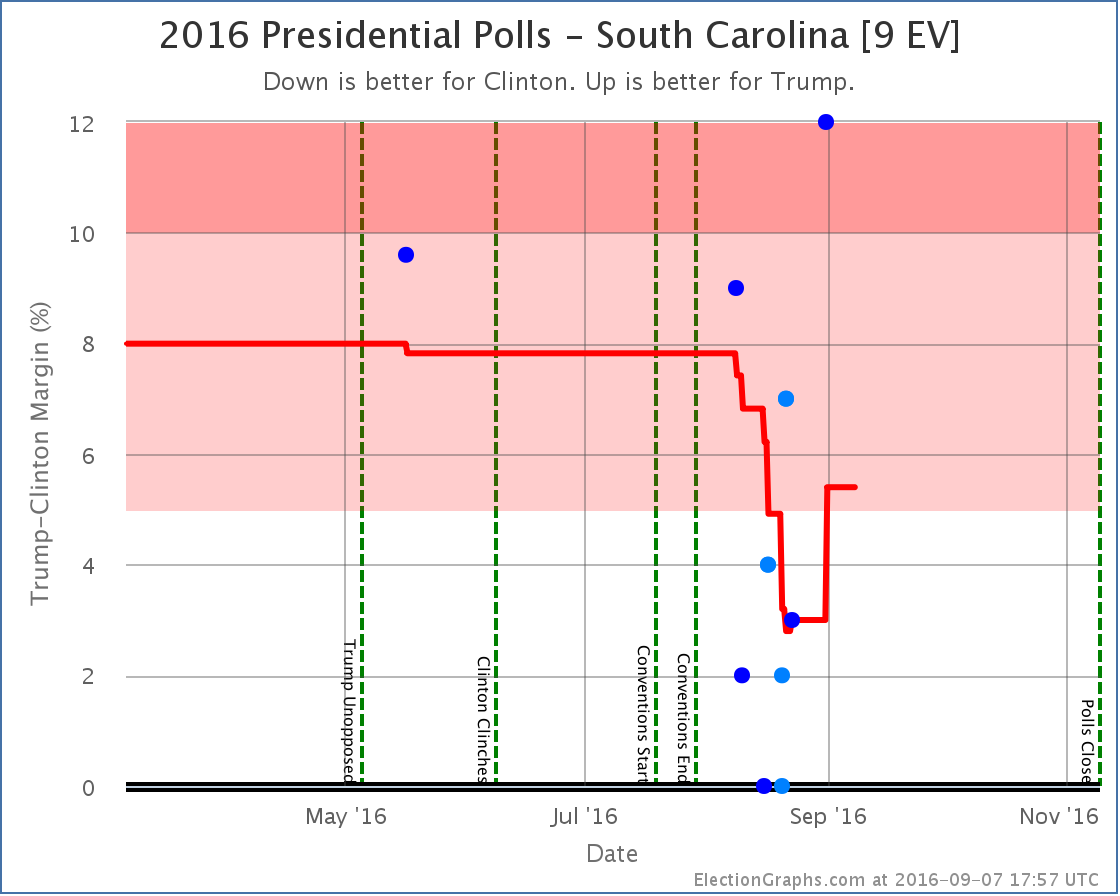
Missouri, Colorado and South Carolina all show the same general pattern… a Trump decline bottoming out in mid-August, followed by a Trump recovery. The specifics of the patterns are slightly different, but the dip followed by a rebound looks clear. (Although the rebound in South Carolina may turn out to be due to an outlier.)
Missouri and South Carolina had looked like states where Clinton was making it close, Trump now pulls them out of reach again. Meanwhile Clinton’s lead in Colorado looked like it was not at risk for her, but the last few polls show Trump making it close again.
So winning Missouri and South Carolina are no longer part of Clinton’s best case, while the possibility of winning Colorado is now included in Trump’s best case.
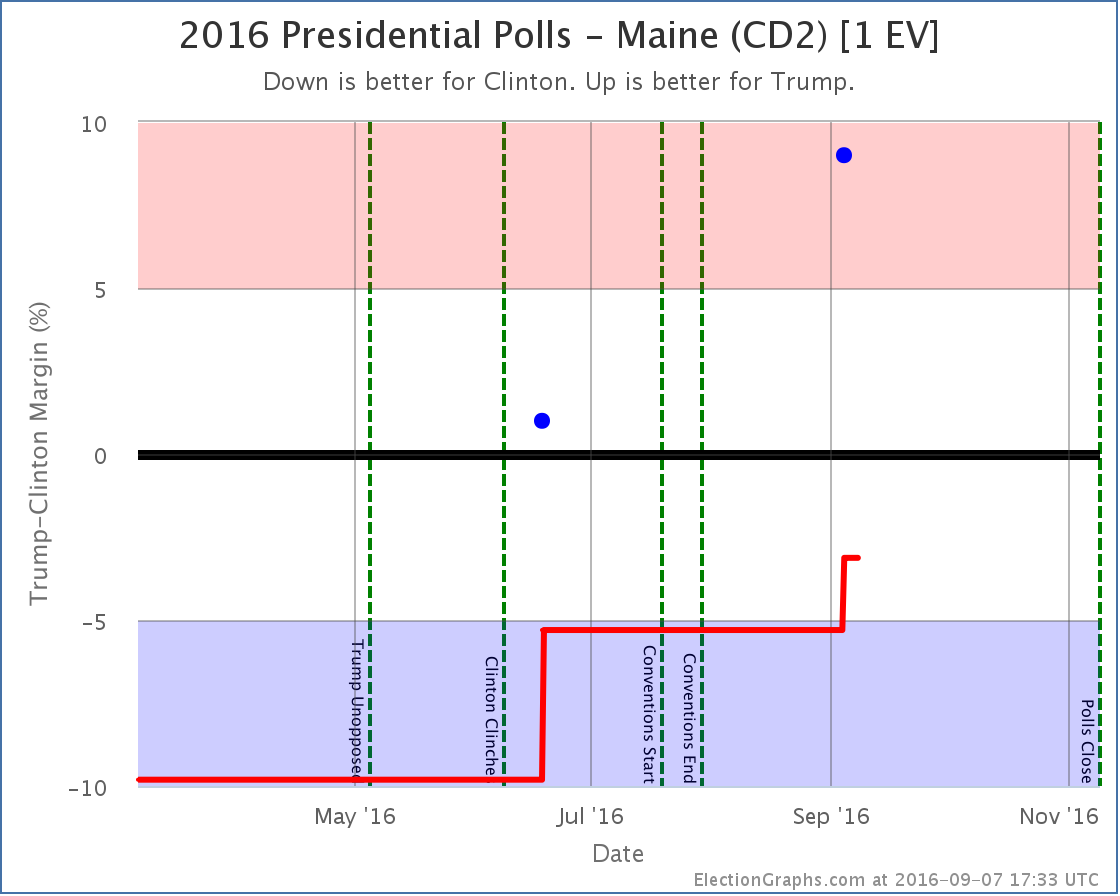
Maine and Nebraska are the only two states that can split their electoral votes. So far Nebraska has not been polled at all at the congressional district level. This week brings only the second time the Maine congressional districts have been. In both cases, the overall numbers for the states have moved toward the center line past all of the congressional districts. Mathematically, the state as a whole can’t be closer than all the parts making up the state, so we know this is wrong, but without congressional district polling, we can’t tell where the congressional districts should be.
In Maine, with the new CD2 polling result, we now have two polls showing Trump ahead. These are the only two polls. The average is filled out with the Maine CD2 results from 2004, 2008, and 2012. Given the strong Democratic wins in CD2 in those years, the two polls from this year aren’t quite enough for the poll average to flip the district to Trump, but the average now only has Clinton up by 3.1%, so we now consider Maine’s 2nd District to be a possible pick up for Trump.
Even with this new poll, Maine-CD2 is what I consider to currently be the “most needed poll” (followed by NE-CD2, NE-CD1, SD, and ME-CD1). Please pollsters! More congressional district level coverage of both Maine and Nebraska! They both look like they have a possibility of splitting this cycle. We need more polling to understand just how likely (or not) that possibility actually is!
Good for Clinton
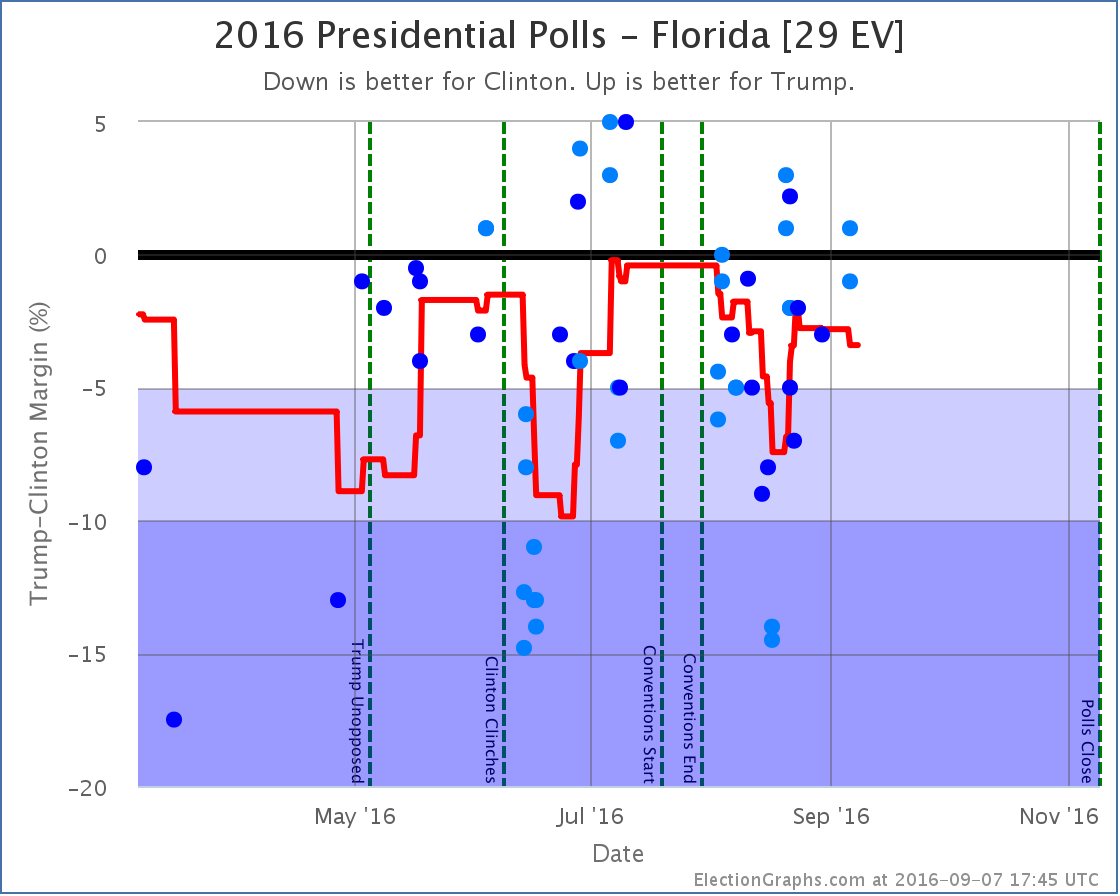
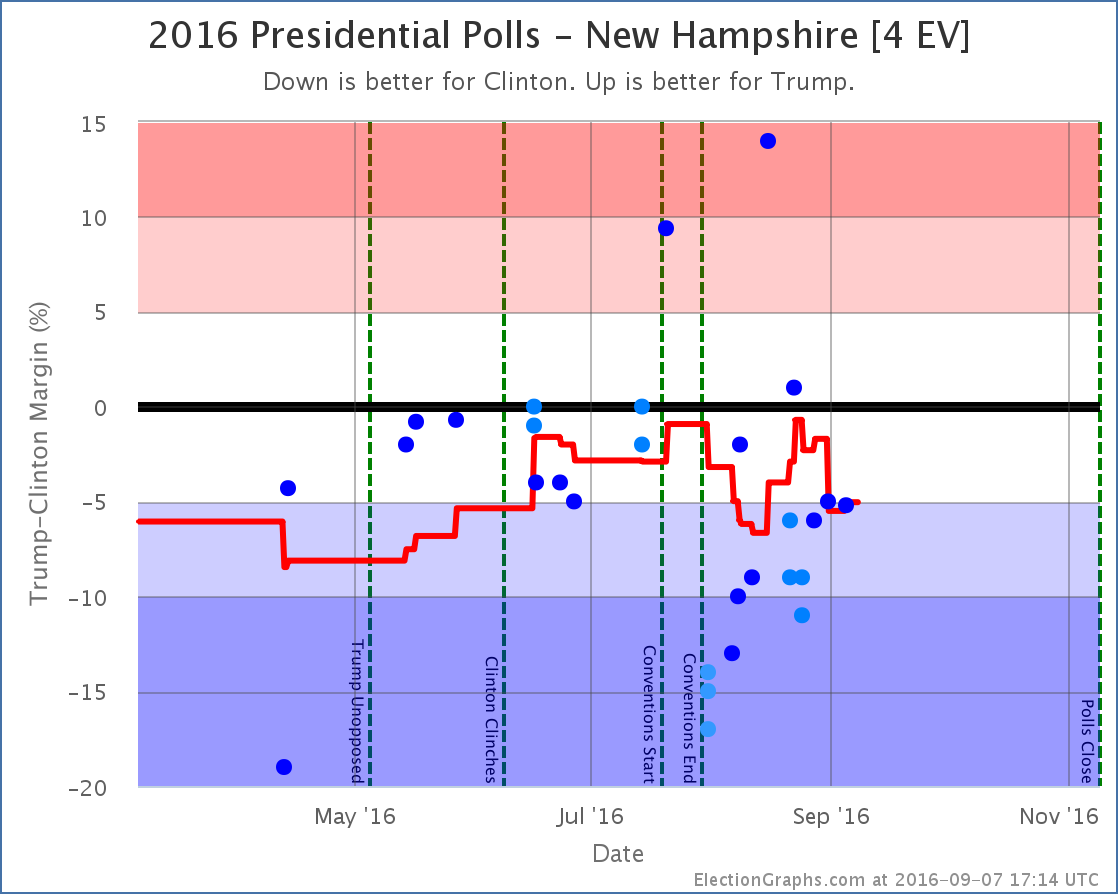
Both Florida and New Hampshire show the typical pattern of the Trump collapse followed by a Trump recovery. But in these two states, Trump peaked and is starting to drop again.
Florida does not change categories, but the change there changes the national tipping point.
In New Hampshire, the average just barely passes our 5% threshold to put the state back in the “Strong Clinton” category, which removes New Hampshire from Trump’s best case. It is right on the line though. Clinton’s lead still rounds to 5.0%. The next poll could easily move this back into “Weak Clinton”.
National View
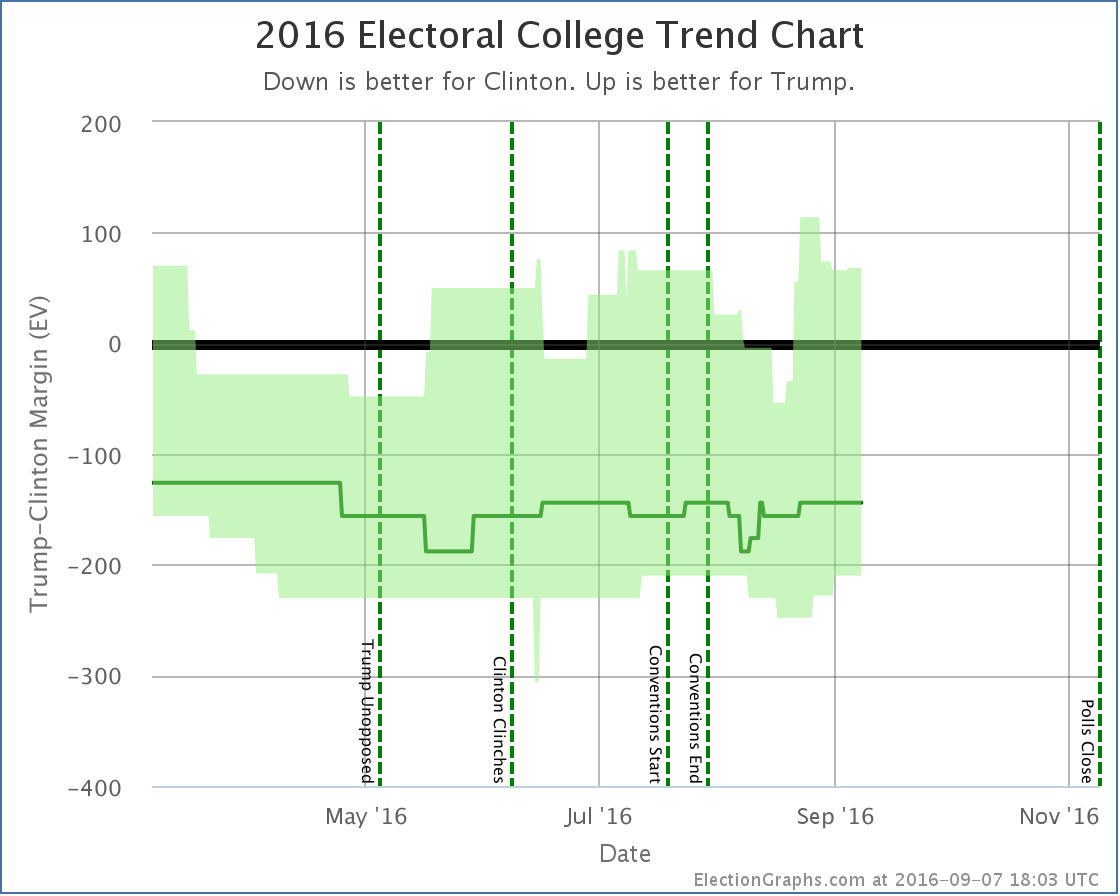
The change from today’s update to Trump’s best case is to move from winning by 56 electoral votes to winning by 66 electoral votes. So net improvement today.
But note the downward trend after August 27th. Even though today’s update was better for Trump, raising the level of the whole graph over the last week or so on the basis of some polls with older midpoints, it does look like his best case may have peaked and is receding a bit now.
Clinton’s best case is receding as well though. It drops in this update from winning by 248 electoral votes to only winning by 210 electoral votes.
And the center line has not shifted. We’re talking about changes in which states are close, not in who is leading where.
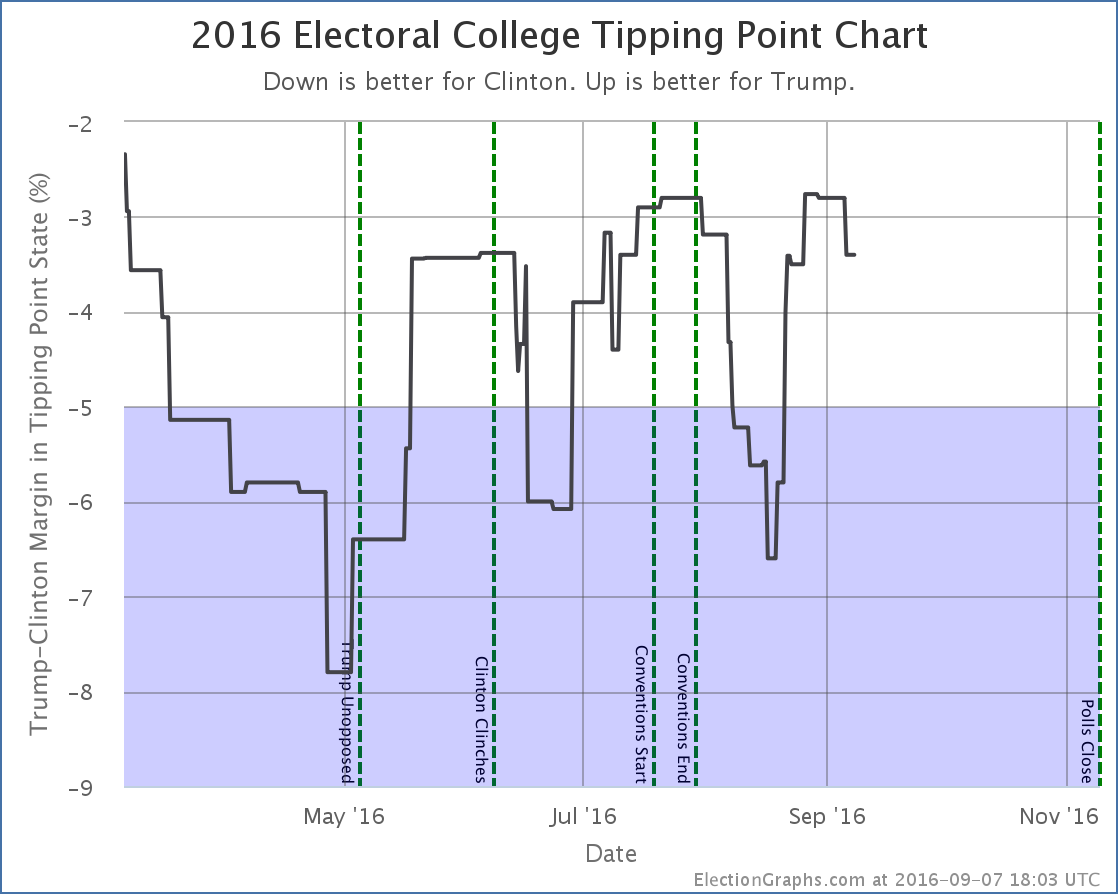
Today’s update moves the tipping point from Clinton by 3.0% in Florida to Clinton by 3.4% in Florida, but you can see that the tipping point peaked a little over a week ago and has been moving toward Clinton, similarly to how Trump’s best case has been moving.
So has Trump really already passed another peak? Is he on a downswing again? Or is this all just reversion to the mean on a race that really is pretty stable? Or does Clinton weakening in the red states she had hoped to pick up mean Trump still has some momentum left?
Stay tuned.
62.1 days until real election results start to come in.
Note: This post is an update based on the data on ElectionGraphs.com. Election Graphs tracks both a poll based estimate of the Electoral College and a numbers based look at the Delegate Races. All of the charts and graphs seen in this post are from that site. Additional graphs, charts and raw data can be found there. Follow @ElectionGraphs on Twitter or like Election Graphs on Facebook to see announcements of updates or to join the conversation. For those interested in individual general election poll updates, follow @ElecCollPolls on Twitter for all the polls as they are added. If you find the information in these posts interesting or useful, please consider visiting the tip jar.
States with new poll data since the last update: Ohio, Iowa, South Carolina, North Carolina, Virginia, Utah, Missouri, Florida, New Mexico
More bad news for Trump, this time from Florida and South Carolina:
Florida
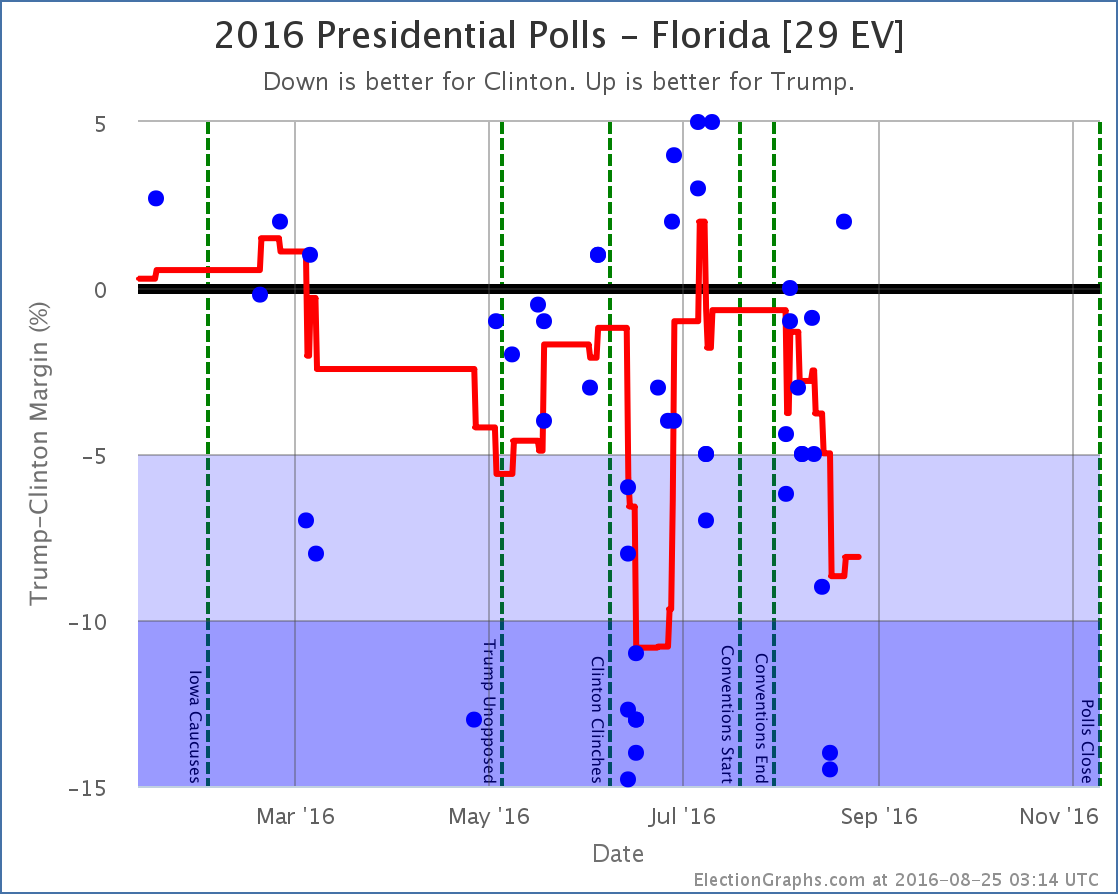
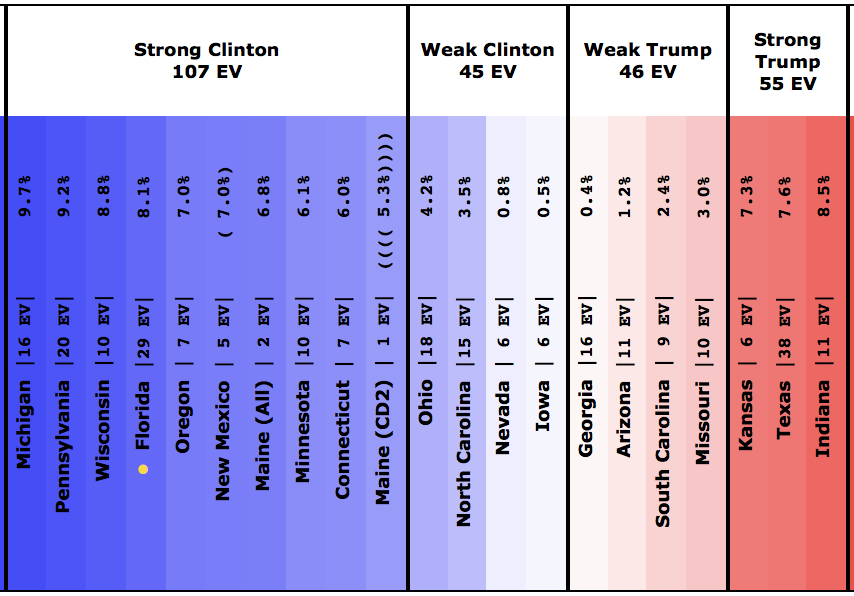
As has been somewhat the normal state of things in Florida, there is a huge range of poll results. At the moment the Election Graphs average includes results from Clinton leading by 14.5% to Trump leading by 2%. But on average, the polls have been trending toward Clinton, and with the latest additions, Clinton’s lead increases to 8.1%. Now, a couple of the data points here look like they might end up being outliers. If so, expect the average to bounce back a bit in Trump’s direction as new polls come out.
For the moment though, Clinton’s lead is big enough that Florida is no longer looking like a possible pickup for Trump. And Florida is part of almost any winning scenario for Trump. Without Florida a path to the White House is almost impossible.
South Carolina
Meanwhile, Trump is also slipping in South Carolina:
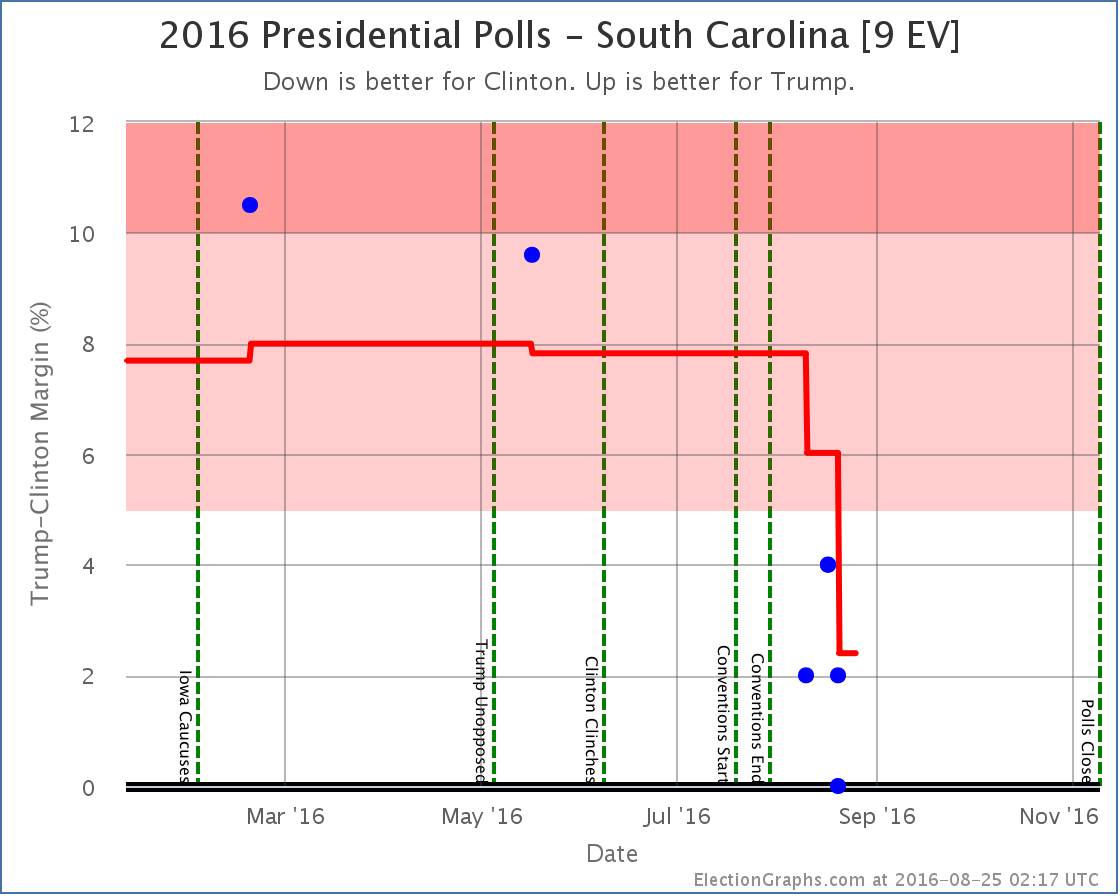
South Carolina hadn’t been polled much, but prior to the conventions the average there was a 7.8% Trump lead. Every poll since the conventions has shown Trump with a much narrower lead though. To be sure, there has not yet been any poll showing Clinton ahead in South Carolina. But the poll average drops to a 2.4% Trump lead. Narrow enough that Clinton stealing it has to be allowed as a possibility.
National View
With Florida no longer in play for Trump, and South Carolina now in play for Clinton, the “bubble” now looks like this:
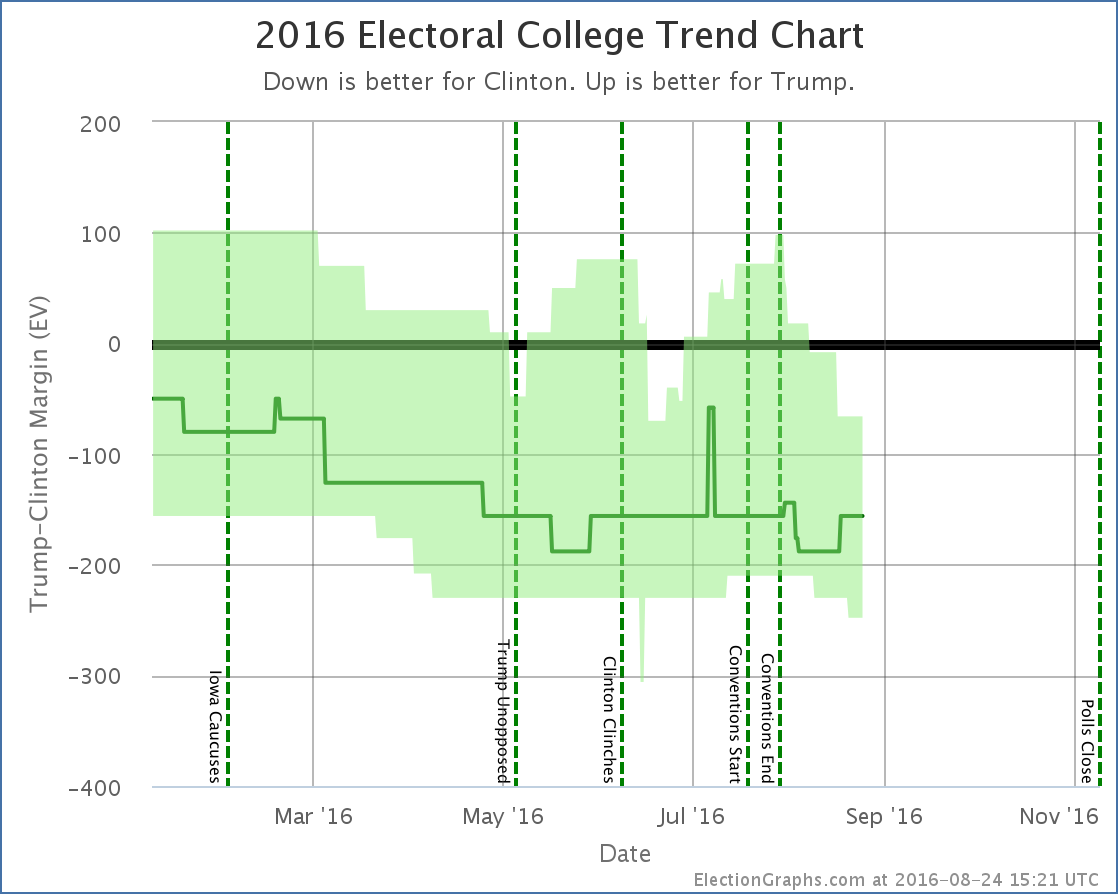
Trump’s best case is now almost as bad as it was back in June. Clinton’s best case is now the best it has been aside from those two days in June when Texas looked close.
The most dramatic change however has been in the tipping point. With Clinton’s lead in Florida increasing dramatically, the tipping point moved from a 6.0% Clinton lead in Connecticut to an 8.1% Clinton lead in Florida:
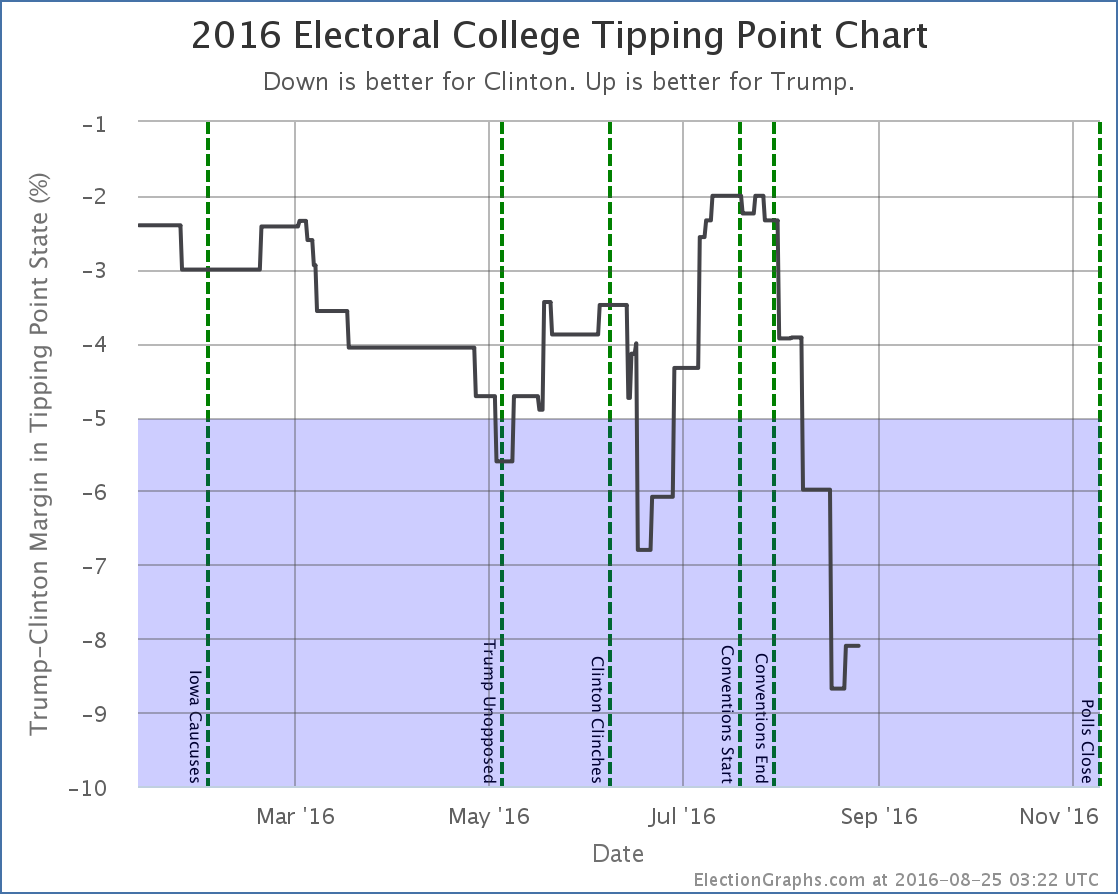
There were actually two Florida polls in today’s update, the second one was more favorable to Trump, so you see above that the tipping point actually dipped down as far as a 8.7% Clinton lead before bouncing back to 8.1%.
The tipping point can be thought of as how much the polls in every state would have to move (if they all moved together) to flip the winner of the race. It is essentially the equivalent of looking at the national popular vote margin, but adjusted to take into account the structure of the electoral college. The downward trend here is brutal for Trump.
The center of the spectrum of states now looks like this:
And the overall summary like this:
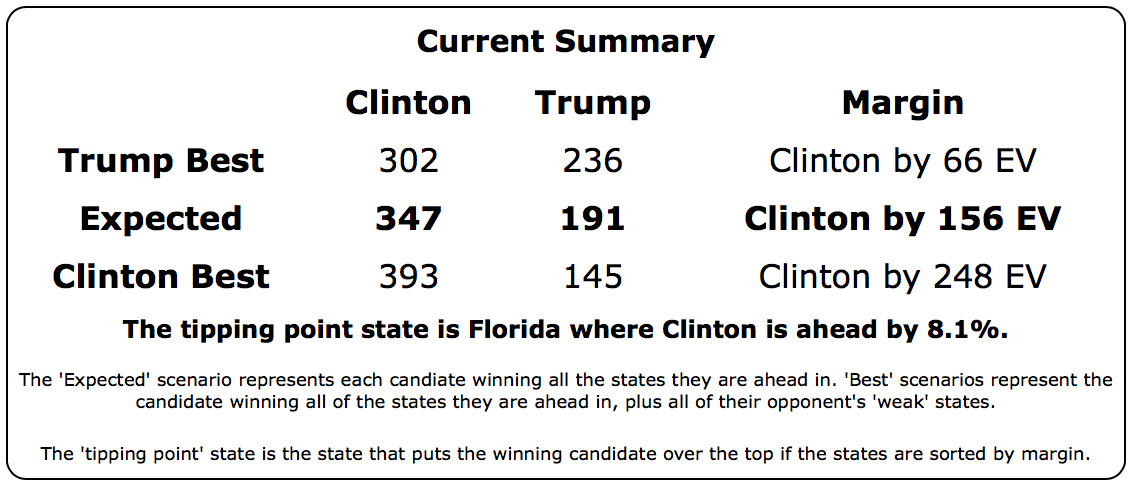
Even if you give Trump all of the close states, he still loses by 66 electoral votes.
Trump is currently losing, and losing badly. Even if he managed movement along the lines of what he saw from mid-June until the conventions, it would only get him back to having a narrow win in his best case scenario. He would still have quite some way to go in order to actually lead.
Things do happen in campaigns, but a comeback from this far behind would take an absolutely seismic change in how this campaign is going… and there are only 75.7 days left.
Notice on Methodology: In my August 13th update I solicited opinions on possibly changing how this site deals with the case when a pollster releases multiple results from a single poll. See the discussion in that comment thread for more details. I’ve concluded that I do want to make a change to re-weight those cases, so that if two results are released from a poll, each counts as only half a poll for purposes of the averages here. I am going to try to adjust the site this coming weekend to make this change. Although the overall picture will remain similar, some states will “jiggle”. For instance, with the current method the average in South Carolina is a 2.4% Trump lead. The drop to that level was one of the items highlighted in today’s post. But the five poll average includes 2 results from a Feldman poll and 2 from a Gravis poll. If the average was calculated in the proposed new way South Carolina would show a 5.4% Trump lead. So it would move back to being “Strong Trump” rather than “Weak Trump” because there would be less weight on the post-convention polls showing a close race, and two additional older polls showing a strong Trump lead would be included in the average. If all goes well, I’ll make a post about the new methodology and any resulting changes to the classifications of the states and such after the surgery on the site is complete. If my changes fail, I’ll roll things back and try again another weekend. :-)
Note: This post is an update based on the data on ElectionGraphs.com. Election Graphs tracks both a poll based estimate of the Electoral College and a numbers based look at the Delegate Races. All of the charts and graphs seen in this post are from that site. Additional graphs, charts and raw data can be found there. Follow @ElectionGraphs on Twitter or like Election Graphs on Facebook to see announcements of updates or to join the conversation. For those interested in individual general election poll updates, follow @ElecCollPolls on Twitter for all the polls as they are added. If you find the information in these posts interesting or useful, please consider visiting the tip jar.
As expected, Clinton easily won South Carolina. Clinton won 39 delegates, Sanders got 14.
Since my last post on the Democrats the tally has also added a net 10 superdelegates for Clinton, 1 for Sanders, and 1 straggler for O’Malley.
As of that last post, Sanders needed to get more than 55.03% of delegates to be on track to catch up with Clinton and win. Obviously that hasn’t happened with these updates. He got 23.08% of the delegates since that post.
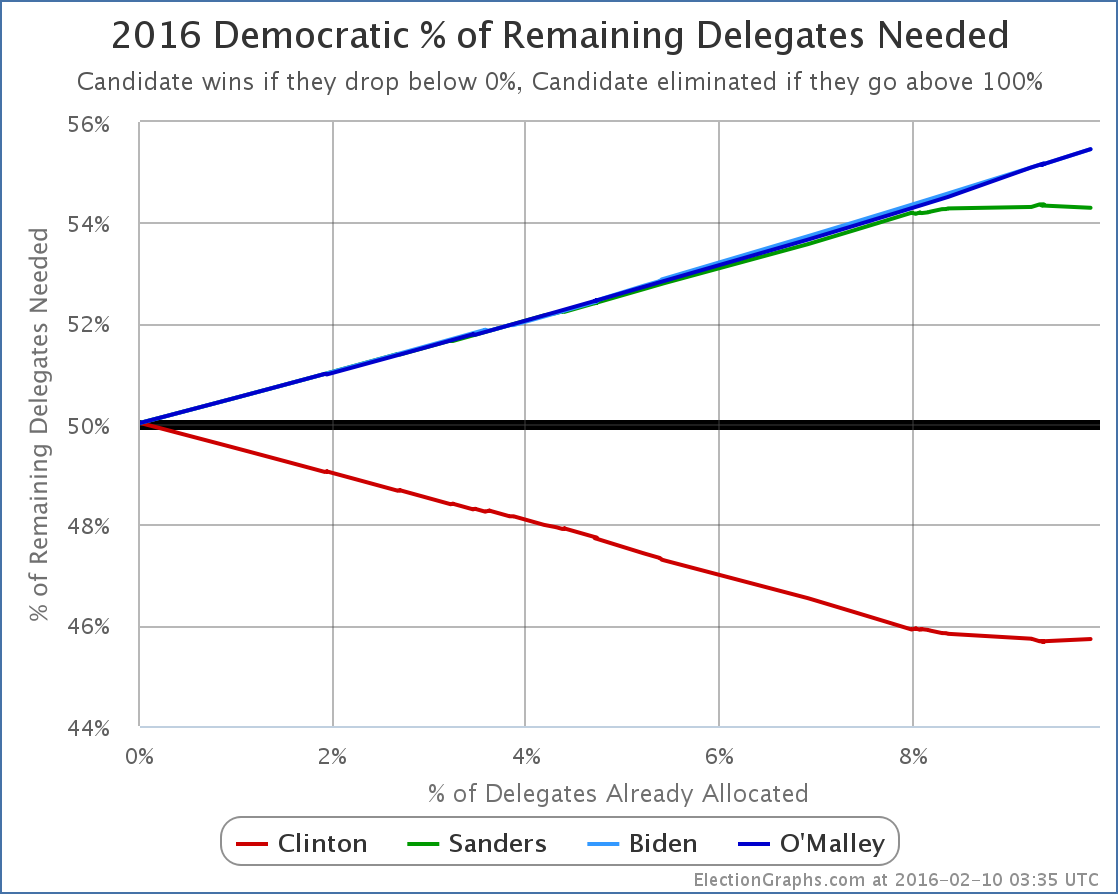
So the end result is that the percentage of the remaining delegates Sanders needs to win goes up, while that number for Clinton goes down:
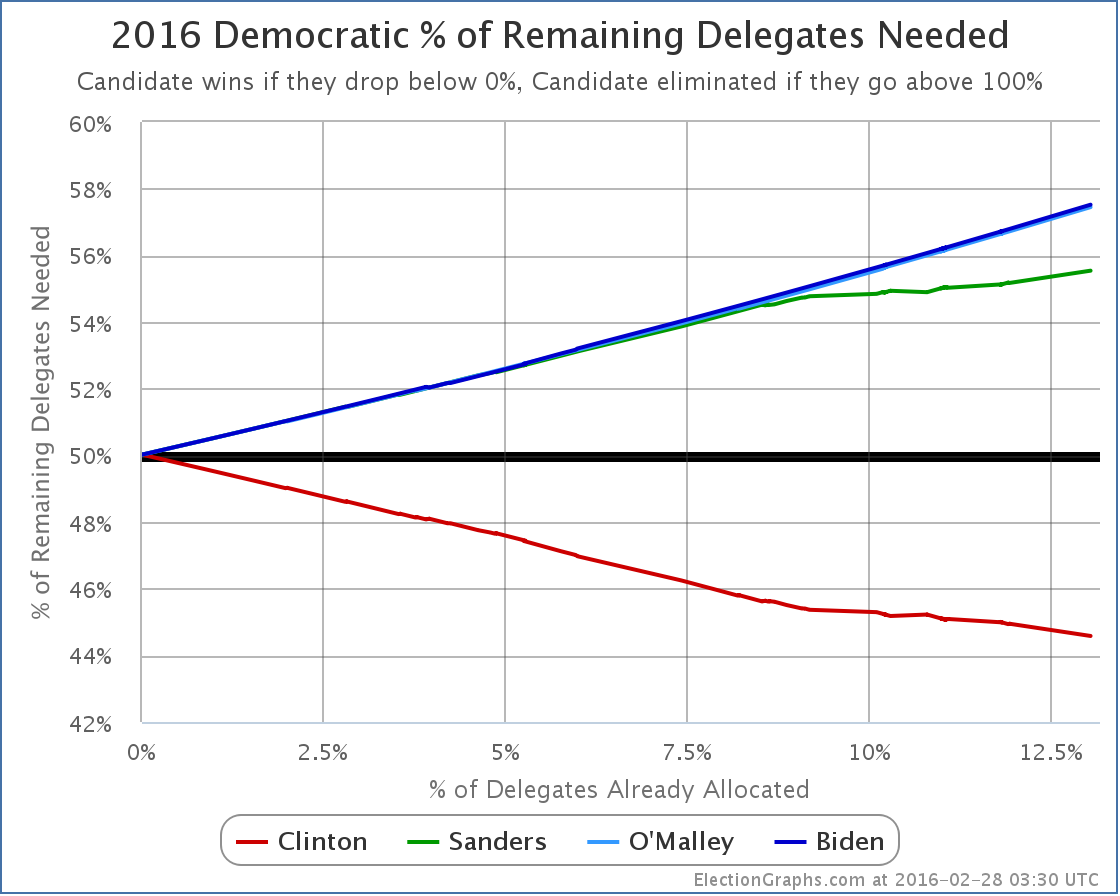
South Carolina is that slight acceleration of the curves starting at about 11.9%.
Sanders now needs 55.54% of the remaining delegates to catch up and win. (Or less if he starts flipping Clinton superdelegates to his side, but there has been no sign of that yet.)
Meanwhile, Clinton only needs 44.58% of the remaining delegates to win.
Frankly, in the 2008 and 2012 cycles once the frontrunner needed less than 45% of the delegates to win, it was time to start calling the race over. Yes, something happening that would allow a challenger to catch up and win is still possible. But it is unlikely. And with each additional contest where the challenger fails to make their own “% needed to win” mark, it gets harder.
But lets not consider it done quite yet. Super Tuesday is coming up in a few days. Maybe there is something there to indicate this isn’t over quite yet. Just as I did for the Republicans, lets game out what Super Tuesday looks like based on current polling. I’ll use the RCP poll averages, then try to estimate delegates based on the rules in each state.
Texas (222 delegates)
- Current poll averages: 59.9% Clinton, 33.6% Sanders
- Delegate estimates: 142 Clinton, 80 Sanders
Georgia (102 delegates)
- Current poll averages: 62.8% Clinton, 26.0% Sanders
- Delegate estimates: 72 Clinton, 30 Sanders
Virginia (95 delegates)
- Current poll averages: 54.5% Clinton, 35.0% Sanders
- Delegate estimates: 58 Clinton, 37 Sanders
Massachusetts (91 delegates)
- Current poll averages: 46.3% Sanders, 45.7% Clinton
- Delegate estimates: 46 Sanders, 45 Clinton
Minnesota (77 delegates)
- Current poll averages: 54.5% Clinton, 28.5% Sanders
- Delegate estimates: 51 Clinton, 26 Sanders
Tennessee (67 delegates)
- Current poll averages: 53.0% Clinton, 30.0% Sanders
- Delegate estimates: 43 Clinton, 24 Sanders
Colorado (66 delegates)
- Last poll from November so using national averages: 47.2% Clinton, 42.2% Sanders
- Delegate estimates: 35 Clinton, 31 Sanders
Alabama (53 delegates)
- Using only poll from February: 59% Clinton, 31% Sanders
- Delegate estimates: 35 Clinton, 18 Sanders
Oklahoma (38 delegates)
- Current poll averages: 45.0% Clinton, 36.0% Sanders
- Delegate estimates: 21 Clinton, 17 Sanders
Arkansas (32 delegates)
- Current poll averages: 57.0% Clinton, 28.5% Sanders
- Delegate estimates: 21 Clinton, 11 Sanders
Vermont (16 delegates)
- Current poll averages: 84.5% Sanders, 9.5% Clinton
- Delegate estimates: 16 Sanders
Democrats Abroad (13 delegates)
- No polls, using national averages: 47.2% Clinton, 42.2% Sanders
- Delegate estimates: 7 Clinton, 6 Sanders
American Samoa (6 delegates)
- No polls, using national averages: 47.2% Clinton, 42.2% Sanders
- Delegate estimates: 3 Clinton, 3 Sanders
OK. Adding all those up…
533 Clinton, 345 Sanders
Now, these are estimates based on relatively sparse polling and the assumption that candidate support is uniformly distributed within each state. The results will not be exactly like this.
But unless something major happens to change the picture in the next couple of days, the results on Tuesday should look broadly similar to this. With the estimate above, Sanders gets about 39.3% of the delegates. A far cry from the 55.5% he would need in order to actually improve his position against Clinton.
Adding the current delegates to the estimated Super Tuesday delegates, the new totals would be:
1,069 Clinton, 427 Sanders, 3 O’Malley
31.5% of the delegates will have been allocated. But 68.5% would still be available.
What would Sanders’ new “% of remaining needed to win” be at that point?
It would be 59.9%.
Sanders would need nearly 60% of the remaining delegates to catch up and win, or a massive defection of Clinton superdelegates to lower that number.
To imagine Sanders performing like this, you either have to believe the remaining states are vastly different in their preferences to the states that will have gone before (there is no evidence for this so far), or some massive seismic event would have to happen in the campaign to dramatically change minds of large numbers of Democratic voters in a very short timeframe.
A good argument could be made that absent a shocking surprise, this race is already done. After Super Tuesday, if the results are anything like the estimates above, then those hoping for a Sanders win will be grasping at the thinnest of straws. By the time we get to the end of March, again, absent that huge surprise, there will be no serious question any more.
Now, surprises do sometimes happen. You never know. But you don’t get to a Sanders win from here with just “normal” campaigning. It would take something bigger… a major Clinton scandal bigger than anything seen so far… a serious issue with Clinton’s health… something along those lines.
This doesn’t preclude Sanders staying in the race all the way until the convention and battling in every primary and caucus. He could do that if his cash flow holds out. But it would be to champion his issues and to try to move the party further in his direction, it would not be a serious attempt to win the nomination.
Three days from the time I post this, we’ll have Super Tuesday results and we’ll see just how close my poll based guestimates were and if this analysis holds up. More then…
[Update 2016-03-02 00:47 UTC – As a result of a final scan for superdelegates prior to adding Super Tuesday results we have a net change of +7 Clinton superdelegates, +2 Sanders superdelegates, -2 O’Malley superdelegates (they flipped to Clinton). This does not substantively change any of the analysis above and does not get a separate blog post, but a note here was warranted.]
Note: This post is an update based on the data on ElectionGraphs.com. Election Graphs tracks both a poll based estimate of the Electoral College and a numbers based look at the Delegate Races. All of the charts and graphs seen in this post are from that site. Additional graphs, charts and raw data can be found there. All charts above are clickable to go to the current version of the detail page the chart is from, which may contain more up to date information than the snapshots on this page, which were current as of the time of this post. Follow @ElectionGraphs on Twitter or like Election Graphs on Facebook to see announcements of updates or to join the conversation. For those interested in individual general election poll updates, follow @ElecCollPolls on Twitter for all the polls as they are added.
This week on Curmudgeon’s Corner Sam and Ivan of course talk about Election 2016, covering both the Democratic and Republican nomination races, then some speculation about what a Clinton vs Trump race may look like. Before that though, they spend some time following up on both the Apple vs FBI case and the SCOTUS vacancy. And there is some feedback to discuss!
Click below to listen or subscribe… then let us know your own thoughts!

Recorded 2016-02-25
Length this week – 1:32:14
 1-Click Subscribe in iTunes 1-Click Subscribe in iTunes
 View Podcast in iTunes View Podcast in iTunes
 View Raw Podcast Feed View Raw Podcast Feed
 Download MP3 File Download MP3 File
 Follow the podcast on Facebook Follow the podcast on Facebook
Show Details:
- (0:00:10-0:11:03) But First
- Water Heater Fire
- Commutes
- Agenda
- Feedback
- (0:12:07-0:28:20) Apple vs FBI
- PR Battle
- Cracking Safes
- Other ways to get info
- Test Case
- Slippery Slopes
- Lavabit comparison
- (0:29:06-0:42:09) SCOTUS and Congress
- Doing Nothing
- Republican Strategies
- Options in January
- Senate Implications
- Republican Factions
- Ivan for SCOTUS
- (0:42:48-1:01:36) Election 2016 – Primaries
- Ivan for SCOTUS continued
- Clinton Still Winning
- Judicial Murders
- Trump SC/NV Wins
- Dissipating Trump Denial
- Gaming out Super Tuesday
- (1:02:16-1:31:53) Election 2016 – Clinton vs Trump
- Trump as third party after contested convention?
- Are there really that many asshole racists?
- The whiteness of the GOP
- Clinton vs Trump personal attacks
- Trump attacking from both Right and Left
- Trump Reinvention
- President Trump
To be on a pace to win, Trump needed 26 of the 50 delegates in South Carolina. Instead, he got all 50 of them. Just as this site pointed out was very likely on the 10th and again on the 11th. I’ve seen some surprise at this result in some of the commentary, but absent the polls being way off, this was predictable weeks ago.
Delegate rules matter. The popular vote is only relevant in terms of how it determines the delegates.
So Trump jumps way up in the delegate race:
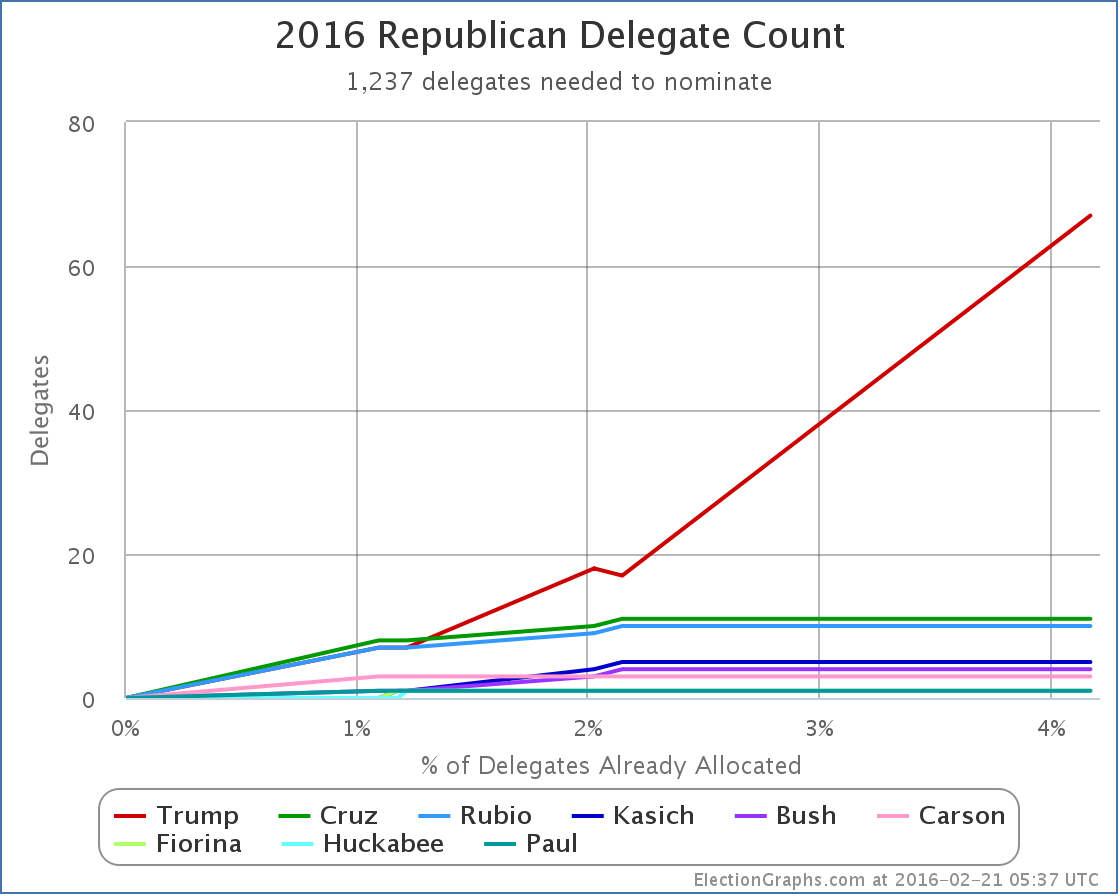
So… 67 Trump, 11 Cruz, 10 Rubio, 5 Kasich, 3 Carson, and 7 for people who have dropped out.
Lets look at this in percentage terms:
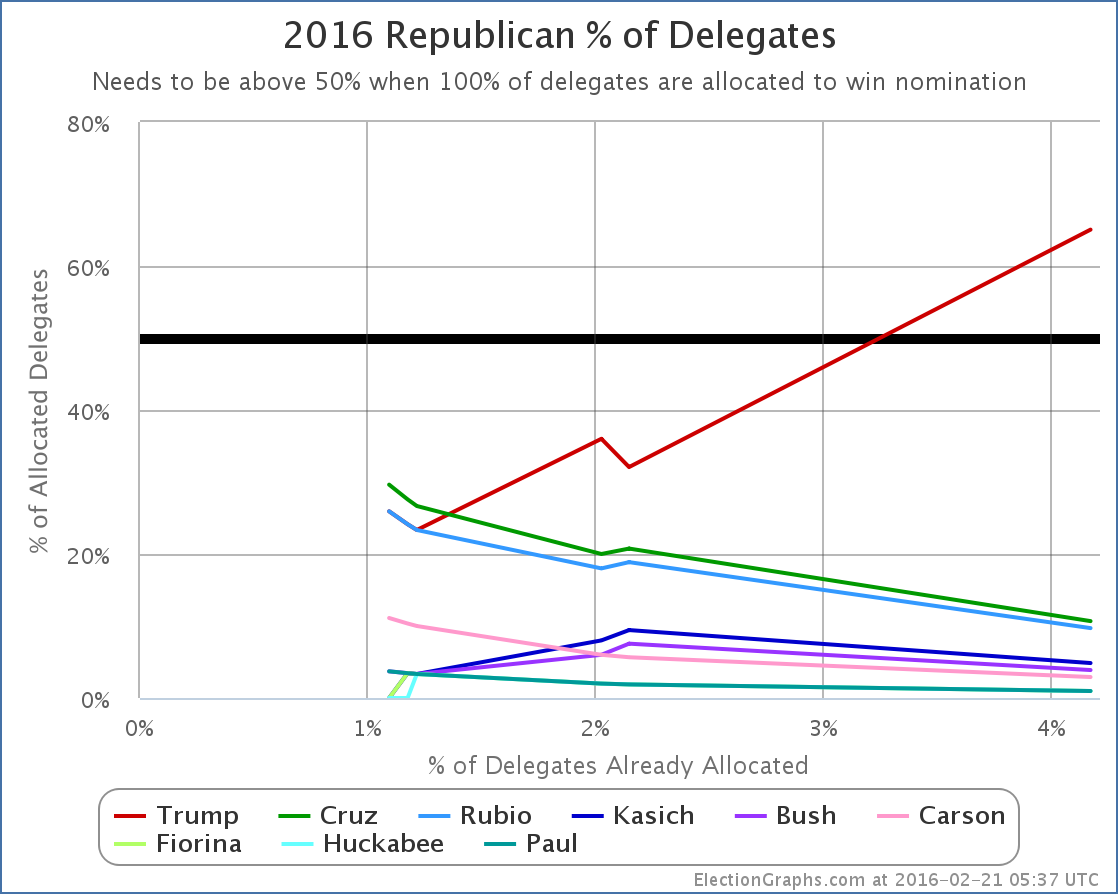
Trump now has more than 50% of the delegates allocated so far. About 65% of them. That is just under 2/3 of the delegates.
Now, we’re only 4.2% of the way through the delegates, but at this point Trump is dominating.
How about “% of remaining delegates needed to win”?
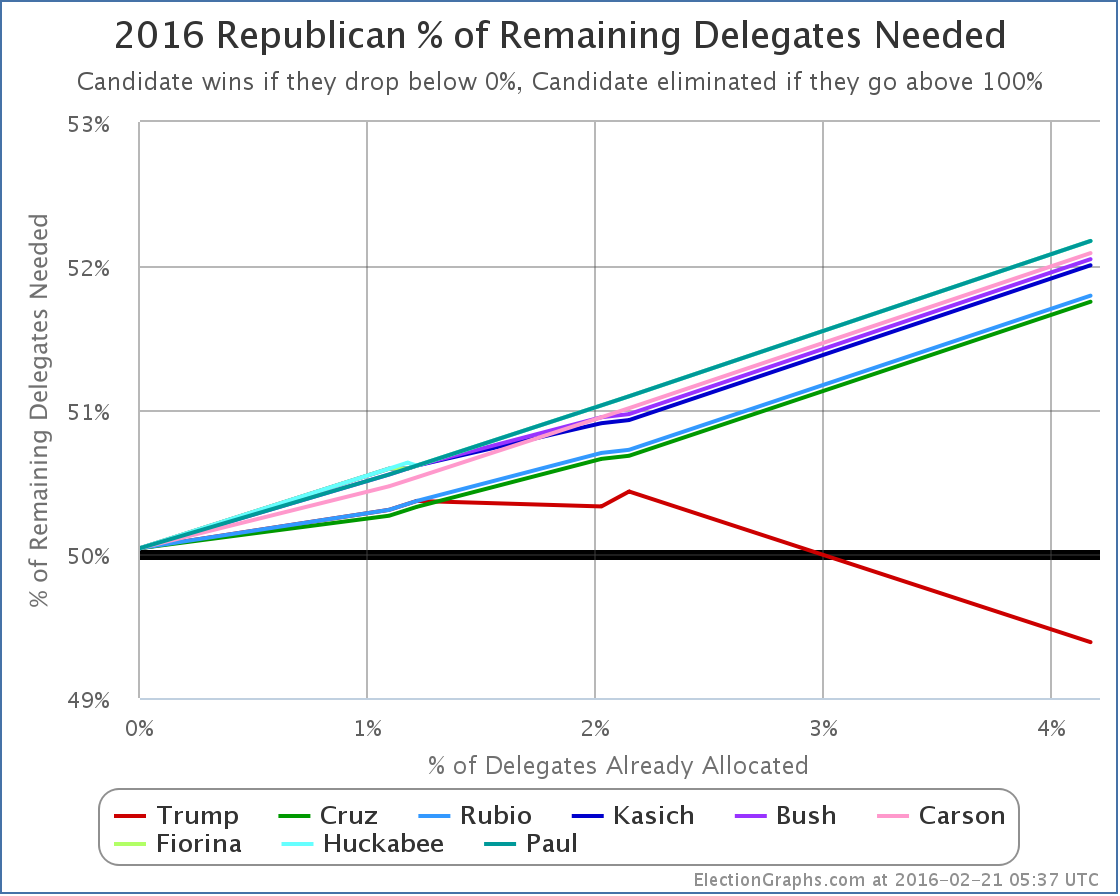
Now that he has a majority, Trump’s line dives down. (Down is good on this graph.) He now only needs 49.39% of the remaining delegates to win.
More importantly though, because of how the delegates split between his opponents, they are all just racing upward. Cruz is second right now, and he now needs 51.75% of the remaining delegates in order to win. Now, this still isn’t a crazy number, although obviously Cruz hasn’t come close to it in any contest yet. But… time is running out.
We are down to five candidates after South Carolina. It is possible we will lose more after Nevada in a couple days. But most polling and modeling I have seen says Trump wins in a five way race, in a four way race, and even in a three way race. It takes bringing it down to a two person race before the non-Trump starts winning. The question is if that happens fast enough to “Stop Trump”.
With the number of delegates determined between March 1st and March 15th, if such a move is going to happen, it has to happen very quickly. Still having 3+ candidates when the March 1st votes happen puts Trump in a very strong position. If we’re not down to 3 before March 15th, Trump may just be wrapping things up.
Or something dramatic could happen that changes everything. You never know.
For now though, polls in Nevada and the March 1st states look good for Trump, and we still have five people in the race.
Trump is on a path to victory.
Nevada is up next on Tuesday.
Note: This post is an update based on the data on ElectionGraphs.com. Election Graphs tracks both a poll based estimate of the Electoral College and a numbers based look at the Delegate Races. All of the charts and graphs seen in this post are from that site. Additional graphs, charts and raw data can be found there. All charts above are clickable to go to the current version of the detail page the chart is from, which may contain more up to date information than the snapshots on this page, which were current as of the time of this post. Follow @ElectionGraphs on Twitter or like Election Graphs on Facebook to see announcements of updates or to join the conversation. For those interested in individual general election poll updates, follow @ElecCollPolls on Twitter for all the polls as they are added.
This week on Curmudgeon’s Corner Sam and Ivan talk about chickens! Just kidding. Of course they talk about Election 2016. New Hampshire. Sanders beating Clinton. Trump walking all over the other Republicans. The log jam at second place on the Republican side. What this means for the delegate race and the next couple of states on both sides. Everything you would expect! Then they wrap it up with a lightning round for some thoughts on the Zika virus, changes on Twitter, the Oregon standoff, and more!
Click below to listen or subscribe… then let us know your own thoughts!
Recorded 2016-02-11
Length this week – 1:39:01
1-Click Subscribe in iTunes
View Podcast in iTunes
View Raw Podcast Feed
Download MP3 File
Follow the podcast on Facebook
Show Details:
- (0:00:10-0:16:41) Intro
- Pi Again
- Agenda
- Ivan’s Rough Day
- Sam’s Upcoming Trip
- (0:17:26-0:55:16) Election 2016: Republicans
- New Hampshire Results
- Upcoming contests
- Rubio’s debate crash
- Kasichmentum?
- Who drops out and when?
- Gaming out South Carolina
- anti-Trumps running out of time
- Trump moving to center?
- Trump/Sanders Swing Voters
- Fighting each other instead of Trump
- Carson in South Carolina!
- (0:56:25-1:19:52) Election 2016: Democrats
- No Surprise
- Delegate Story
- South Carolina and Nevada
- What is the path for Sanders?
- Clinton indictment?
- Sanders/Clinton demographics
- Independents
- Sam’s Choices
- Santorum iSideWith
- (1:20:41-1:38:40) Lightning Round
- Book: Prince Caspian
- Zika Virus
- Twitter Changes
- Ivan iSideWith
- Oregon Standoff
New Hampshire’s delegate rules are such that the winner gets a big bonus. (The details of how this works were discussed here last week.) So Trump’s approximately 36% of the vote turns into 55% of the delegates. Counting isn’t actually done yet, but if current trends hold, the delegate haul out of New Hampshire will be:
Trump 11, Kasich 3, Bush 2, Cruz 2, Rubio 2.
Adding these to the previous results in Iowa, and we have these new totals: Trump 18, Cruz 10, Rubio 9, Kasich 4, Bush 3, Carson 3, Fiorina 1, Huckabee 1, Paul 1.
In the form of a graph of the total delegates, we see this:
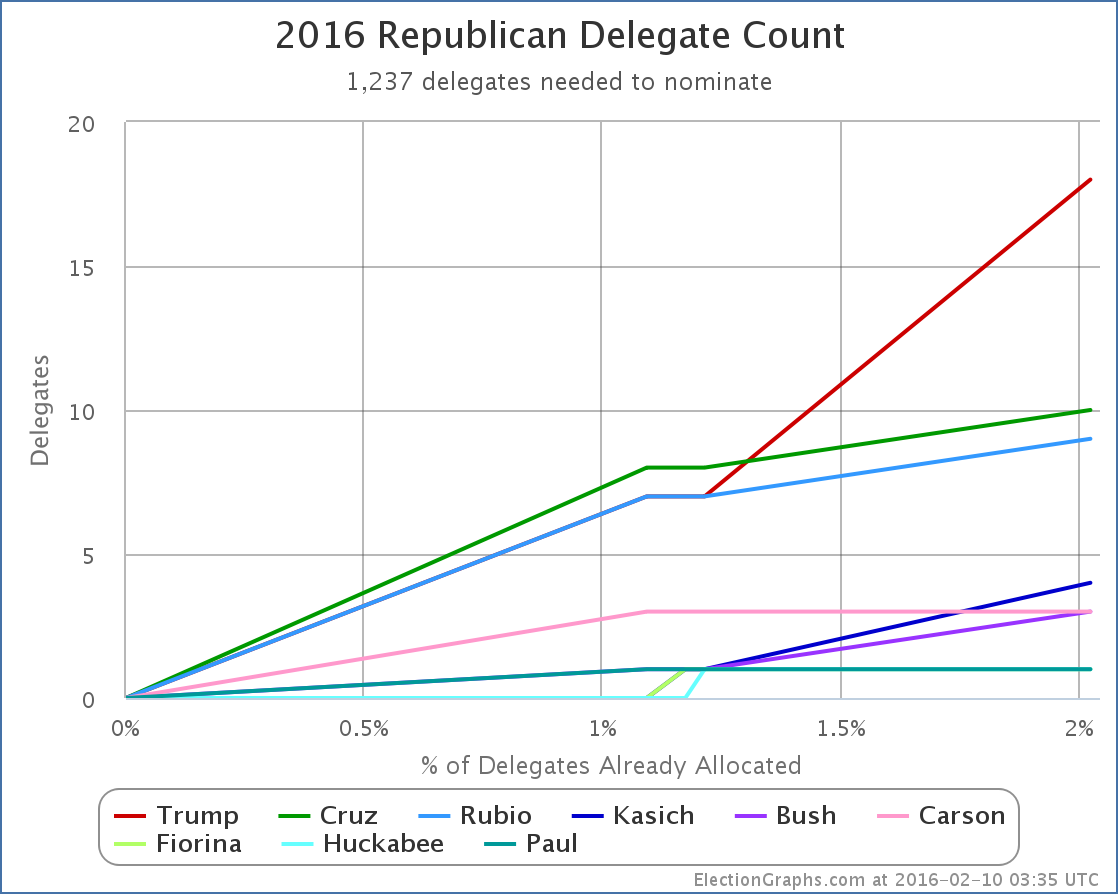
Some groupings look apparent on this chart.
Trump is out by himself in the lead.
Cruz and Rubio make up a second tier, at about half of Trump’s level.
Kasich, Bush and Carson are the third tier. Way behind, but at least with multiple delegates.
Then finally Fiorina, Huckabee and Paul bringing up the rear with one delegate each. Two of these three have already dropped out. It will be surprising if the third does not do so soon.
How does this match what we’re hearing in the spin out of New Hampshire? Well, there is wide acknowledgment that Trump did have a nice win. But the majority of the attention still seems to have been on the race for second, and how that positions the anti-Trumps going forward.
Within that, relatively little attention was paid to Cruz, and he is still in 2nd. Rubio is being dismissed because he did badly in New Hampshire, but he is still in 3rd over all. Meanwhile lots of attention given to Kasich and Bush, but they are still stuck in the third tier with Carson with less than a handful of delegates.
Time to flip this and look at this in terms of my favorite metric, the “% of remaining needed to win”:
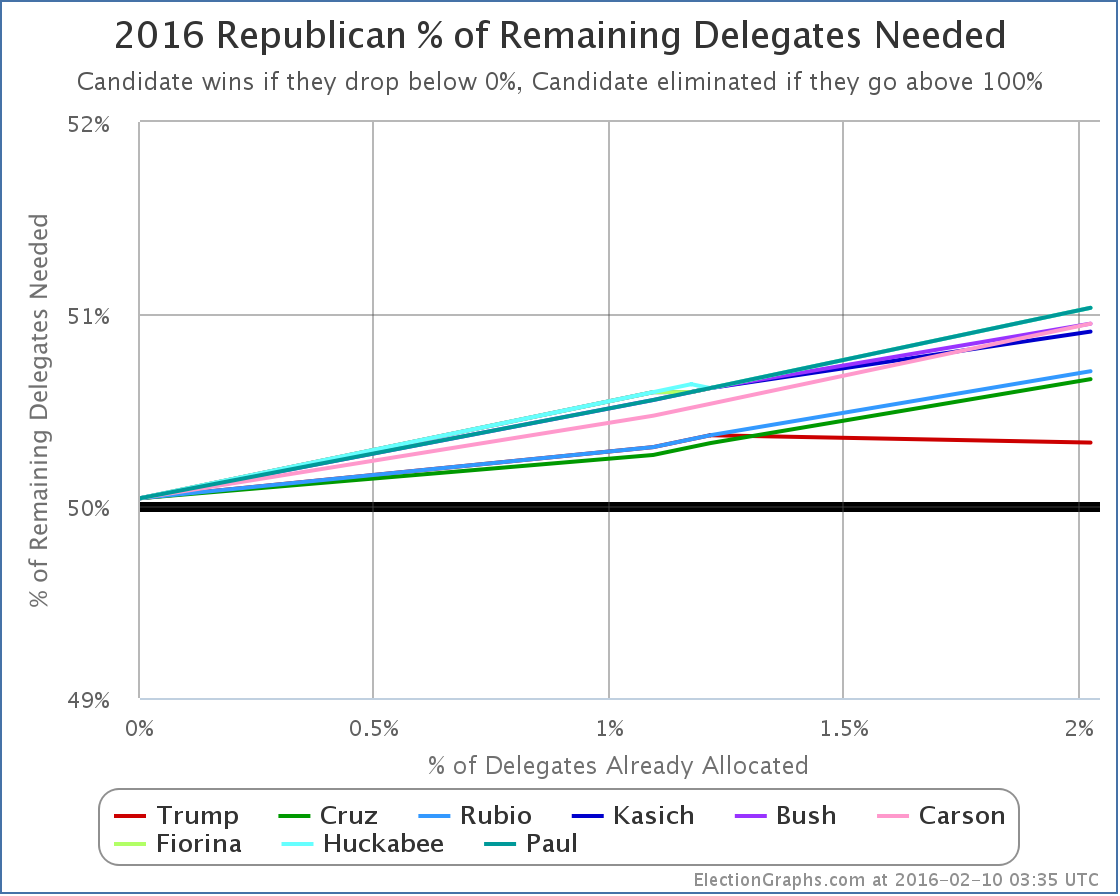
Trump exceeded the 50.37% of the delegates he needed to get to improve his position. Going forward he needs 50.33% of delegates to be on a pace to win. That is a relatively small change. With almost 98% of delegates still to be determined, there is a huge amount of flexibility available here to all the candidates.
Given that Trump got 55% of the delegates in New Hampshire, that means however that NONE of the other candidates got what they needed, or even close. Essentially, every one of the non-Trump candidates fell further behind today.
Now, Trump still doesn’t have a majority of delegates. To be on a pace to actually win, rather than just to have the most delegates going into the convention, he needs to do better than he has so far. But he is far closer to that mark than any of the other candidates. And if he continues matching his New Hampshire results, he will win.
The story here continues to be that while Trump hasn’t managed a majority in any contest so far, the opposition is so divided that Trump still easily wins (New Hampshire) or at the very least comes very close (Iowa). Does this continue? Does it get worse?
Time to look at the next contest on the Republican side, South Carolina.
There have not been any South Carolina polls since before Iowa, so new polls are eagerly anticipated, but at the moment the RCP average has Trump at 36.0%, Cruz at 19.7%, Rubio at 12.7%, Bush at 10.0% and then everybody else.
Now, that may change. Specifically if either Rubio or Bush drop out that will scramble things a bit. But that may not happen. There is a case to be made for both of them sticking in at least through South Carolina.
Trump probably wins this. But by how much? Time to look at the delegate rules in South Carolina.
From Greenpapers:
- 21 district delegates are to be allocated to presidential contenders based on the primary results in each of the state’s 7 congressional districts: each congressional district is assigned 3 National Convention delegates and the presidential contender receiving the greatest number of votes in that district will receive all 3 of that district’s National Convention delegates. [Rule 11(b)(4)]
- 26 (10 base at-large delegates plus 16 bonus delegates) at-large delegates are to be allocated to the presidential contender receiving the greatest number of votes in the primary statewide. [Rule 11(b)(5)]
- 3 party leaders, the National Committeeman, the National Committeewoman, and the chairman of the South Carolina’s Republican Party are pledged to the presidential contender receiving the greatest number of votes in the primary statewide.
If Trump wins by any margin, no matter how small, he gets 29 of the 50 delegates right up front. That already would give him 47 of the 100 delegates that would have been allocated in Iowa + New Hampshire + South Carolina.
Of course, in order to win the whole state, he would have had to have won some of the congressional districts too. Probably most of them. And so far in Iowa and New Hampshire, it doesn’t seem like there has been a lot of geographic lumpiness to Trump’s support. So he may well win ALL of the congressional districts. In that case Trump would walk out of South Carolina with all 50 of the available delegates. This is very possible.
In that scenario, after South Carolina, the overall delegate count would look like: Trump 68, Cruz 10, Rubio 9, Others 13
Trump would have a huge delegate lead. Even if he doesn’t win all 50, he will still have a very large delegate lead.
Nevada is three days after South Carolina. It is proportional, not semi-winner-take-all like South Carolina, but the latest polls still have Trump with a nice lead in Nevada. Those polls are old and out of date, but does anybody think two straight wins would hurt Trump’s position?
To “stop Trump” things have to move very quickly to a one on one with Trump vs Somebody. Maybe a three way race could do it, but might just be a recipe for a contested convention. But as long as we’re still looking at four or five candidates splitting the non-Trump vote, Trump wins.
But the non-Trumps still seem to be in a locked battle with each other for that anti-Trump one on one slot. And in doing so, they just let Trump win. The race will of course consolidate further. More candidates will drop out. Some may drop out before South Carolina. But it is unclear if that will be enough to let one of the others actually win in South Carolina.
Trump won New Hampshire. Trump looks like he will probably win the next two states. Things get more complicated once we get into March, but Trump would get there with a substantial lead.
Things are by no means settled yet. There is a long way to go. Even after we get past both South Carolina and Nevada 94.6% of delegates will still be up for grabs. There will still be time for the non-Trumps.
But if we only get consolidation down to 2 or three candidates after the March 1st contests, when 25.8% of the total delegates will be decided, the non-Trumps that are left may have a really tough uphill fight to catch up.
If consolidation doesn’t happen until after March 15th, 60% of the delegates will already have been decided, and it may just be too late. (Although if several non-Trumps are still strong at that point and Trump has the lead but not a majority, we’re looking at a contested convention, and that starts getting into completely different scenarios.)
But if the non-Trumps want to actually win, they have to stop fighting each other, some of them have to drop out, and they have to actually act like Trump is the frontrunner, and that their priority has to be bringing him down rather than each other. Otherwise they are done, and Trump ends up walking away with this.
Note: This post is an update based on the data on ElectionGraphs.com. Election Graphs tracks both a poll based estimate of the Electoral College and a numbers based look at the Delegate Races. All of the charts and graphs seen in this post are from that site. Additional graphs, charts and raw data can be found there. All charts above are clickable to go to the current version of the detail page the chart is from, which may contain more up to date information than the snapshots on this page, which were current as of the time of this post. Follow @ElectionGraphs on Twitter or like Election Graphs on Facebook to see announcements of updates or to join the conversation. For those interested in individual general election poll updates, follow @ElecCollPolls on Twitter for all the polls as they are added.
Lets jump right to it. In the last Democratic update we mentioned that to actually improve the “% of remaining needed to win” Sanders needed to get 54.36% of the delegates available in New Hampshire. That would be 14 out of 24 delegates that were available today. He got 15 out of 24, or 62.5% of yesterday’s delegates. So he did it!
In addition, since my last update, there were some superdelegate changes. The net change from those was +1 Clinton, +1 Sanders. There was also a net reduction of 1 available delegate, bringing the total number of Democratic delegates down to 4,763.
With all of that in place, here is the new chart for “% of remaining needed to win”:
The Sanders % Needed has indeed gone down, and he made Clinton’s go up!
Sanders’ % Needed specifically moved from 54.36% to… 54.30%.
This was at 54.22% before Iowa. 54.30% matches where this was right after Iowa.
So, Sanders did improve his situation, but only enough to undo the superdelegate changes that happened after Iowa, not enough to get back even to where he was before the voting started.
Another way to look at this is to just look at New Hampshire itself. Of delegates allocated by the Primary, Sanders got 15 delegates to Clinton’s 9. But New Hampshire also has 8 superdelegates, and 6 of these had already declared for Clinton.
So the actual New Hampshire total as of today is 15 Clinton, 15 Sanders, 2 TBD.
So even with his big win, which was indeed a big win, Sanders actually has only pulled even in delegates in the state.
Now, of course, superdelegates can change their mind. It has been said that if one candidate was clearly leading absent superdelegates, the superdelegates would not go against them, and would start to change their minds and flip to the candidate leading in non-super delegates. Maybe. It could happen. And if it does, that movement will be tracked here. Certainly no such movement has been seen yet.
In the mean time, next up for the Democrats is Nevada on February 20th. Nevada often gets relatively little attention compared to South Carolina, but Nevada will actually be the next place where we see if Sanders is able to take his New Hampshire results and build anything longer term out of it.
Nevada is a caucus state, so delegates won’t actually be allocated on the 20th, but there will be results that can be used to estimate convention delegates. Nevada has 43 delegates. Of those 8 are superdelegates. Clinton already has 3 superdelegates in her column, Sanders has 1. Nevada’s caucuses will determine 35 delegates. 23 will be allocated based on results in the 4 congressional districts, 12 will be allocated based on the state wide results.
To once again have a result that keeps him on pace to catch up to Clinton and win, Sanders needs to get 20 of the 35 delegates available on caucus day, assuming no additional superdelegate declarations or other adjustments between now and then.
At the moment, Nevada poll averages show Clinton leading 50.0% to 30.5%… but there has been no polling there since December. Expect a variety of new polls in the next week. Watch them carefully. For Sanders to be on track, these numbers have to flip… and then Sanders has to build an even larger lead.
In South Carolina, a week after Nevada, Clinton is even further ahead, although again polls there are stale and new ones taken post-Iowa post-New Hampshire are eagerly awaited.
Between now and Nevada, and probably between now and South Carolina, there will be almost non-stop talk about Sanders’ threat to Clinton, how Clinton is a lot weaker than expected, how vulnerable she is. A lot of this is true. To a degree.
But to evaluate if Sanders is actually a threat to Clinton eventually taking the nomination, as opposed to just being a temporary speed bump in her way, Sanders has to not only take the lead in Nevada, South Carolina and beyond, but be ahead by a significant margin, not just a little bit. This is a tall order. Maybe it is possible.
But if there is talk about how Sanders is “closing the gap” or “making it closer than expected” in Nevada or South Carolina, keep in mind that isn’t enough. He needs to actually win and win by a large enough margin to get more than 54.30% of the delegates to be on pace to catch up and win. Otherwise, the task in later states just becomes even harder.
Note: This post is an update based on the data on ElectionGraphs.com. Election Graphs tracks both a poll based estimate of the Electoral College and a numbers based look at the Delegate Races. All of the charts and graphs seen in this post are from that site. Additional graphs, charts and raw data can be found there. All charts above are clickable to go to the current version of the detail page the chart is from, which may contain more up to date information than the snapshots on this page, which were current as of the time of this post. Follow @ElectionGraphs on Twitter or like Election Graphs on Facebook to see announcements of updates or to join the conversation. For those interested in individual general election poll updates, follow @ElecCollPolls on Twitter for all the polls as they are added.


|
Romney |
Obama |
| Romney Best Case |
310 |
228 |
| Current Status |
206 |
332 |
| Obama Best Case |
190 |
348 |
Still no changes to the three scenarios. No close states called yet.
BTW, I am judging “called states” by CNN.
| In the latest Curmudgeon’s Corner…
Sam and Ivan talk about:
- Spam Fighting
- Newt and Romney South Carolina
- Newt and Romney Florida / General Election 2012
Just click to listen now:
[wpaudio url=”http://www.abulsme.com/CurmudgeonsCorner/cc20120122.mp3″ text=”Recorded 22 Jan 2012″]
or
1-Click Subscribe in iTunes
View Podcast in iTunes
View XML Feed |
 |
|
|


