This is the website of Abulsme Noibatno Itramne (also known as Sam Minter).
Posts here are rare these days. For current stuff, follow me on Mastodon
|
New polls added today. The ones that make a difference are new results from Dartmouth in New Hampshire. Specifically, two of our top five candidate pairs get status changes:
Clinton vs Paul
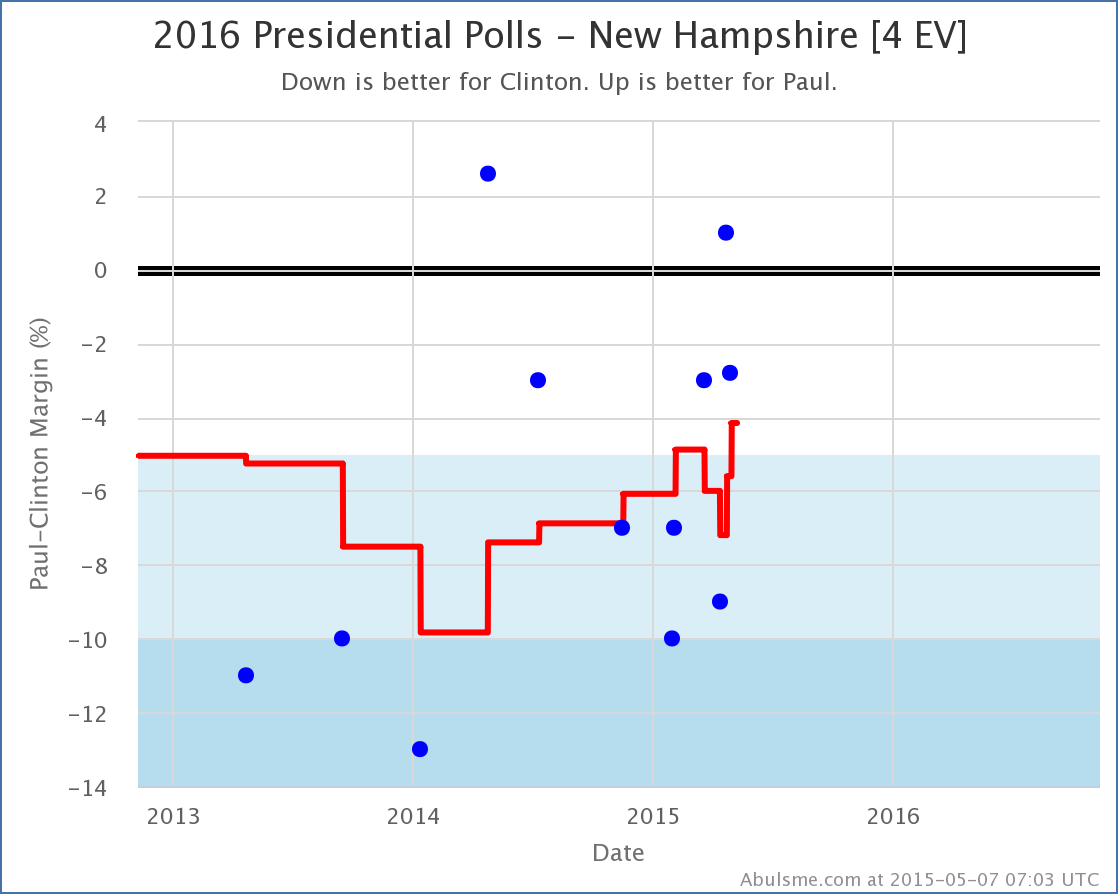
The latest polling once again moves New Hampshire into “Weak Clinton” territory. New Hampshire has been in and out of this category since the 2014 elections, but longer term trend here seems to be away from Clinton, so it is certainly possible New Hampshire will stay here for awhile, but it would also not be surprising if the state continues to bounce in and out of this category. For now, New Hampshire is back in play and improves Paul’s “best case”:
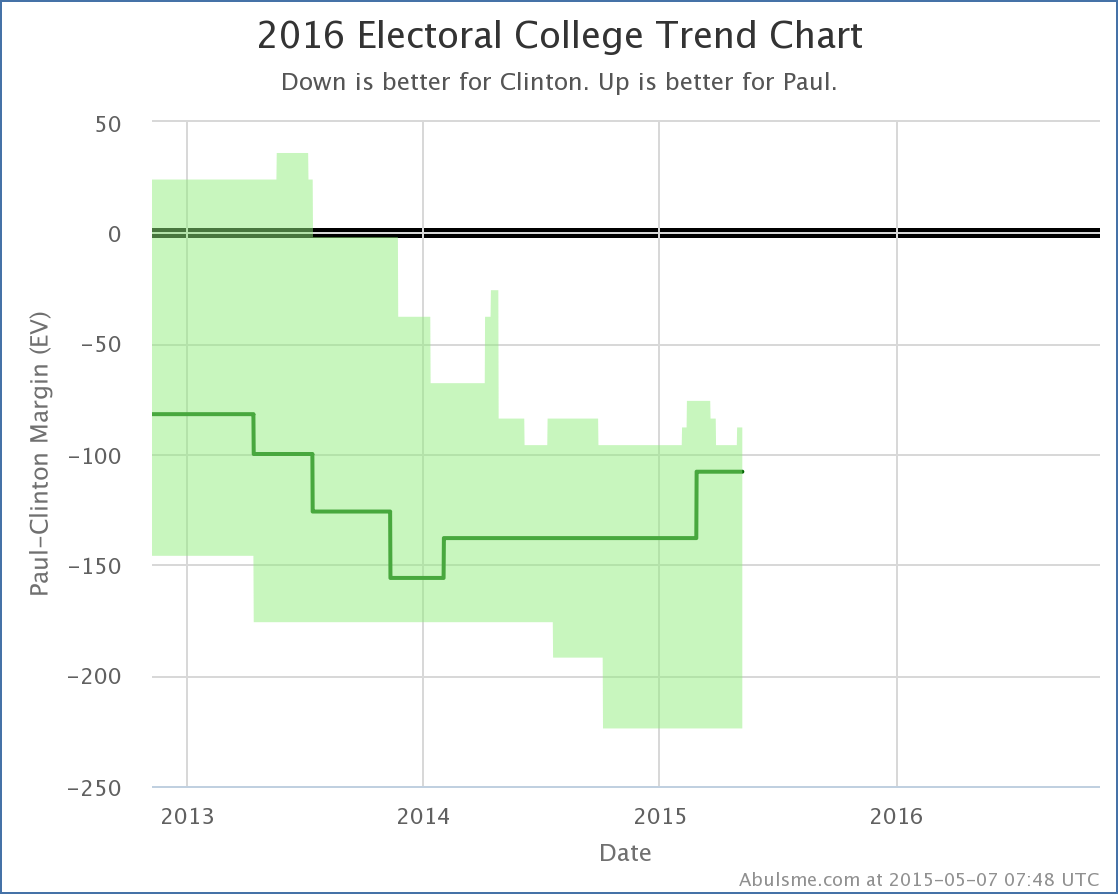
New Hampshire is a little state. It is the little bump in the top right of the “realistically possible” bubble above. Paul’s best case is still a long way from winning. That is not not the case with Clinton vs Bush.
Clinton vs Bush
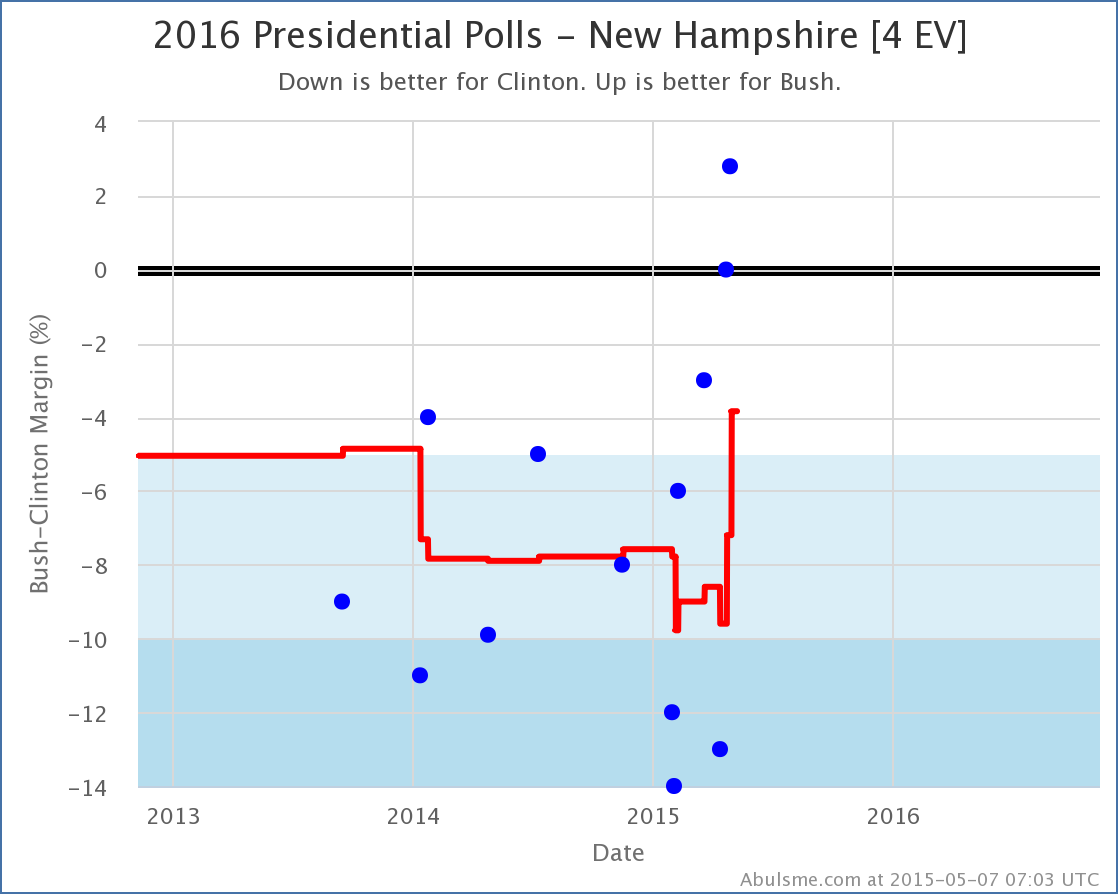
Bush’s improvement has been much more recent and sudden than Paul’s, so there is a greater chance this may just be a result of an outlier or two, and so it will be good to wait for confirmation from additional polls before thinking this is permanent, but for now, this is yet another state that has been moving Bushward…
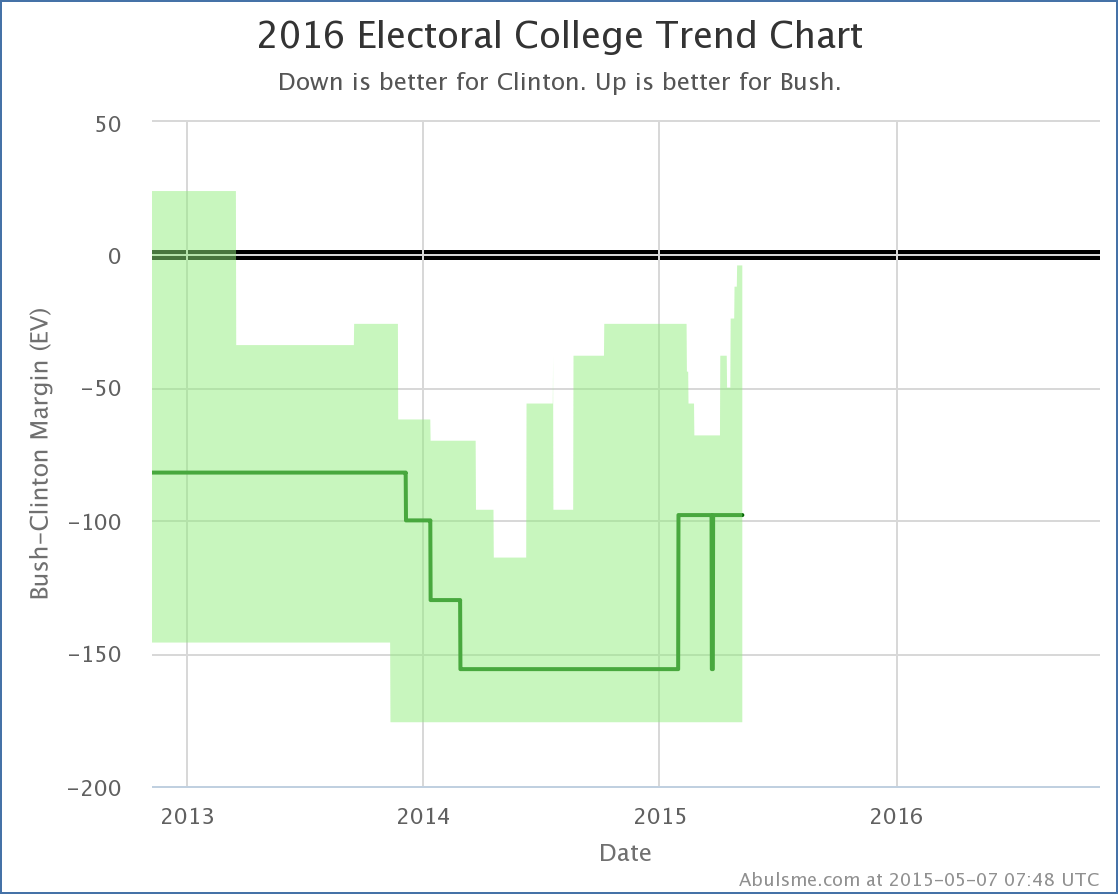
Look at that spike! At the beginning of April, Bush’s best case was to lose to Clinton by 68 electoral votes. In the weeks since, Clintons lead in my poll average has declined to less than 5% in several states and now Bush’s best case is to lose by only 4 electoral votes! Yes, yes, this is still a loss, and this is still only assuming Bush can flip all of the states where Clinton is ahead by less than 5%, but this is still a big move. Bush only has to move one more state from the current “Strong Clinton” category into the “Weak Clinton” category to make his best case actually be to WIN.
Given current polling, the best candidates to try to reduce Clinton’s lead would be Minnesota (Clinton leads by 6.8%), Nevada (Clinton leads by 7.9%), Wisconsin (Clinton leads by 8.6%) or Ohio (Clinton leads by 9.2%). Making any one of those close would bring “Bush wins!” into the “possible bubble” for the first time since we’ve had any significant amount of 2016 polling.
Of course, after that, to really win, Bush needs to actually start flipping some more states to his side as opposed to just making them close.
But one thing at a time.
Note: This post is an update based on the data on my 2016 Electoral College Analysis Site. All of the charts and graphs seen here are from that site. Graphs, charts and raw data can be found there for the race nationally and in each state for every candidate combination that has been polled at the state level. In addition, comparisons of the best polled candidate combinations both nationally and each in each state are available. All charts above are clickable to go to the current version of the detail page the chart is from, which may contain more up to date information than the snapshots on this page, which were current as of the time of this post.
Today there were tons of new polls added to my tracking site. The new polling once again put Clinton vs Paul as the “best polled” candidate pair combination, once again swapping places with Clinton vs Bush to be the default displayed on election2016.abulsme.com. But in the end there were only three status changes on the five candidate pairs with the best polling. Today all three of these changes favor Clinton.
Clinton vs Bush
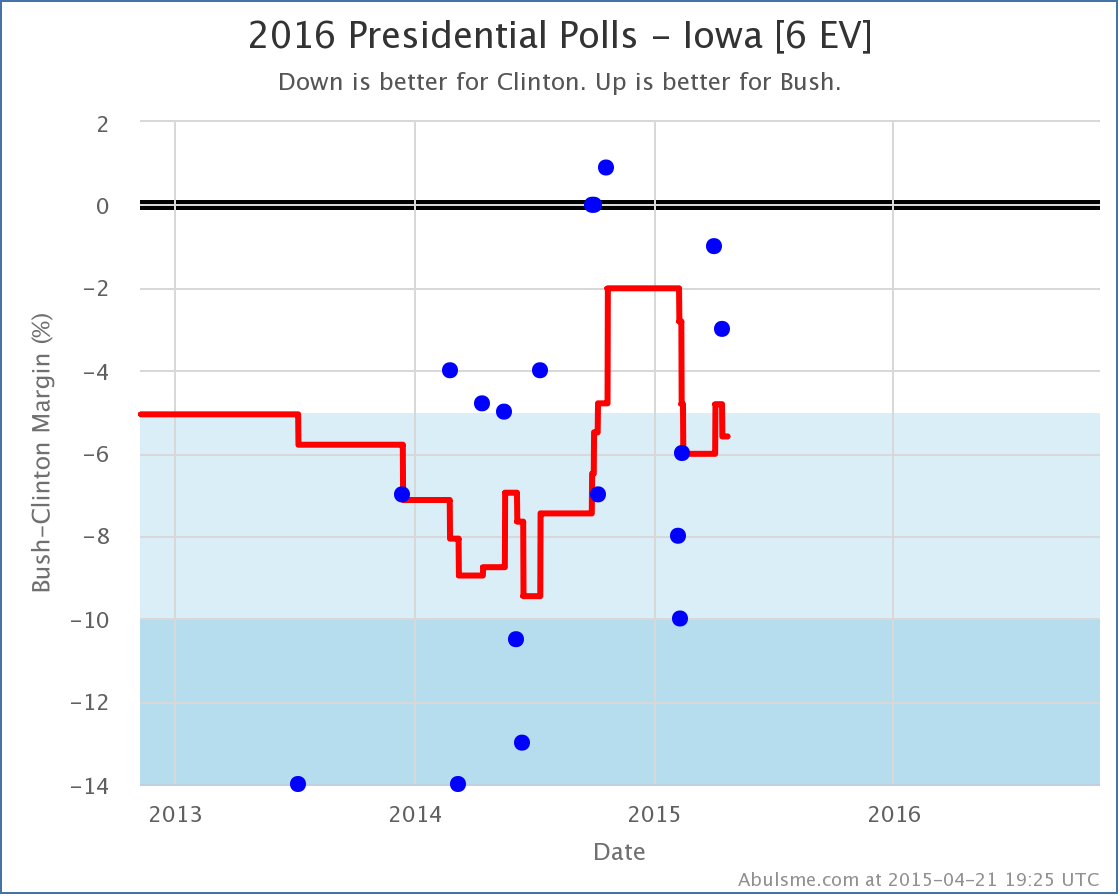
A new Gravis poll in Iowa increases Clinton’s lead once again to over 5%:
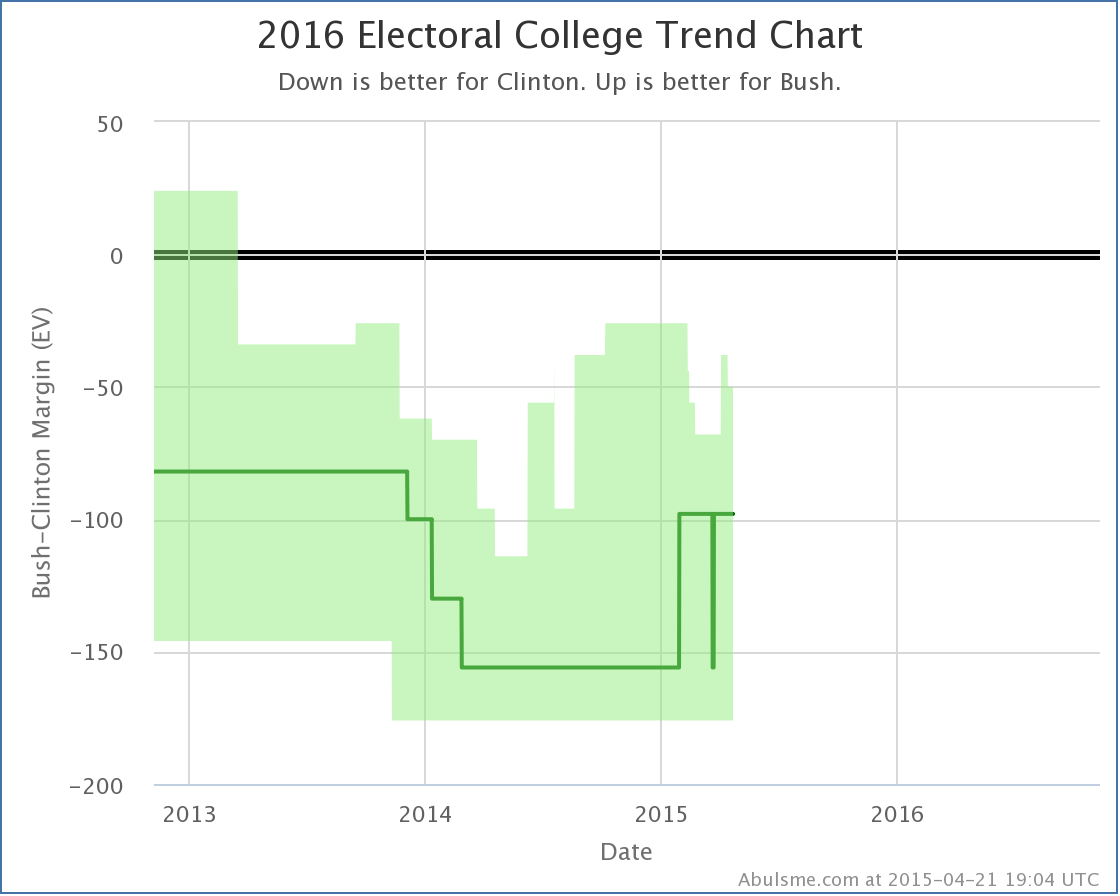
This in turn lowers Bush’s best case from losing to Clinton by 38 electoral votes, to losing by 50 electoral votes:
Iowa has been bouncing back and forth over the line between Weak Clinton and Strong Clinton though, so don’t be surprised for this to change again as new polling comes out.
Clinton vs Christie
A new PPP poll in New Hampshire shows Christie trailing Clinton by 15%. Before this poll, the worst Christie had done in New Hampshire against Clinton was being behind by 5%. So this certainly looks like a potential outlier:
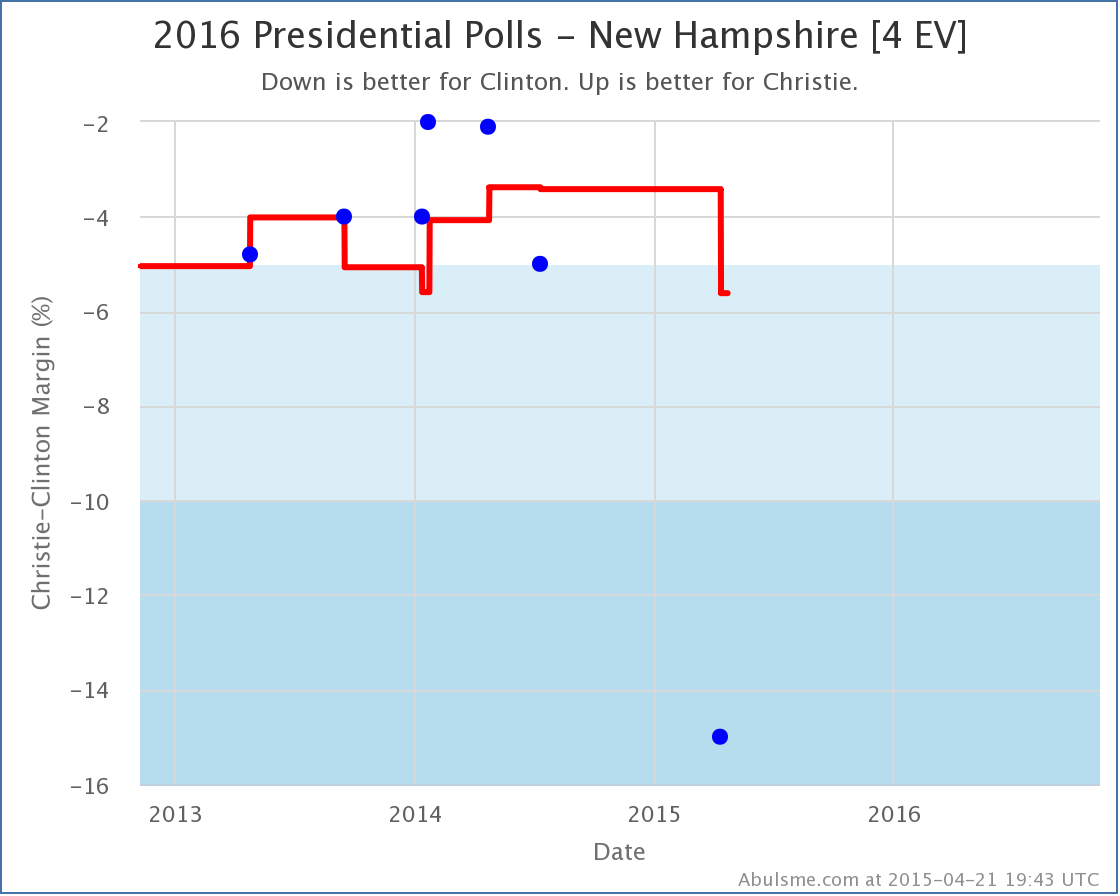
On the flip side, the last polling for Clinton vs Christie in New Hampshire was way back in July, and Christie has been slipping in almost every poll he appears in. So this may also be indicative of a real movement. As usual, the only way to confirm will be with additional polls.
For the moment, with the poll average showing a 5.6% Clinton lead, I remove New Hampshire from the “possible” list for Christie, which moves his best case from losing to Clinton by 100 electoral votes, to losing by 108 electoral votes:
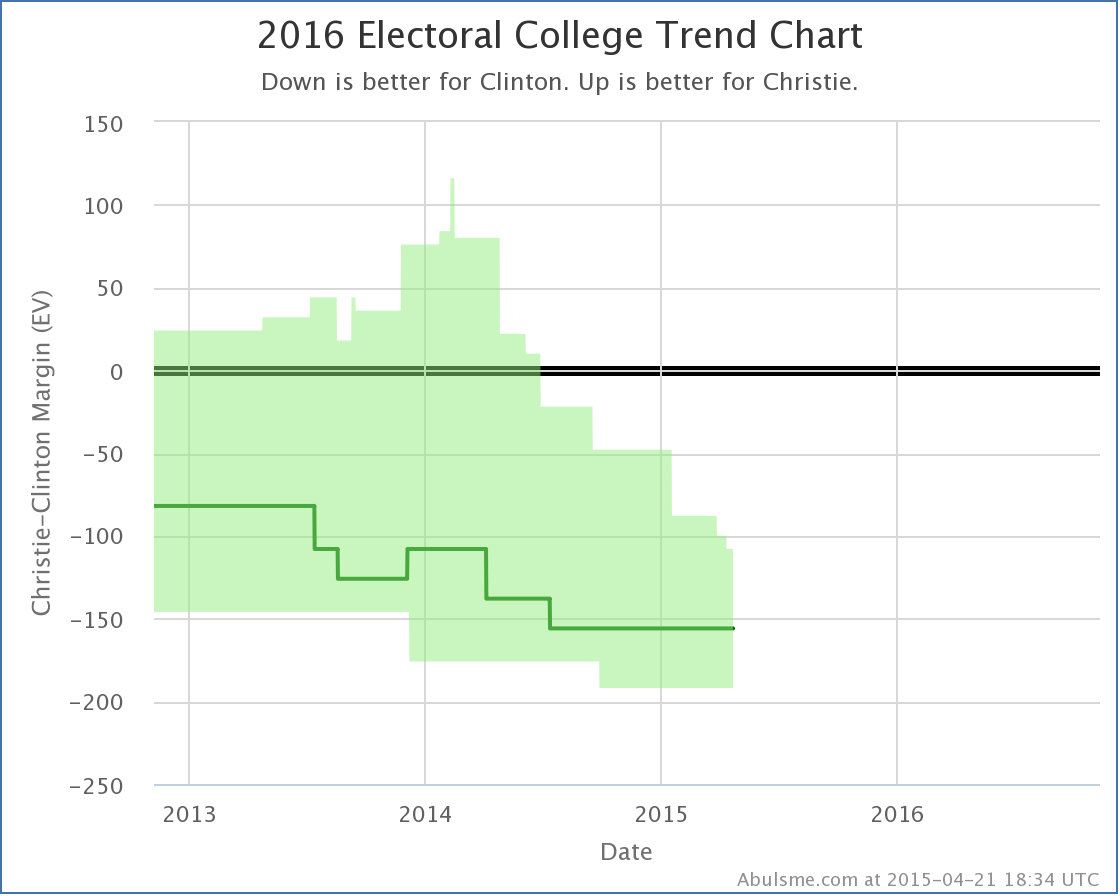
The last time Christie saw any state change categories in his direction vs Clinton was more than a year ago in February 2014. Christie’s general election prospects seem dimmer and dimmer as time goes on. Of course, although I won’t track the nomination races until there are actual delegates to count, if you look at polling for the Republican nomination, you’ll note that the trends look the same there, so Christie may not have to worry that much about his general election prospects.
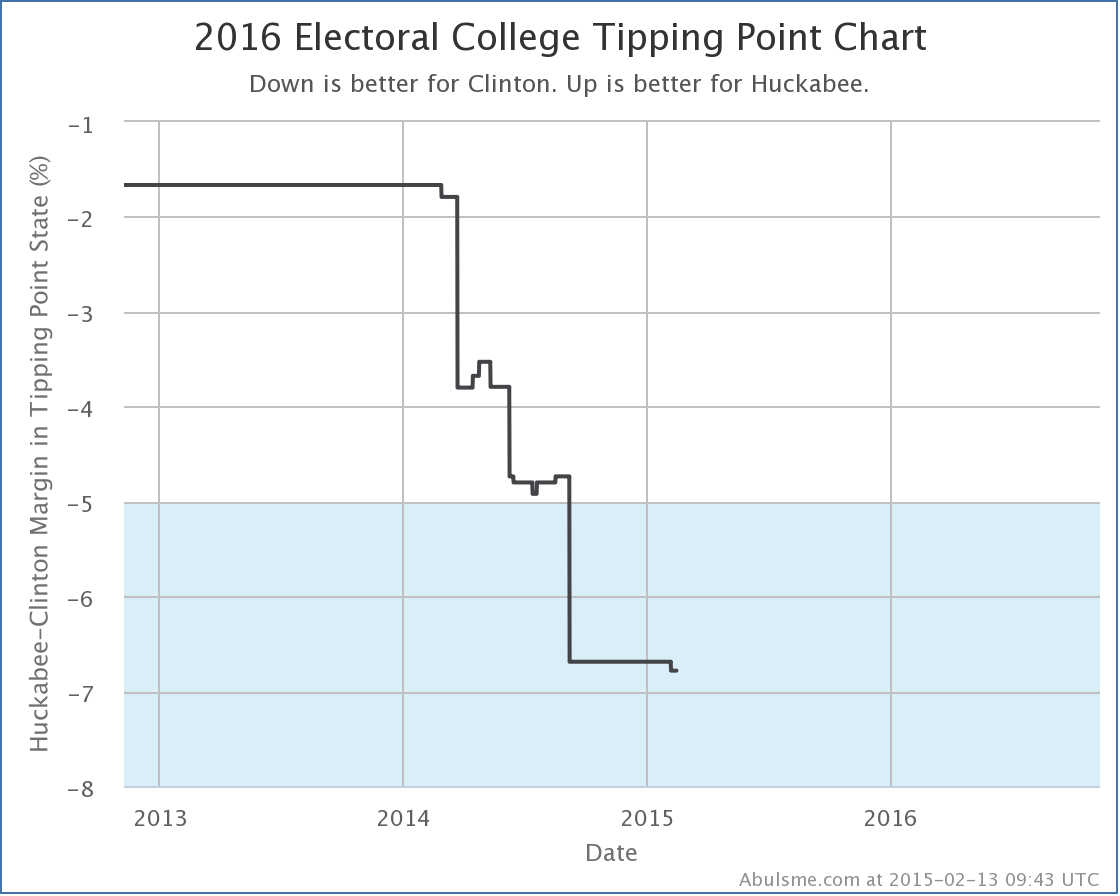
Clinton vs Huckabee
The same PPP poll in New Hampshire mentioned above is only the second Clinton vs Huckabee poll conducted in New Hampshire, but it is enough to move the average to a greater than 5% Clinton lead:
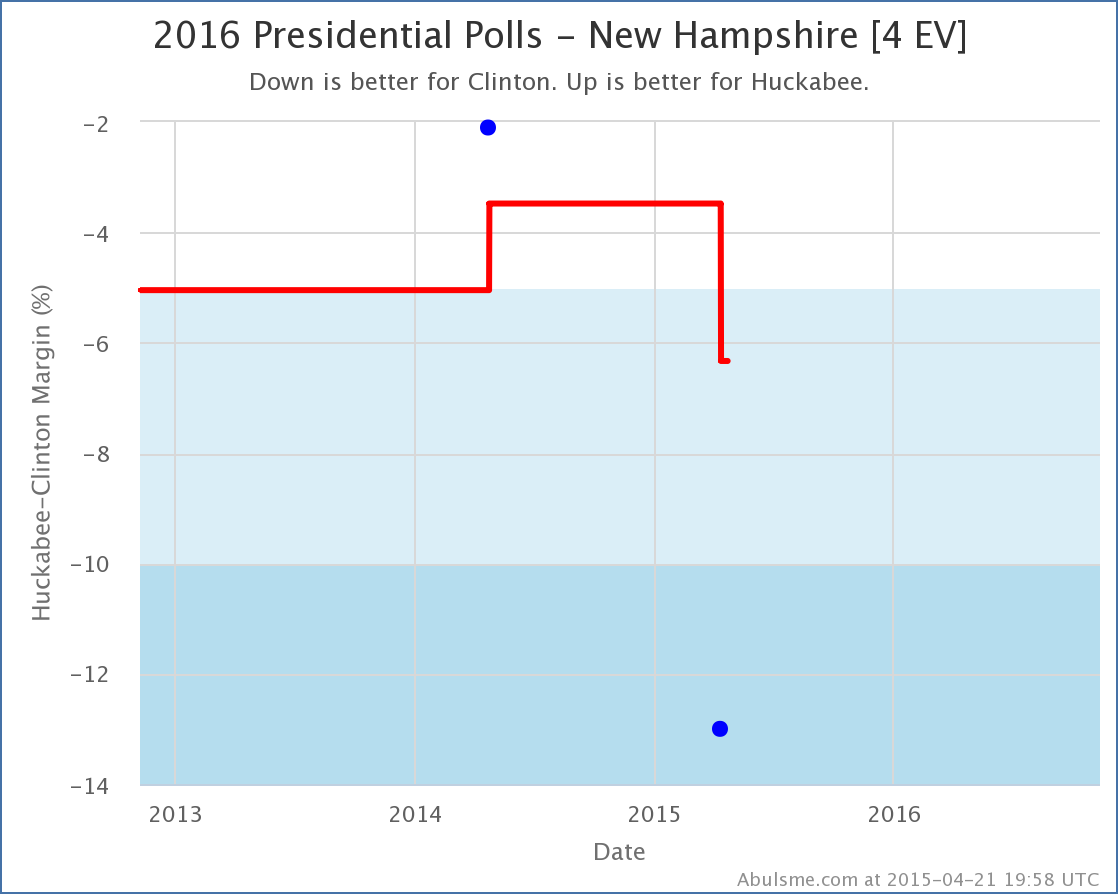
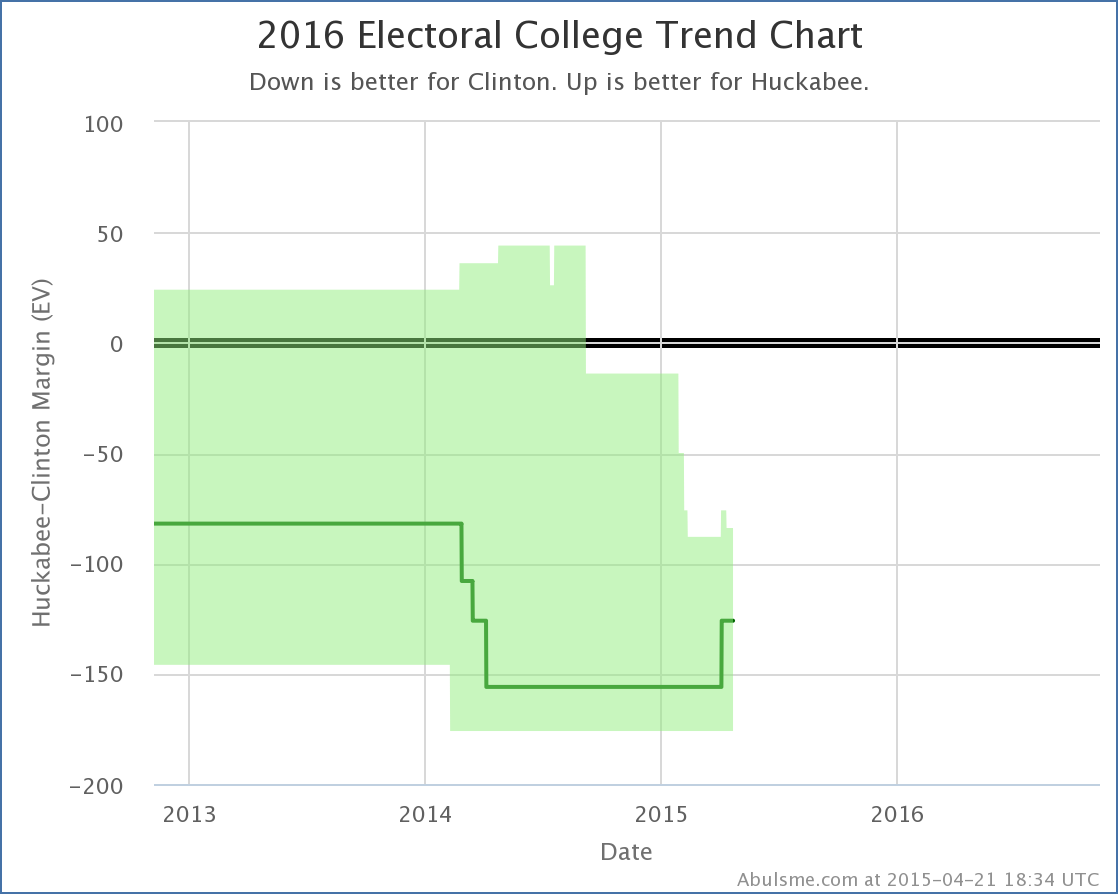
And this moves Huckabee’s best case against Clinton from losing by 76 electoral votes, to losing by 86 electoral votes:
Comparison
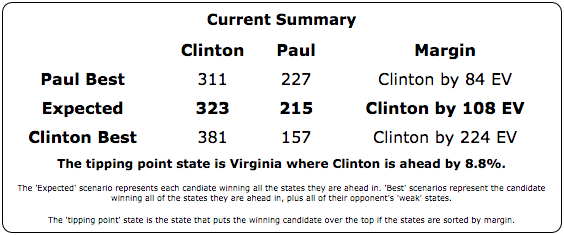
Looking at the “best case” of each of the five “best polled” challengers to Clinton over time:
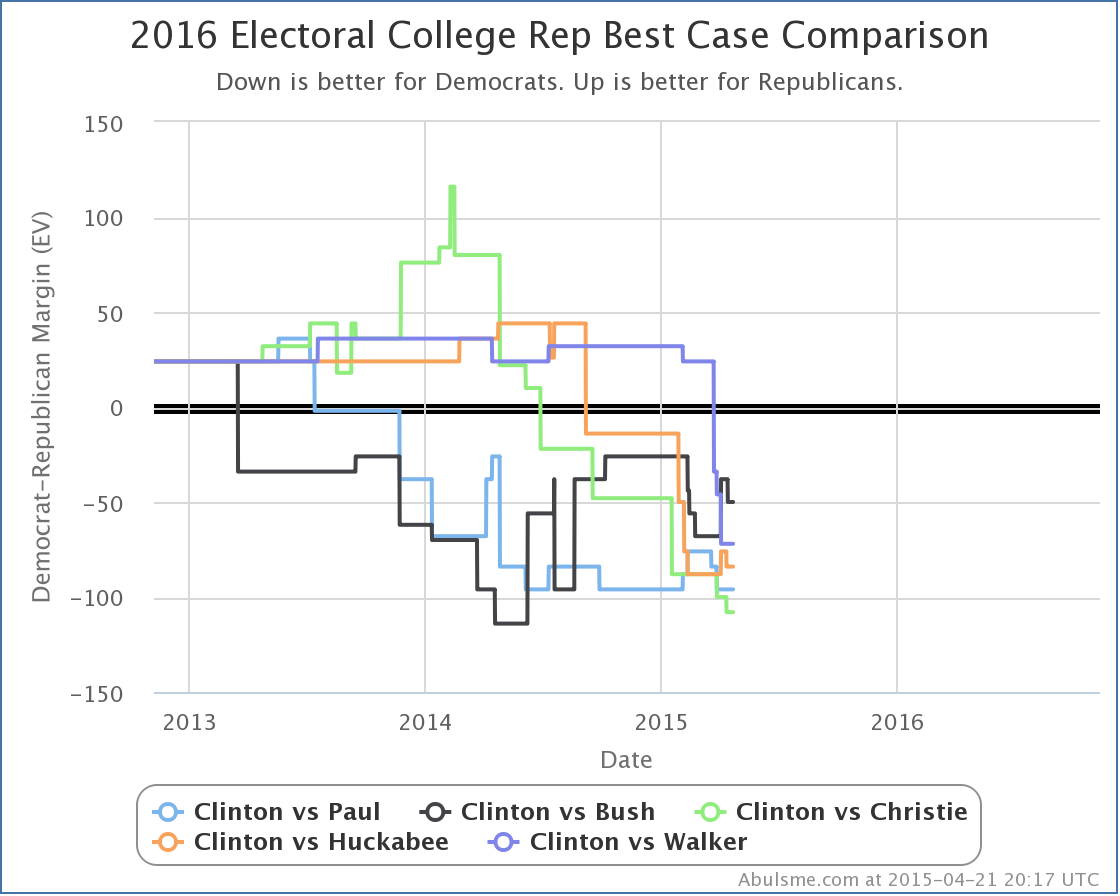
Since the 2014 elections, Paul is flat. Bush, Christie, Huckabee and Walker are all down. Which means that so far, NONE of these candidates have actually been expanding the list of states that are actually in contention. Now, some other metrics have shown some movement toward some of these candidates, but this is a critical one. The Republicans can’t win without first making more currently blue states close.
Clinton vs Ryan, Clinton vs Rubio, and Clinton vs Cruz are the #6, #7 and #8 best polled candidate combinations. They are way behind the five above in polling quality by my metric, but feel free to take a look if any of those candidates are of interest… just interpret the results with caution.
Note: This post is an update based on the data on my 2016 Electoral College Analysis Site. All of the charts and graphs seen here are from that site. Graphs, charts and raw data can be found there for the race nationally and in each state for every candidate combination that has been polled at the state level. In addition, comparisons of the best polled candidate combinations both nationally and each in each state are available. All charts above are clickable to go to the current version of the detail page the chart is from, which may contain more up to date information than the snapshots on this page, which were current as of the time of this post.
A bunch of new polls were added to my site today, but there was only one notable change. With a new Gravis Poll, Clinton’s lead in New Hampshire against Paul once again goes over 5%.
Easy come, easy go I guess. This decline happens as the only poll so far showing Paul in the lead here falls off the average. That poll is looking more like an outlier at this point. Even without that one poll though, if you squint there does seem to be a general trend in Paul’s direction over the last year or so. As usual, we’ll have to wait for more polls to see if Paul resumes closing the gap in the average, or if this is actually a reversal of the trend.
With New Hampshire now at a 6.0% Clinton lead in the average, it gets taken out of Paul’s “best case” scenario…
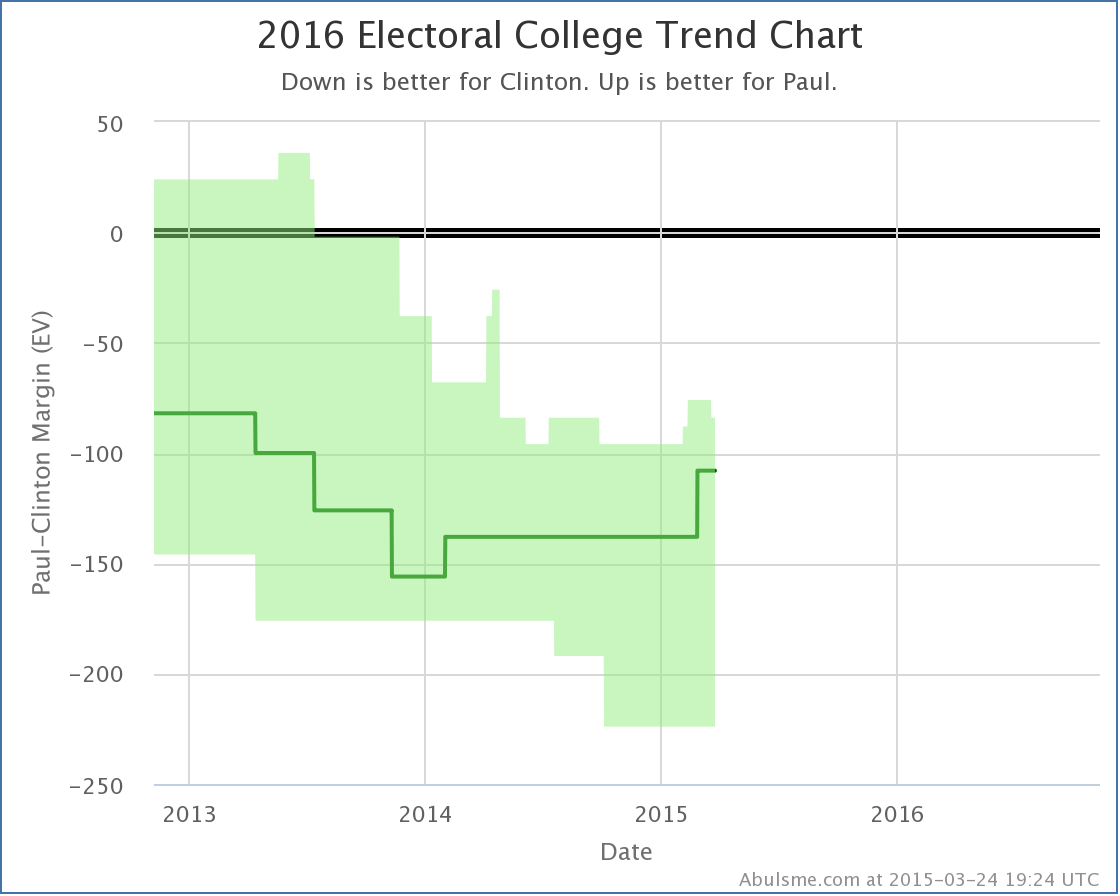
Looking at Paul’s “best case” as compared to the rest of the “5 best polled” combinations tracked here:
Since the November elections, Paul has improved his “best case” position from losing by 96 electoral votes, to losing by only 84 electoral votes. Bush, Christie and Huckabee meanwhile have actually all had their best cases get worse in this timeframe. (Ryan has held steady, but has said he isn’t running and hadn’t been polled much.)
What about Cruz you say? Didn’t he just announce? And Walker? He’s still getting lots of buzz! Or maybe even Rubio? Well, the polling on those combinations still isn’t that great and don’t make my top five. But they are improving. Right now Clinton vs Cruz is the 6th best polled combo, Clinton vs Rubio is at #7, and Clinton vs Walker is at #8. You can click through on those links if you want to see what those look like at the moment. But the amount of state level polling on those guys still isn’t that great, so take what you see there with a big lump of salt.
(And if you go even deeper and look at combos with non-Clinton Democrats, bring a whole wheelbarrow of salt.)
Note: This post is an update based on the data on my 2016 Electoral College Analysis Site. All of the charts and graphs seen here are from that site. Graphs, charts and raw data can be found there for the race nationally and in each state for every candidate combination that has been polled at the state level. In addition, comparisons of the best polled candidate combinations both nationally and each in each state are available. All charts above are clickable to go to the current version of the detail page the chart is from, which may contain more up to date information than the snapshots on this page, which were current as of the time of this post.
We are 634.6 days from the first polls closing as I write this message. But yet here I am with the fourth of these updates in a two week period. I honestly didn’t expect the polling to be picking up quite this fast. But it seems to be. So be it.
Please keep in mind that everything here describes where things are now, and how things are trending NOW. We are far enough from the 2016 election that nothing here represents a prediction for what will happen in 2016. But knowing how things look now and observing the trends still provides interesting insight.
Today I added new polls from CNU in Virgina and from Bloomberg / Saint Anselm / Purple in New Hampshire. These resulted in changes worth noting* for three candidate pairs. I’ll review them quickly in order of the magnitude of the change.
Click on any of the charts to go to the election2016.abulsme.com site for more detail.
Clinton vs Huckabee
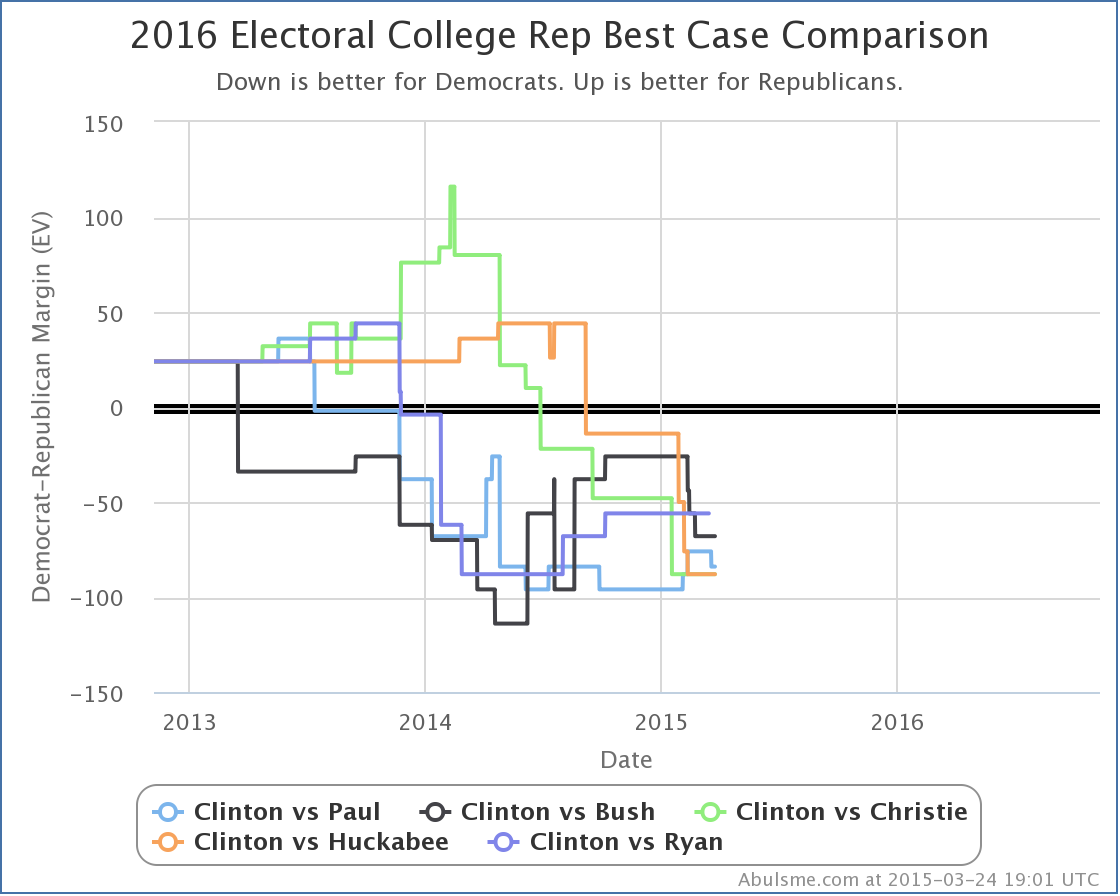
Huckabee had only been hanging on to the “Weak Clinton” category in Virginia by virtue of the fact that I pad my poll average with previous general election results if there are not yet five actual polls between the candidates in question. With the third poll directly pitting Clinton vs Huckabee in Virginia, Huckabee falls much further behind, and Virginia now seems to slip out of reach. Huckabee’s best case vs Clinton therefore gets worse.
Without Virginia in the mix, Huckabee’s “best case” (where he wins all the states he is ahead in, plus all of the states where Clinton is ahead by less than 5%) is now to lose to Clinton by 76 electoral votes.
This change also drops the “tipping point” (which represents how much of a uniform shift in polling across all states would be needed to flip the election) further in Clinton’s direction. The tipping point state for Clinton vs Huckabee is now Minnesota, where Clinton is ahead by 6.8%.
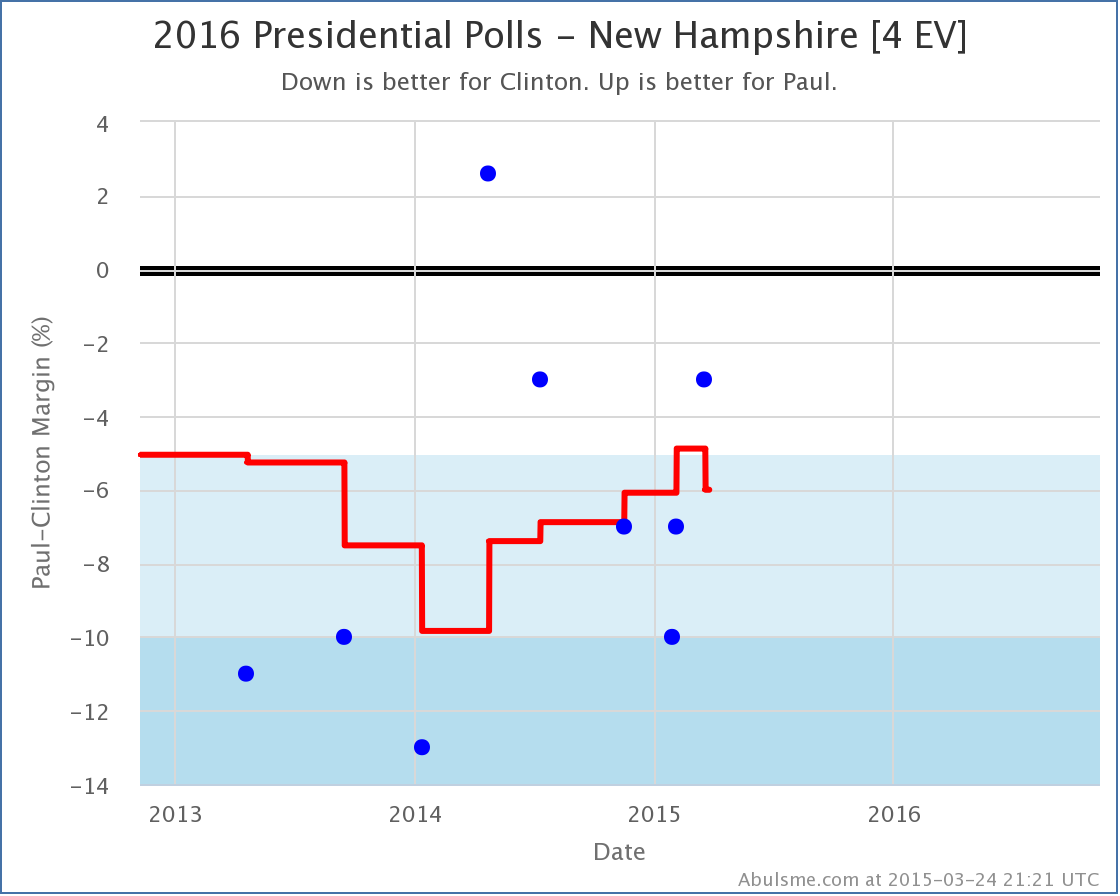
Clinton vs Paul
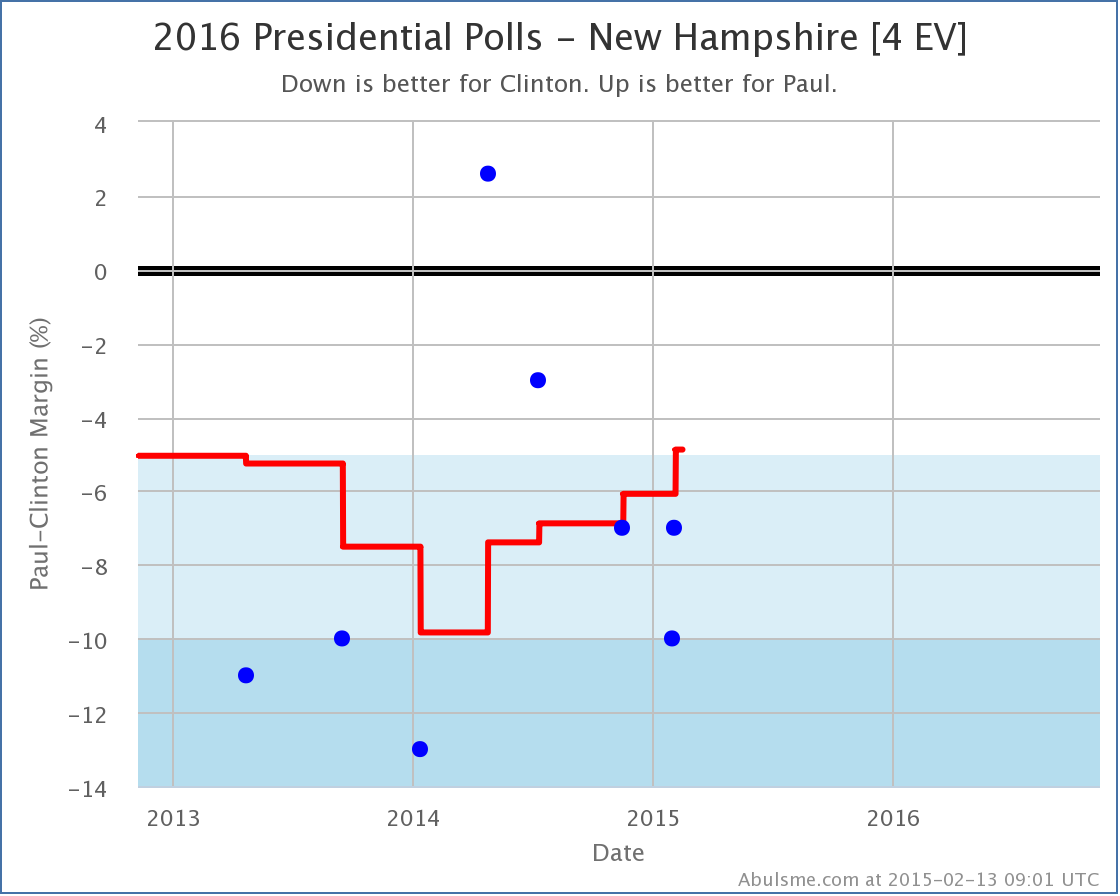
This chart of Clinton vs Paul polls in New Hampshire is interesting, and actually shows one of the disadvantages of using an average of the most recent polls, rather than some more sophisticated sort of trend smoothing. Paul’s average vs Clinton has been steadily improving for the last year. But if you look at the individual polls, you see that this is because some really bad polls for Paul from 2013 and early 2014 were “aging off” the average, being replaced by some relatively good polls for him from the last year, including one where he was actually ahead!
But if you actually look at the trend of the individual polls since then, the trend has been back toward Clinton. With a straight up poll average, this trend in the last five polls is invisible. We just know that the average of the newest five is higher than that of the five most recent polls not counting the brand new one. Basically, a poll where Paul was behind by 13% was replaced by a poll where Paul was only behind by 7%, so the average moved toward Paul… even though there may be a different trend if you look within the five polls actually used in the average.
If the trend in the last five polls is real (it may or may not be) then it would not be surprising to see New Hampshire fall back into “Strong Clinton” territory with the next poll.
For now though, we grant Paul the possibility of winning New Hampshire in his “best case” which is now to lose to Clinton by only 88 electoral votes.
Clinton vs Bush
No changes in best, worst or expected case for Bush against Clinton, but since the tipping point in this case was Virginia, and we had polling in Virginia, it is not unsurprising that the tipping point here moved, if only a little.
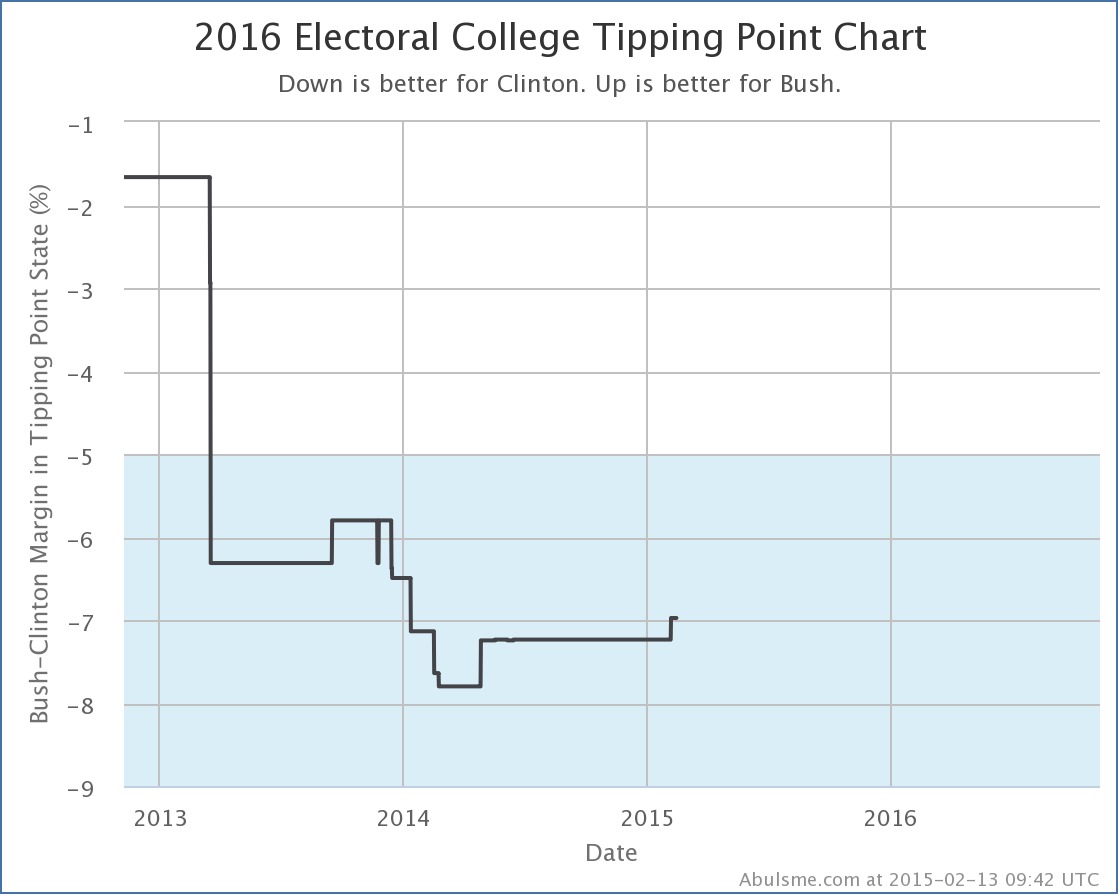
The tipping point here remains Virginia, but Bush moves from being behind 7.2% there, to only being behind by 7.0%.
And that is it for today’s update. Please explore election2016.abulsme.com to find more detail and interesting bits and pieces.
* For now, “Changes worth noting” are when the best, worst, or expected cases for one of the five best polled candidate pairs changes, when the tipping point changes by at least 0.1% for one of those candidate pairs, or if a new candidate pair becomes “best polled” or replaces one of the current five pairs on the list.


|
Romney |
Obama |
| Romney Best Case |
270 |
268 |
| Current Status |
206 |
332 |
| Obama Best Case |
190 |
348 |
There were no calls between 02:45 UTC and 03:00 UTC. Between 03:00 UTC and 03:15 UTC Utah was called for Romney, and New Hampshire was called for Obama. New Hampshire is of course the one that matters. It was one of the close states that Romney really could have used…
Romney’s best case is now hanging on to a win by the barest possible margin. He can afford to lose Maine’s 2nd congressional district, making this a 269-269 tie, which would give us Romney/Biden. But he can’t lose ANY of the other close states… unless he pulls a big surprise and wins a state where he was behind by more than 5% in the polls.
Starting at 190 with the areas he was ahead by more than 5%:
- Nebraska 2nd (1): 3.8% Romney lead
- North Carolina (15): 1.4% Romney lead
That gets Romney to 206. Then we have:
- Iowa (6): 2.0% Obama lead
- Florida (29): 2.3% Obama lead
- Colorado (9): 2.4% Obama lead
- Maine 2nd (1): 2.8% Obama lead
- Virginia (13): 3.6% Obama lead
- Nevada (6): 4.8% Obama lead
The only thing on that list Romney can afford to lose is Maine’s 2nd.
We only need any one of those remaining states called for Obama, and Obama wins his second term.


Two states changing categories today, both moving toward Obama. Both Romney’s “Best Case” line and the “Current” line reflecting the current lead in the polls, have now moved significantly back toward Obama since Romney’s peak around October 12th. These gains are still somewhat tenuous for Obama, which we’ll get into in a bit. For the moment though, lets look at the individual states:

First up New Hampshire. Just three days ago Romney pulled into a slight lead in my five point average in New Hampshire. The very next poll pulls the average back over to Obama’s side of the fence. Having said that, the new poll, showing a 9% Obama lead, looks like it might end up as an outlier. We’ll need more polls to determine if there is real movement, or just noise. Even with that point Obama only has a 0.9% lead. So New Hampshire is still very close. A little on one side of the line versus a little on the other side of the line really doesn’t change all that much.

In Pennsylvania a couple of days ago what seemed like an outlier in Romney’s favor aged out of the five poll average. Today it was replaced by what looks like an outlier in Obama’s favor. This is enough to bring Obama’s lead to 5.2% in Pennsylvania. That is enough for me to move Pennsylvania to “Weak Obama” and take out of Romney’s best case scenario. As with New Hampshire’s move, this move is influenced by a poll that smells a little like an outlier. So don’t be surprised if Pennsylvania slips back under the 5% mark as more polls come in.
So where does this put the summary:
|
Romney |
Obama |
| Romney Best Case |
295 |
243 |
| Current Status |
219 |
319 |
| Obama Best Case |
191 |
347 |
This looks pretty good for Obama, right? He’s building his lead back in, and slowly but surely undoing the damage from that first debate? Just looking at the charts, it looks like on the “current” line, Obama is about half way back to his peak at the end of September. On the “Romney’s best case” Obama’s gained back about a third of his losses. In terms of these numbers, Obama is better off than the spot at the end of August where I had once called a Romney peak.
At that point in time I mentioned that even at that Romney peak, Obama was in a very solid position. Romney would have to flip a whole bunch of states where Obama was ahead in order to win. It was a tall order. Since we’re right there again, so Obama is pretty solid, right?
Right? Well on the surface. But looking at that alone hides a bit. The key is that a lot of the states that are on Obama’s side of the winning line are just BARELY there. So lets look again at all of the close states:
- North Carolina (15 ev): 2.0% Romney lead
- Virginia (13 ev): 0.2% Romney lead
- Florida (29 ev): 0.4% Obama lead
- New Hampshire (4 ev): 0.9% Obama lead
- Ohio (18 ev): 1.2% Obama lead
- Colorado (9 ev): 1.2% Obama lead
- Iowa (6 ev): 2.2% Obama lead
- Wisconsin (10 ev): 3.8% Obama lead
My line is always that anything under a 5% lead can easily disappear with essentially no notice. Of the 8 states with margins under 5%, five are actually closer than 2%. Three are closer than 1%! These are a bunch of really close states that really could flip back and forth.
With all the states he is ahead in, Obama wins 319 to 219. That is 50 electoral votes more than he needs to win! But if you just get a 1.3% uniform move in the polls across the close states, then Florida (29 ev), New Hampshire (4 ev), Ohio (18 ev) and Colorado (9 ev) all flip to Romney. That is 60 electoral votes. With that 2% move, Romney wins 279 to 259.
1.3% is not a big move. Obama has the lead. But barely. A stupid statement at a critical time. A random mistake that comes off badly. Some national or international news that just doesn’t reflect well. Changes in enthusiasm that causes Democrats to turn out less than Republicans. Any of those could move things by 1.3%. 1.3% is nothing. 1.3% can evaporate almost instantly if the right things happen.
The movements since the second debate have been mainly in Obama’s direction. Consensus seems to be that Obama also “won” the third debate. After the disaster in the first debate the Obama campaign seems to have hit their stride again. Things seem to be moving in their direction. If that continues for the next two weeks through election day, Obama should end up with a pretty comfortable victory. If things hold steady, or if Romney has a few good news cycles, then we may indeed end up waiting up late on election night to resolve a tight election in Ohio that will determine the outcome of the election.
Note: I finished my daily scan of polls a little over 10 hours prior to making this post, so new polls announced since then will be reflected in tomorrow’s update rather than today’s. I normally try to make the blog post right after finishing the scan on days where states change categories, but this time I just needed to get a little sleep in between. Sorry about that. :-)
Note: Chart and map from the Abulsme.com 2012 Electoral College Prediction page. Both assume Obama vs Romney with no strong third party candidate and show polling as it currently exists. Things will change before election day. On the map red is Romney, blue is Obama, gold states are too close to call. Lines on the chart represent how many more electoral votes a candidate would have than is needed to tie under several different scenarios. Up is good for Obama, Down is good for Romney.
[Edited 2012 Oct 23 22:12 to add final note, fix a wording error, and correct a mistake where I had 2.0% in a place that should have said 1.3%.]


One state changes categories today, and it is a move toward Romney:

Romney had a lead in the five poll average in New Hampshire early in the year… back in January and February… but since then Obama has maintained a consistent lead in New Hampshire, sometimes close, sometimes considerable. Until now. After Obama peaked at a 9.9% lead at the end of September, Romney now takes a 0.9% lead in New Hampshire. And yes, for those asking, that does include one out of five polls with an end date after the second presidential debate.
So, new summary:
|
Romney |
Obama |
| Romney Best Case |
315 |
223 |
| Current Status |
252 |
286 |
| Obama Best Case |
191 |
347 |
While still not as well off as his peak on October 12th, Romney has been moving some states in his direction the last couple of days. While Obama is still ahead, the race remains extremely close. Today let’s once again look at the state of the five poll average in all of the close states. In order by the strength of Romney’s position:
- Virginia (13 ev): 2.4% Romney Lead – 2/5 polls after 2nd debate
- North Carolina (15 ev): 2.0% Romney Lead – 2/5 polls after 2nd debate
- New Hampshire (4 ev): 0.9% Romney Lead – 1/5 polls after 2nd debate
- Florida (29 ev): 0.4% Romney Lead – 5/5 polls after 2nd debate
- Ohio (18 ev): 1.6% Obama Lead – 4/5 polls after 2nd debate
- Colorado (9 ev): 2.6% Obama Lead – 2/5 polls after 2nd debate
- Iowa (6 ev): 2.8% Obama Lead – 2/5 polls after 2nd debate
- Pennsylvania (20 ev): 2.8% Obama Lead – 0/5 polls after 2nd debate
- Wisconsin (10 ev): 3.1% Obama Lead – 3/5 polls after 2nd debate
With just the states Romney is ahead in by more than 5%, he gets to 191 electoral votes.
Add the four states he is ahead in by margins less than 5%, and he gets up to 252 electoral votes. Those four states are all close. They could slip away. But if Romney holds them, that leaves him 17 electoral votes short of a tie, and 18 electoral votes away from an outright win.
What is the easiest way to get there? Yup… Ohio. Obama is still ahead in Ohio, but by a razor thin margin. And that margin has actually decreased from 2.8% before the 2nd debate to 1.6% now. If Romney pulls ahead in Ohio, that gets him to 270 electoral votes… the bare minimum needed to win outright without throwing it to the House.
I classify all nine of these states as states that could easily go either way. 5% is a margin that can disappear in a day or two with one candidate or another having a bad news cycle. Despite Obama’s razor thin lead at the moment, this really is anybody’s game right now. Obama is one bad day away from actually being behind for the first time.
Obama’s performance in the second debate may have stopped his slide and prevented Romney from taking a definitive lead, but so far at least, we don’t have evidence of Obama pulling ahead in a way that would return him to anything close to his late-September numbers. Instead, we have Obama with a small but real lead, and Romney within striking distance.
Just over 48 hours until the third debate, and then we’re in the final stretch…
Note: Chart and map from the Abulsme.com 2012 Electoral College Prediction page. Both assume Obama vs Romney with no strong third party candidate and show polling as it currently exists. Things will change before election day. On the map red is Romney, blue is Obama, gold states are too close to call. Lines on the chart represent how many more electoral votes a candidate would have than is needed to tie under several different scenarios. Up is good for Obama, Down is good for Romney.


Three states changing categories today. All three moving toward Romney. As usual, lets look at them from smallest to largest in electoral college strength:

First up, New Hampshire. Before the first debate Obama was up to a 9.9% lead here. Now with 4/5 polls after the debate, that lead slips to 4.6%. This is in line with the drops we’ve seen in a bunch of other states. Obama still has a lead here, but it is now small enough that it could easily slip away. New Hampshire has been here before. It had only spiked to a big Obama lead a few weeks ago, when Romney was at his nadir. So this is perhaps New Hampshire just returning to form as a close state leaning slightly toward Obama.

Last time Virginia changed status, I noted that it had been bouncing between Lean Obama and Weak Obama, but perhaps it was ready to break out of that pattern. Indeed it has. This time Obama’s lead continued to drop. After peaking at 5.1% a few days before the debate, Obama’s lead slowly disappeared, and with today’s addition, the five poll average now stands at a 1.0% Romney lead. Romney has been ahead before in Virginia, but it was very short lived. The question of course is if this time he can hold the lead or if Virginia will revert to “normal” which is a narrow Obama lead.

Just yesterday Obama had retaken a very slight lead in the Florida five poll average. Today that slips away, and with some relatively strong polls, Romney ends up with a 1.8% lead at the moment. Florida is still very close. All the states we have talked about today are very close. But the momentum here, as in most other states in the last week and a half, has been toward Romney.
So, the revised summary:
|
Romney |
Obama |
| Romney Best Case |
337 |
201 |
| Current Status |
257 |
281 |
| Obama Best Case |
191 |
347 |
We are still seeing what is fairly obviously fallout from the first debate. It has just taken different amounts of time for there to be enough polling in different states to show it. All considered, it looks like we have seen one of the biggest debate effects ever in a presidential election. The level of self-inflicted damage by Obama is amazing.
Of course, when this started, Obama had a substantial lead. So even after all of this, Obama is still ahead and is still the favorite. Surely we must NOW be close to a ceiling for Romney, right? Well, maybe not if Obama doesn’t redeem himself in the next debate. But assuming the absence of another catastrophic fail, it seems like sometime soon we’ll need to start seeing some reversion to the mean, which in this case would mean a bit of strengthening for Obama.
I don’t have the time today to again do a rundown of the current margins in all the swing states, but suffice it to say that if Romney holds on to all of the states he is currently ahead in, Romney only needs 13 more electoral votes to win. He can get that in a number of ways at this point. The easiest way is still to win Ohio (18 ev). Romney is currently behind in Ohio by only 2.2%. Ohio is within reach. Romney just needs to convince a few more people, or energize greater turnout.
Alternately, and a lot more fun, Romney could win Iowa (6 ev) where he is currently behind by 3.2% and Nevada (6 ev) where he is currently behind by 1.6%. That would result in a 269 to 269 electoral vote tie. Assuming no faithless electors, that would throw the election into the House of Representatives, where Romney would almost certainly win.
The last time a Presidential election was thrown to the house was 1824. That would be so much fun to watch happen!
It is still unlikely though. But a guy can hope!
Bottom line though, right now Obama is ahead, but only by the very slimmest of margins. If Romney can hold on to his gains from the last couple of weeks (Obama actually peaked a little before the first debate) and move things just a LITTLE more, then he can win this.
I am quite sure Obama would like the Romney “debate bounce” to be over now.
We’ll start seeing polls that factor in the VP debate any time now. It is unlikely to have as profound an effect as the first debate and therefore I don’t anticipate Obama erasing Romney’s recent gains. But perhaps the bleeding will finally stop.
Note: Chart and map from the Abulsme.com 2012 Electoral College Prediction page. Both assume Obama vs Romney with no strong third party candidate and show polling as it currently exists. Things will change before election day. On the map red is Romney, blue is Obama, gold states are too close to call. Lines on the chart represent how many more electoral votes a candidate would have than is needed to tie under several different scenarios. Up is good for Obama, Down is good for Romney.


Three states change categories today. Two states move toward Obama, one state moves toward Romney. But Romney’s state is bigger than the other two combined, so he wins the day. Lets look at them each, from smallest to largest:

The five poll average in New Hampshire had been generally sticking at an Obama lead less than 5%, but with two related polls (both from WMUR/UNH with and without pushing leaners to express a preference) showing Obama with a 15% lead in the state, the average spikes upward These data points may well prove to be outliers, they certainly seem like it initially, but for the moment they move Obama’s lead well out of the “Leaning” category, and indeed almost all the way to the “Strong” category. For the moment though, Obama’s lead stands at 9.8% and we put New Hampshire into the “Weak Obama” category. (Note that even if we’d only counted one of these two polls, the state would still end up as Weak Obama.) This has the effect of moving New Hampshire out of Romney’s reach for the moment.

In Nevada things look less like they are being influenced by an outlier. Instead three of the last five polls in the state now show leads over 5% and the average now jumps to a 5.7% Obama lead. There does seem to be some real movement toward Obama in those last few polls. Will it last? Who knows. But for the moment Nevada also moves out of Romney’s reach as well.
This would all look pretty bad for Romney today, except for the third state:

Florida, where the five poll average had just hit 5.0% exactly last Thursday causing me to move Florida to “Weak Obama”, now drops back below 5% again, putting Florida back into the much more familiar “Weak Obama” category where it has been for most of the last year. The spike upward appears to be over, and Florida has reverted to form as being a close state. Well, sorta close. The five poll average still has Obama at a 4.1% lead in Florida, which is not insubstantial. And he has been “slightly ahead” in the state for most of the year. But this is still a small enough lead that given the right sorts of events it could disappear quickly. So once again, I list Florida as being in play.
And that makes the current status:
|
Romney |
Obama |
| Romney Best Case |
263 |
275 |
| Current Status |
191 |
347 |
| Obama Best Case |
191 |
347 |
So Romney’s best case if he wins all the close states… now once again including Florida… is still to loose, but now by a pretty small margin. Obama 275 to Romney 263. If he can get Nevada back in play and win that, we could have a 269-269 tie, which would probably end up going for Romney in the House. A tie would be a lot of fun. Still an unlikely scenario though.
In general, to win, Romney has to win Florida (29), North Carolina (15), Virginia (13), Colorado (9) and Iowa (6) for sure. All of those are “must win”. And Romney is currently behind in all of them to various degrees. They are all pretty close though and flipping them is not unrealistic. On top of that he then needs to get at least one of the big states in the “Weak Obama” category, or two of the smaller ones. Those are all states where Romney is behind by more than 5%.
Although the map looks a bit better than it did a few days ago, it is still a very bleak picture for Romney at the moment.
Note: Chart and map from the Abulsme.com 2012 Electoral College Prediction page. Both assume Obama vs Romney with no strong third party candidate and show polling as it currently exists. Things will change before election day. On the map red is Romney, blue is Obama, gold states are too close to call. Lines on the chart represent how many more electoral votes a candidate would have than is needed to tie under several different scenarios. Up is good for Obama, Down is good for Romney.
Edit 2012 Oct 3 09:44 UTC to add final note.


Chart and map from the Abulsme.com 2012 Electoral College Prediction page. Both assume Obama vs Romney with no strong third party candidate. Both show polling as it currently exists. Things will change before election day. On the map red is Romney, blue is Obama, gold states are too close to call. Lines on the chart represent how many more electoral votes a candidate would have than is needed to tie under several different scenarios. Up is good for Obama, Down is good for Romney.
One state moves today, and once again it is a move in Romney’s direction:

New Hampshire gets a flurry of polls at the end of June and it becomes clear that the race has gotten a lot closer since the last round of polling in May. Obama’s lead in the five poll average drops under 5% to 3.4%, so I once again classify New Hampshire as too close to call, which means I now include the possibility of winning New Hampshire in Romney’s best case:
|
Romney |
Obama |
| Romney Best Case |
311 |
227 |
| Current Status |
206 |
332 |
| Obama Best Case |
170 |
368 |
As we near the end of June, we see that it has been a very good month for Romney in this analysis.
A month ago on May 29th, Romney’s best case was to tie (269 to 269). His best case is now to win by 84 electoral votes (311 to 227). Slowly but surely, he has been moving “Weak Obama” states where Obama had a lead over 5%, into the zone where those states are close enough to be within reach. Michigan (16), Virginia (13), Colorado (9), and New Hampshire (4) all made this move in the last month.
He has also made some movement in reducing Obama’s best case by increasing his lead in Arizona (11). On May 29th Obama’s best case was to win by 220 electoral votes (379 to 159). Now it is to win by only 198 electoral votes (368 to 170).
So Romney is doing what he needs to be doing, getting more states into play, giving himself many more “paths to victory” and thus a lot more flexibility into how to attack the electoral college.
It is worth noting though that our third line, the one representing what happens if everybody wins every state where they are even slightly ahead in the polls, has not moved at all in the last month! A month ago it showed Obama winning 332 to 206, and it shows the same thing today. So while Romney has been reducing Obama’s lead in a variety of states, he hasn’t yet started moving states “over the line” toward him.
Perhaps in July.
|
|


