- MT @parislemon: Racing against my inbox. Losing. #
- Reading – Mystery Man Behind The Anti-Muslim Film Blamed For Attacks (Eric Lach) http://t.co/O2kZiIuJ #
- Reading – Verizon iPhone 5 Will Not Offer Simultaneous Voice and Data (Jordan Golson) http://t.co/gEdPc5OR #
- Reading – In Fact It’s Cold As Hell: Mars Isn’t As Earthlike As It Might Look (Jason Major) http://t.co/rU02enEj #
- Reading – Conservatives bash media for being mean to Mitt Romney (Greg Sargent) http://t.co/qIe9rN4V #
- Reading – Apple Promises iPhone 5-Compatible HDMI and VGA Cables Coming Soon (Jordan Golson) http://t.co/sH4VHj1T #
- Reading – Poll Analysis: The post-convention story (Darryl, HorsesAss) http://t.co/uFLBB86U #
- Reading – How will Republicans respond to Fed action? (Greg Sargent) http://t.co/mvgUsCXR #
- Reading – To Be Presidential, Romney Must First Be Truthful (Jonathan Alter) http://t.co/zNMWzeOv #
- EC Update for Fri Sep 14 Done. Polls added in MN VA OH FL MO NH CO. VA changes categories again. Blog post soon. #
|
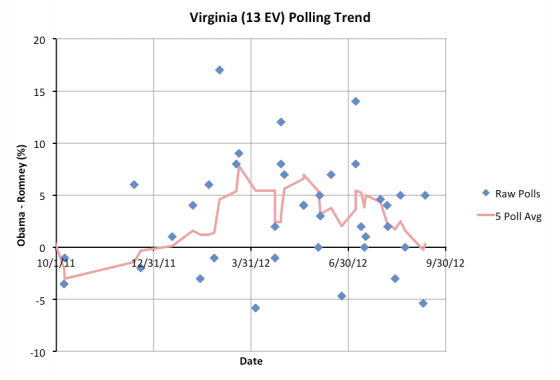
If this one stays as close as it is, it will be annoying to catalog the flips between now and election day between just barely one way and just barely the other way. In any case, Virginia, which moved from Leaning Obama to Leaning Romney in my five poll average on Wednesday, now moves right back where it was with the next new poll: This represents a move in the five poll average from a Romney lead of 0.3% to an Obama lead of 0.3%. I can’t emphasize enough that both of these results just mean a super tight race in Virginia at the moment. It is too close to call. In general I say that any state where the lead is less than 5% should be considered a toss up, simply because that small a lead can disappear quickly. This is why I color all those states the same color on the map, regardless of who is slightly ahead. But 0.3%? For all intents and purposes, the state is tied at the moment. Of course, you have to keep in mind what “the moment” is. My five poll average in Virginia currently goes back almost exactly a month. A lot has happened in that month. But we’ve only had five polls in Virginia. Two of the five polls have been since the conventions. If you average only those two… you get an 0.2% lead for Romney. Still too close to call. Virginia really does look like a toss up at this point. Never the less, since the five poll average is slightly on Obama’s side at the moment, we move it to Obama’s side for the “Current” line of our summary, which assumes the candidates win every state where they lead even slightly in the five poll average.
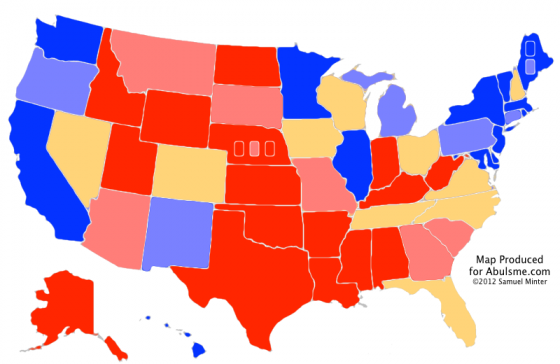
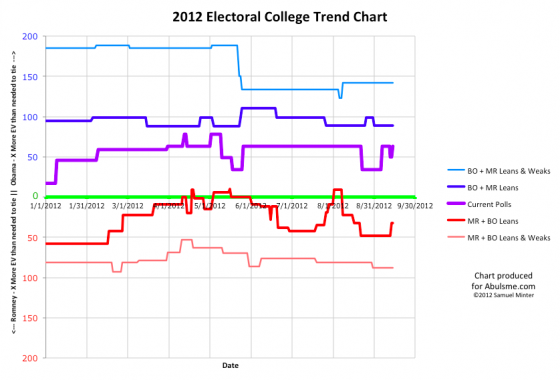
And where does this put us? It puts the current line right back at a 332 to 206 Obama win… Right where the model has been for all but a few scattered weeks since the beginning of April. More specifically 124 of the 167 days since April 1st have had the model at a 332 to 206 Obama win. That’s 74% of the time. The other 26% of the time things have looked a bit better for Romney, or a bit better for Obama… more often a little bit better for Romney… but then we’ve reverted right back to good ol’ 332 to 206. Even when states have come and gone from the set of close states, changing either Romney or Obama’s “best case” where they win all the close states, the model line in the middle has stayed remarkably stable. Compare this to my analysis exactly four years ago. If you look at the center line of that chart (a double pink/blue line rather than this year’s purple) you’ll see that between March and September it was moving all over the place. (In interpreting the old charts, keep in mind that last time around down was good for Obama, this time up is good for Obama.) This year things are just remarkably stable in comparison. It is also interesting to note that by this time four years ago the “lead” in the race had changed hands five times. (And it would change hands two more times before the election.) In comparison this time the lead has changed hands… well, never. Obama has been ahead from the start. But to show how things can change in the final stretch to November: On September 14th 2008, the current state of the polls was actually showing a 269-269 tie. Obama of course went on to win 365 to 173. In the last month and a half of the campaign, 96 electoral votes moved onto Obama’s side of the line. So big movements are possible in relatively short amounts of time. Even having said that though, if I had to make a bet right now, I’d bet on a 332 to 206 Obama win. This time around even when the polls move from that spot, they seem like they keep wanting to go back there. :-) Note: Chart and map from the Abulsme.com 2012 Electoral College Prediction page. Both assume Obama vs Romney with no strong third party candidate and show polling as it currently exists. Things will change before election day. On the map red is Romney, blue is Obama, gold states are too close to call. Lines on the chart represent how many more electoral votes a candidate would have than is needed to tie under several different scenarios. Up is good for Obama, Down is good for Romney. |
||||||||||||||


