To get the headline out of the way… for the first time since officially launching my 2016 electoral college polling tracking back in November, one of the Republicans with a significant amount of state level polling is within reach of Clinton. We now see a scenario where “if the election was held today” and the Republican was to outperform their polling… but by an amount that is not inconceivable… then the Republican would win.
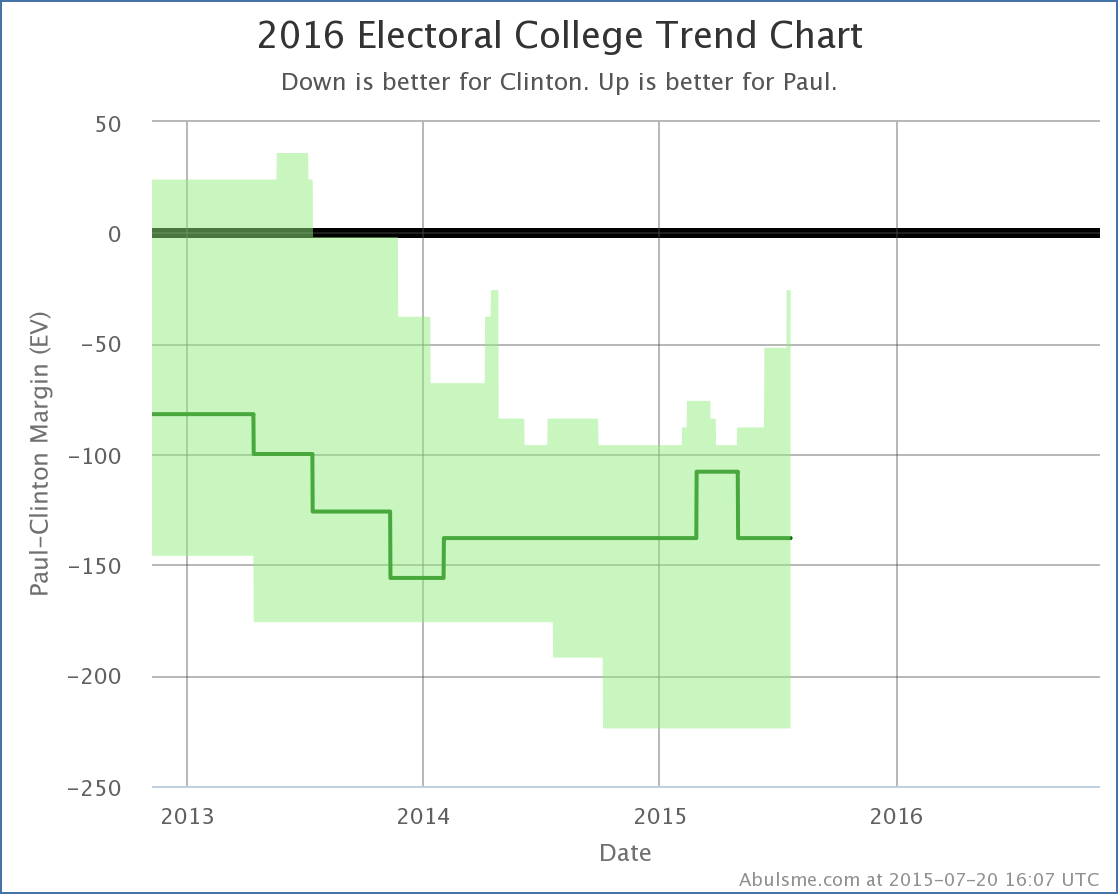
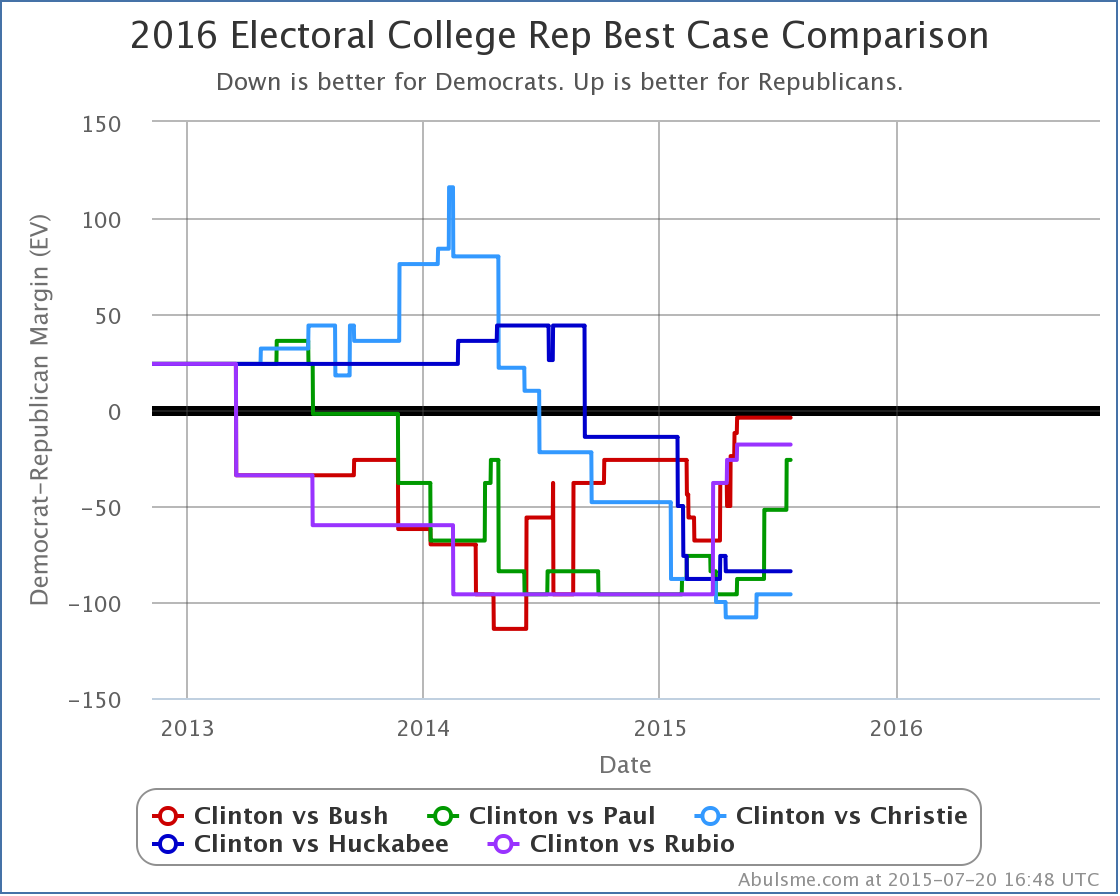
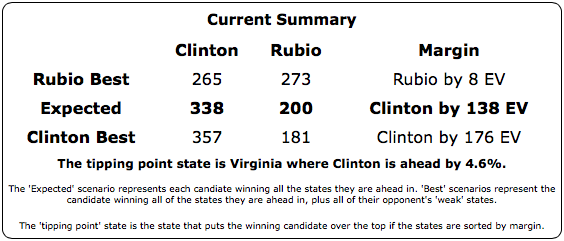
Specifically, while Clinton is still ahead against all five of the “best polled” Republicans challenging her (Bush, Rubio, Paul, Christie and Huckabee), if you give Rubio not only all the states he is already ahead in, but also all of the states where Clinton’s lead is less than 5%, then we end up with Clinton 265 to Rubio 273, a narrow 8 electoral vote victory for Rubio. The idea here is that a 5% lead is small enough that it can easily slip away under the right circumstances. So this does’t mean that Rubio is actually ahead, but it means that Rubio winning against Clinton is within the realm of the plausible.
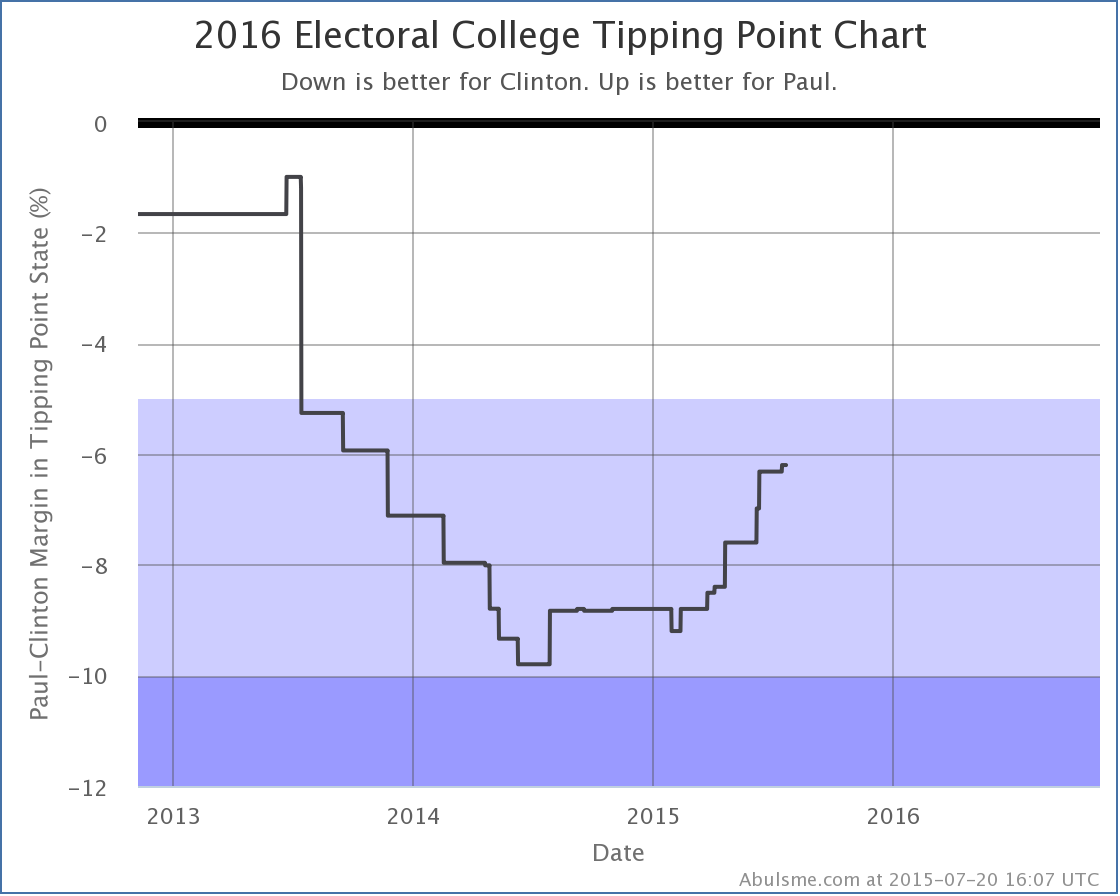
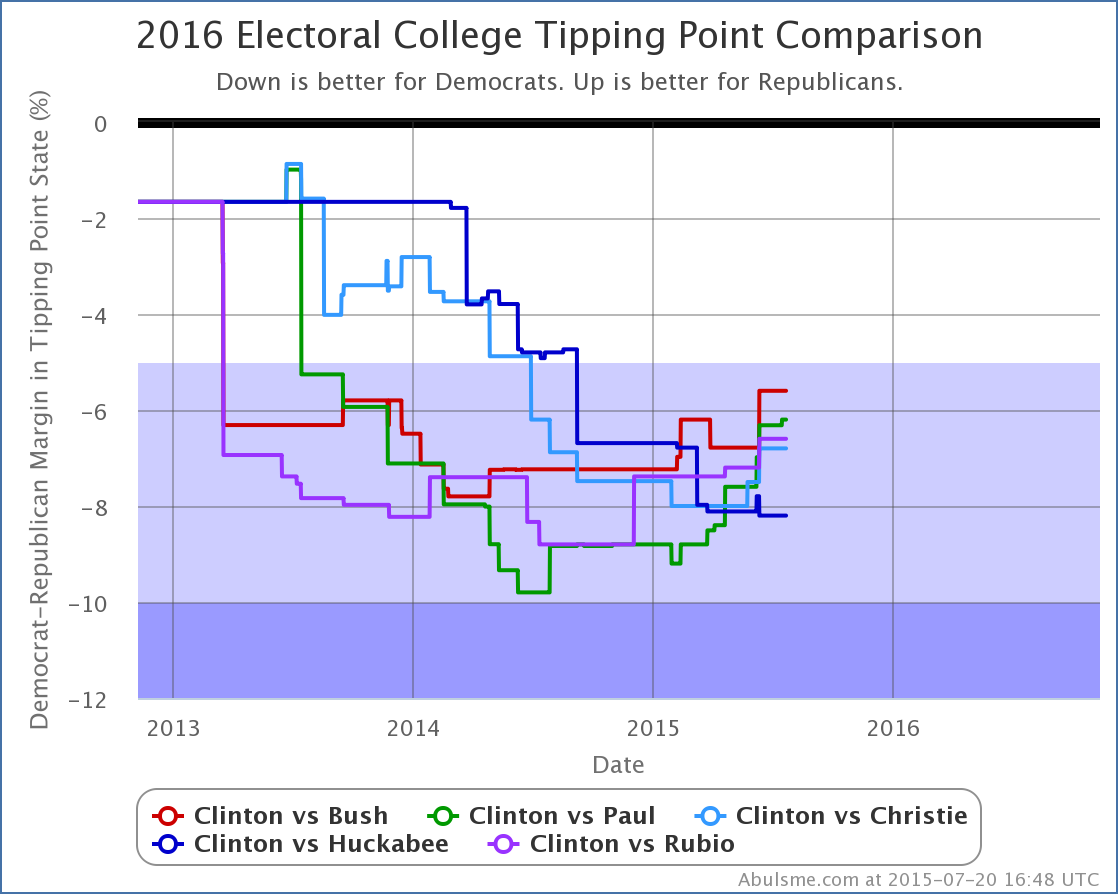
This also shows up in the “tipping point”, which now shows a Clinton lead of less than 5% for the first time since our launch:
Rubio is the first Republican to manage this, but trends have been against Clinton in recent months. Bush is just barely short of this marker. His best case is to lose by only 4 electoral votes. If he makes one more state close, winning will also be within range. And Paul isn’t that much further behind.
Yes, yes, Clinton is still significantly ahead, the best any Republican does if you just give them the states they are actually ahead in is to match Romney’s loss in 2012. But still, we now have at least one Republican where the polls are close enough that a victory is at least imaginable! So as per the title we have a race!
Now the state level details for those who want them…
Qunnipiac released the latest results in their Presidential Swing State Poll series today. There was a lot of buzz about how bad it was for Clinton, showing her behind to Bush, Walker and Rubio in Colorado, Iowa and Virginia. Indeed, this single poll looked really bad for her in all three states… in fact enough out of line with other recent results that it is very tempting to think it may just be an outlier rather than a real indication of a major change.
Of course, that is why we do poll averages. Looking at the averages, adding these new results moves things toward the Republicans, but nowhere near as dramatically as if you just looked at the Quinnipiac results in isolation.
Quinnipiac polled nine different candidate combinations, but I only look at the five combinations that have the best polling over all. So I’m not going to talk about the Sanders vs Bush matchup that Quinnipiac polled. Sorry. (That’s the 17th best polled candidate combination by the way.)
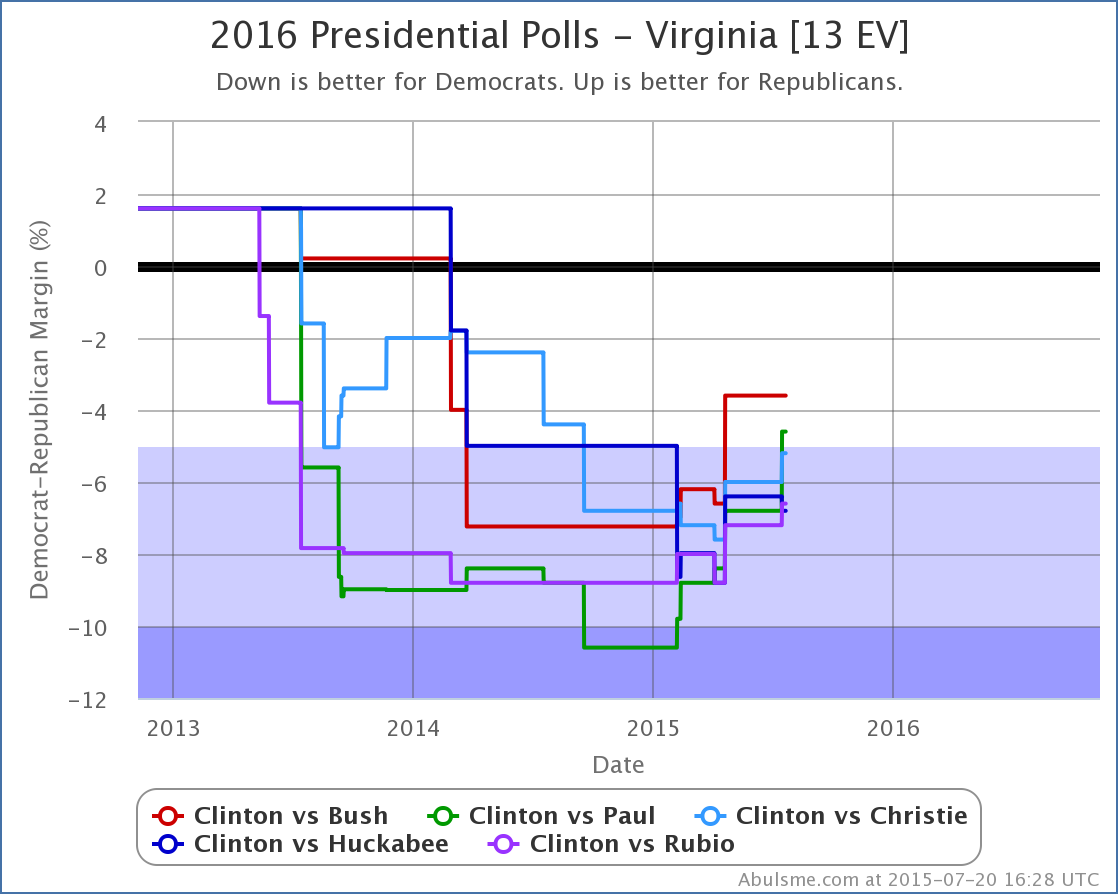
Anyway, of the five best polled combinations, only Clinton vs Rubio had any significant changes. Beyond the headline, lets look at the two states that actually changed status.
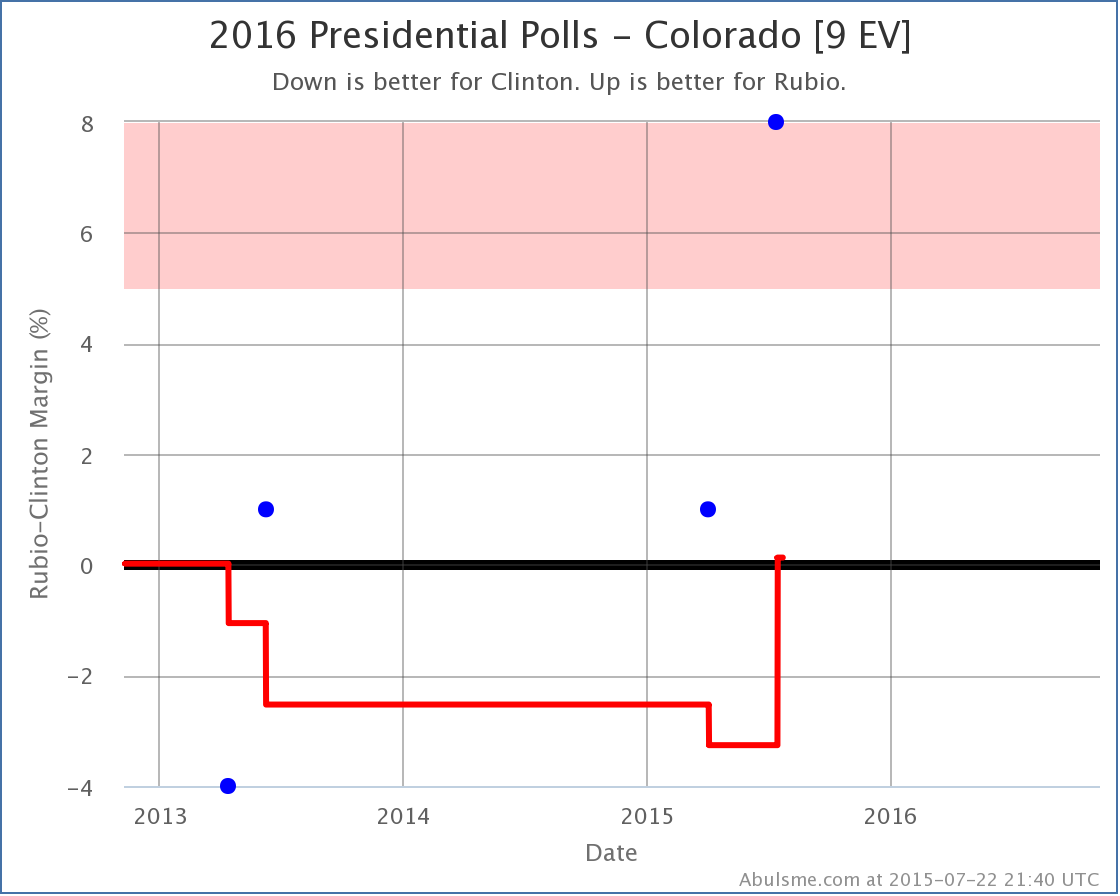
First off, Colorado:
 ‘
‘
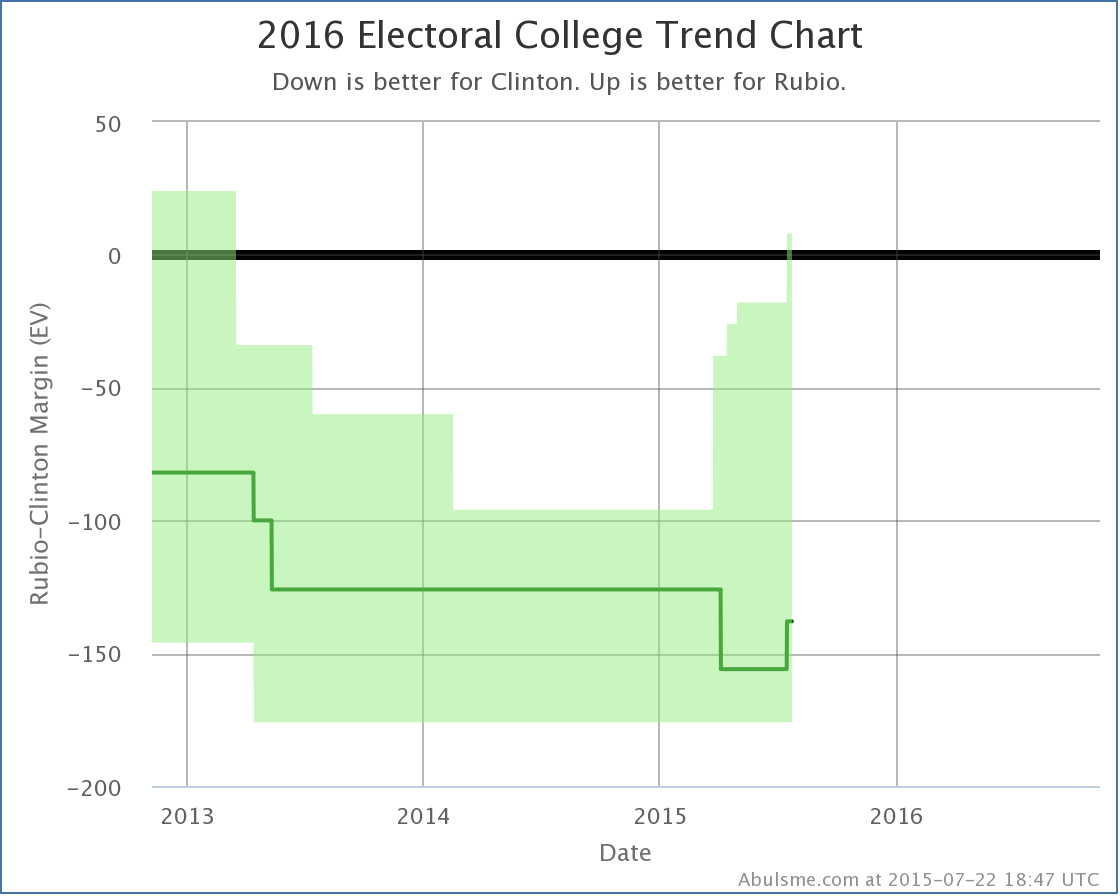
Clinton vs Rubio in Colorado has been very lightly polled… only four polls since the 2012 election, so the 2012 election results themselves are still included in the average. But the latest result is just enough to leave Rubio ahead by 0.1%. With Rubio now ahead in Colorado, the “expected” electoral college result moves to Clinton 338, Rubio 200, a 138 electoral vote margin for Clinton. (For comparison, Obama’s margin over Romney was 126 electoral votes.)
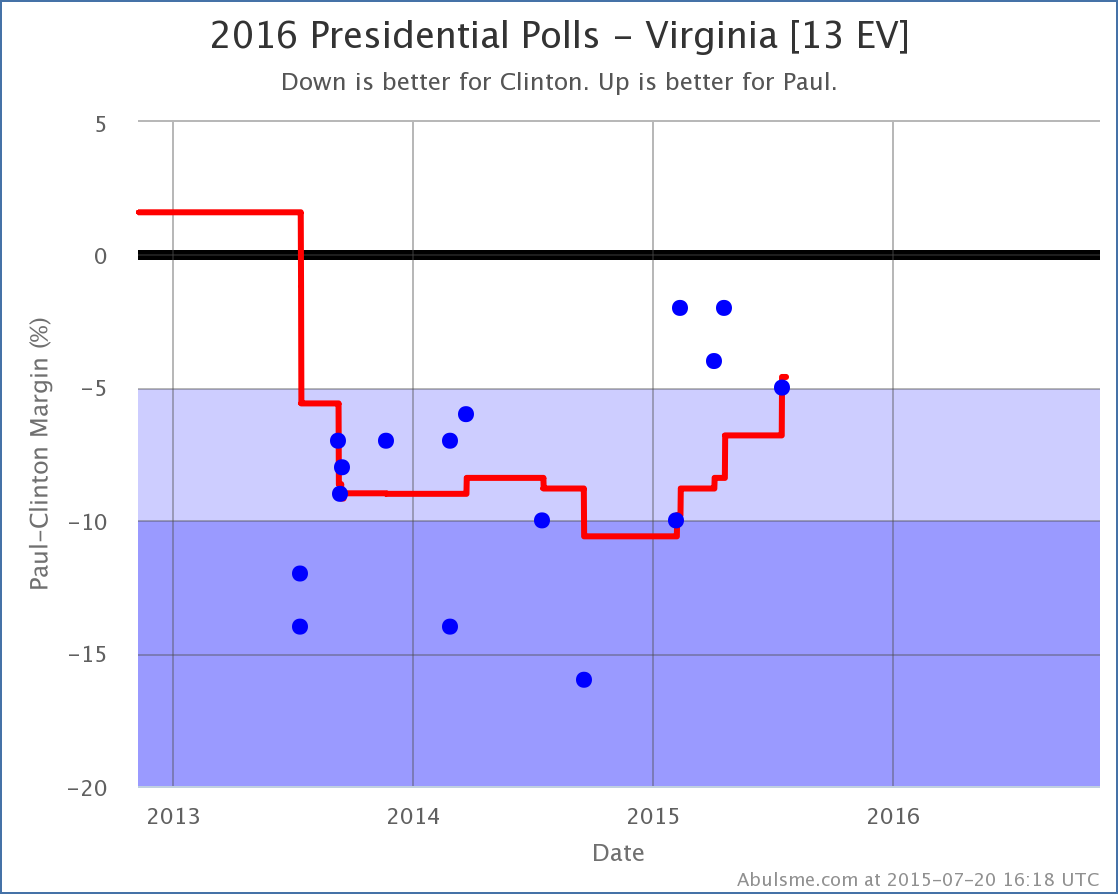
Virginia also changed categories:
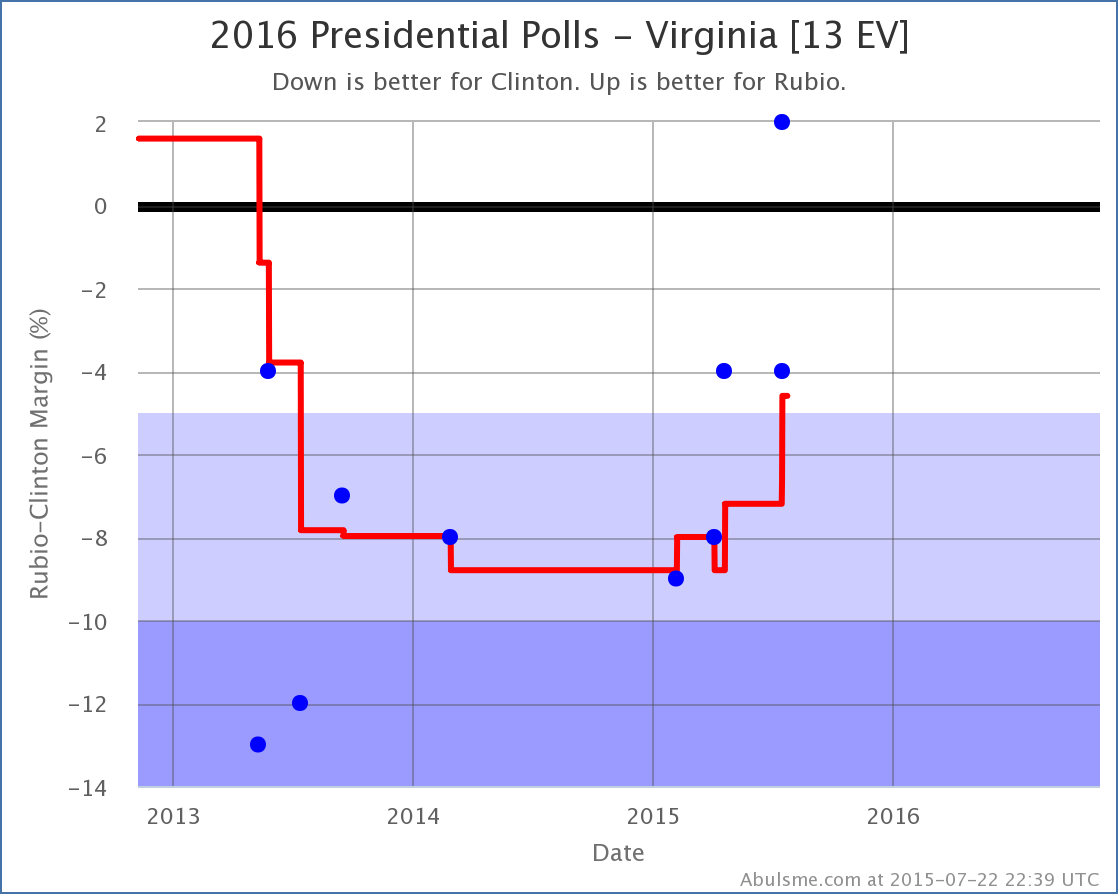
There have been quite a few more Clinton vs Rubio polls in Virginia than there were in Colorado. The new Quinnipiac poll accelerated a trend toward Rubio, and pushed Virginia from “Strong Clinton” to “Weak Clinton”. This is of course what prompted the improvement in Rubio’s best case and put him within reach of Clinton.
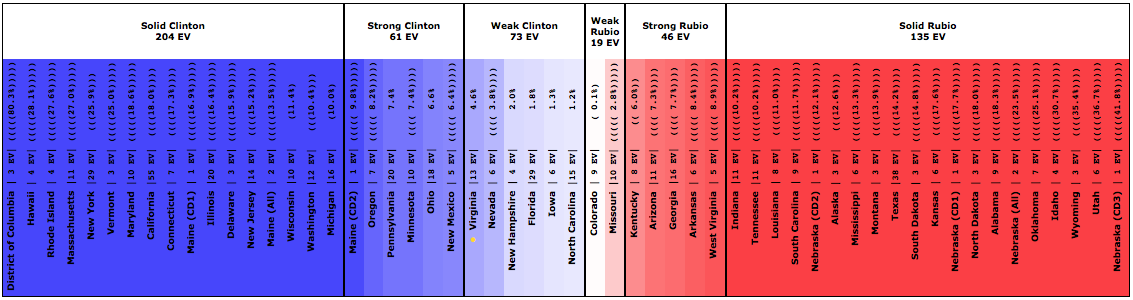
The full Clinton vs Rubio spectrum looks like this today:
And the full summary:
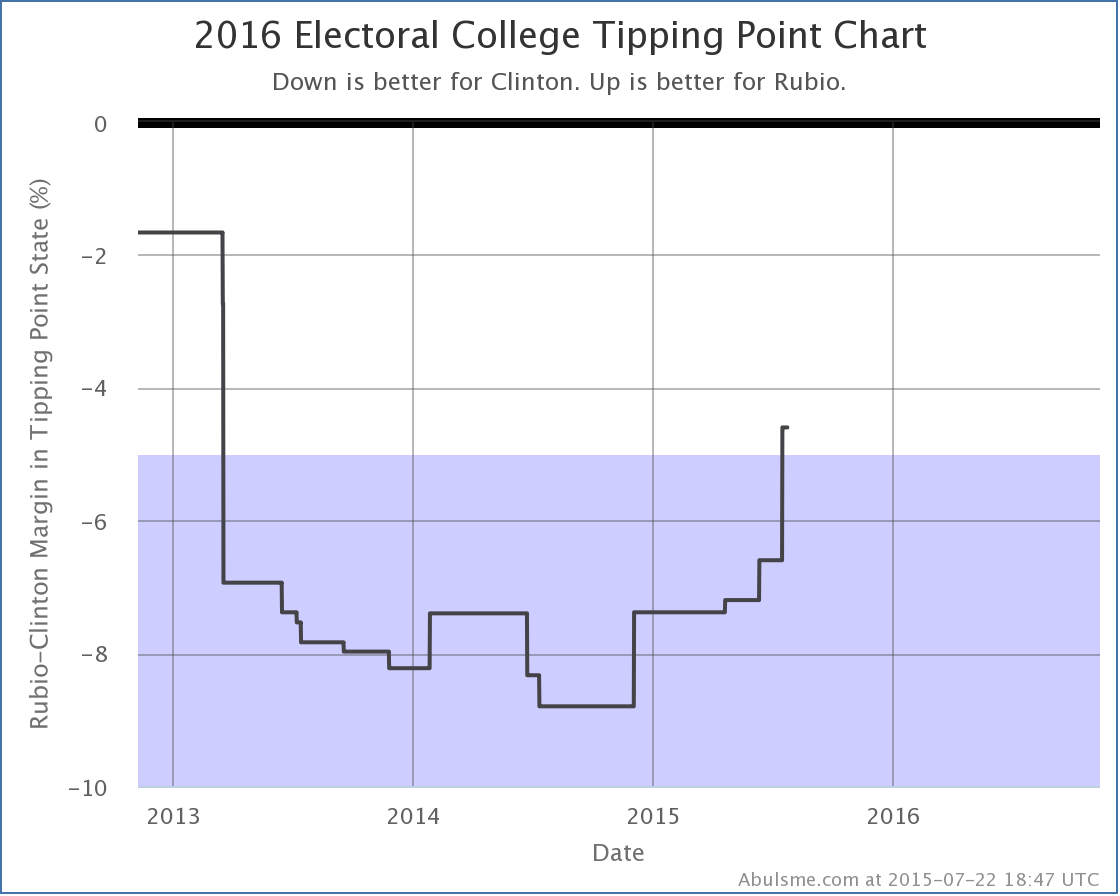
To win, Rubio would still need to flip North Carolina (1.2% Clinton lead), Iowa (1.3% Clinton lead), Florida (1.8% Clinton lead), New Hampshire (2.0% Clinton lead), Nevada (3.8% Clinton lead) and Virginia (4.6% Clinton lead). That sounds like a lot, but if national events or campaigning move things across all states, it means only 2.3% of voter have to change their minds to change the outcome. Even in today’s highly polarized climate, that is easily imaginable.
So, for the first time since the 2012 elections, it is starting to look like we have a real race. This is not unexpected. In my November post “The Race Begins” I said:
The real campaign against Clinton hasn’t ramped up yet. Lots of mud will be thrown. And the Republican candidates will get more and more visibility. Although anything is possible in either direction, it is quite possible that what we are seeing right now will be Clinton’s high water mark. The race is likely to get closer as we move through 2015 and people get more engaged.
Yup. That looks like what has been happening.
475.0 days until the first general election polls close.
Note: This post is an update based on the data on my 2016 Electoral College Analysis Site. All of the charts and graphs seen here are from that site. Graphs, charts and raw data can be found there for the race nationally and in each state for every candidate combination that has been polled at the state level. In addition, comparisons of the best polled candidate combinations both nationally and each in each state are available. All charts above are clickable to go to the current version of the detail page the chart is from, which may contain more up to date information than the snapshots on this page, which were current as of the time of this post. Follow @ElecCollPolls on Twitter for specific poll details as I add them.