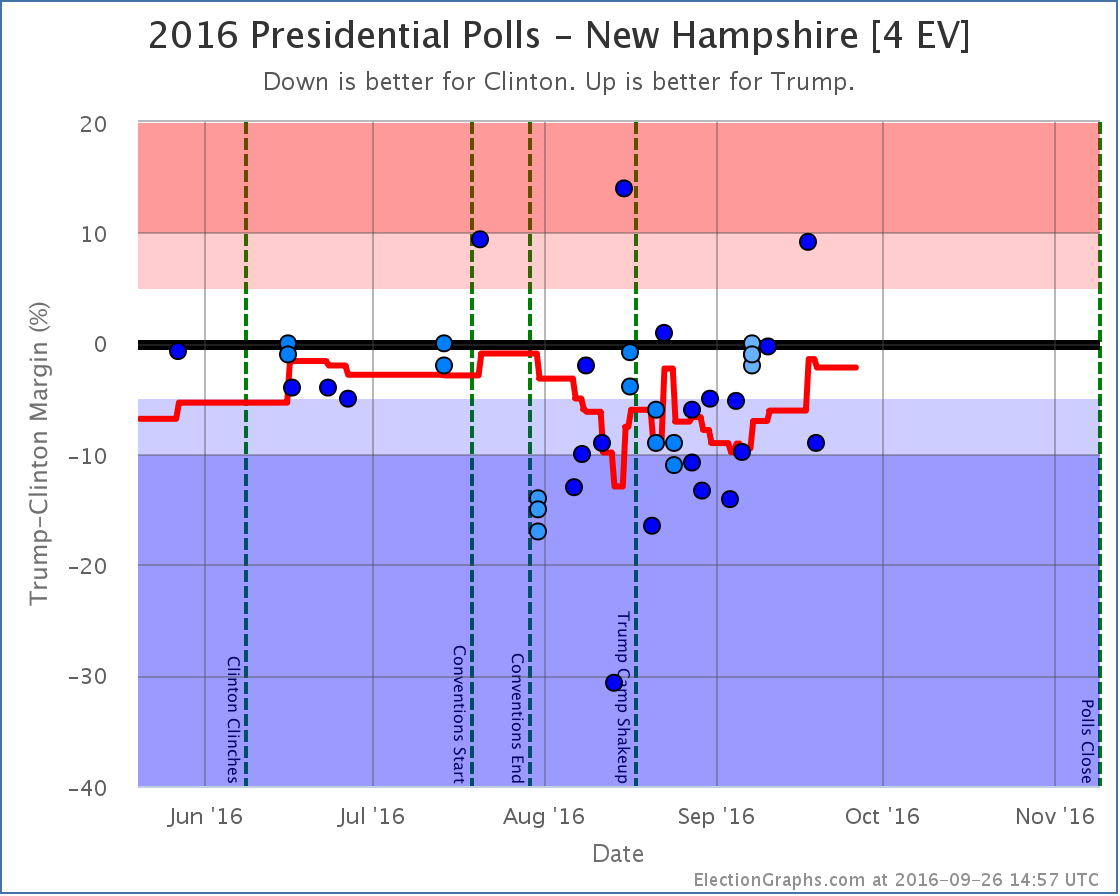
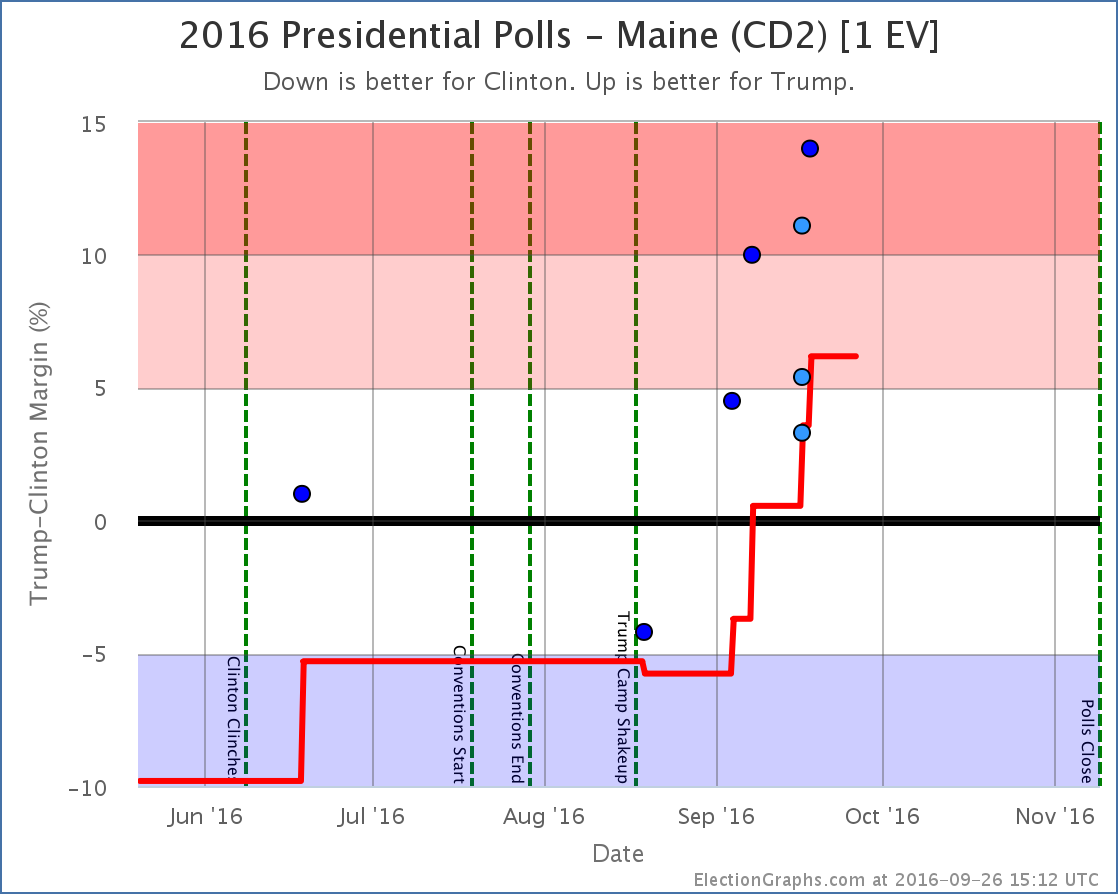
States with new poll data added since the last update: All 50 states, DC, and the Maine congressional districts. Notable changes in Kansas, New Hampshire, New Mexico, and Maine’s 2nd Congressional District.
National Picture
The update today is a strange one. Some indicators move toward Clinton, others move toward Trump. Some of the moves seem to be prompted by outlier data as well, so some skepticism is probably in order. But with the directional mix, one possible conclusion is that we are at or near the top of the recent move toward Trump. As I write this though, we are hours away from the first debate, which may well scramble things again.
The summary changes:
- The expected case moves from Clinton by 6 EV to Clinton by 8 EV
- Clinton’s best case improves from Clinton by 178 EV to Clinton by 188 EV
- Trump’s best case improves from Trump by 98 EV to Trump by 106 EV
- The tipping point moves from Clinton by 0.8% in NM to Clinton by 0.1% in KS
So two moves in Clinton’s direction (Expected and Clinton Best), and two moves in Trump’s direction (Trump Best and Tipping Point.)
The charts look like this:
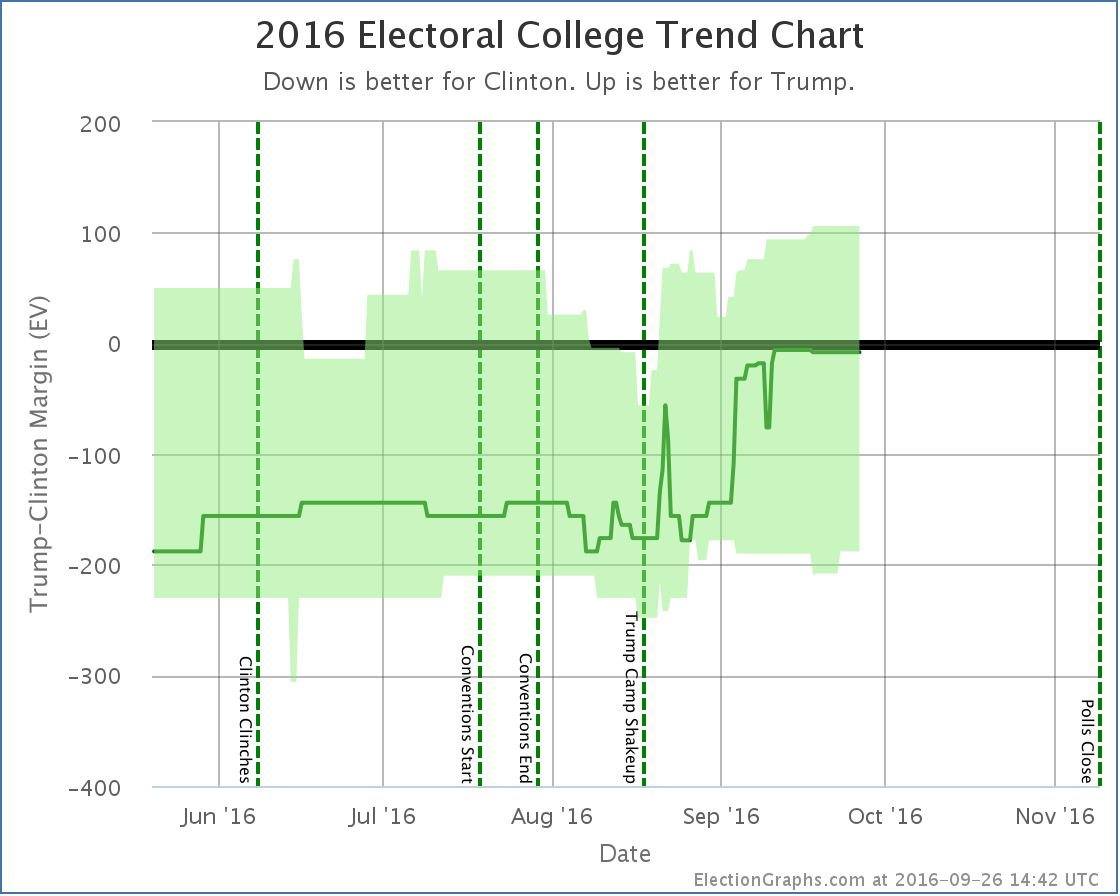
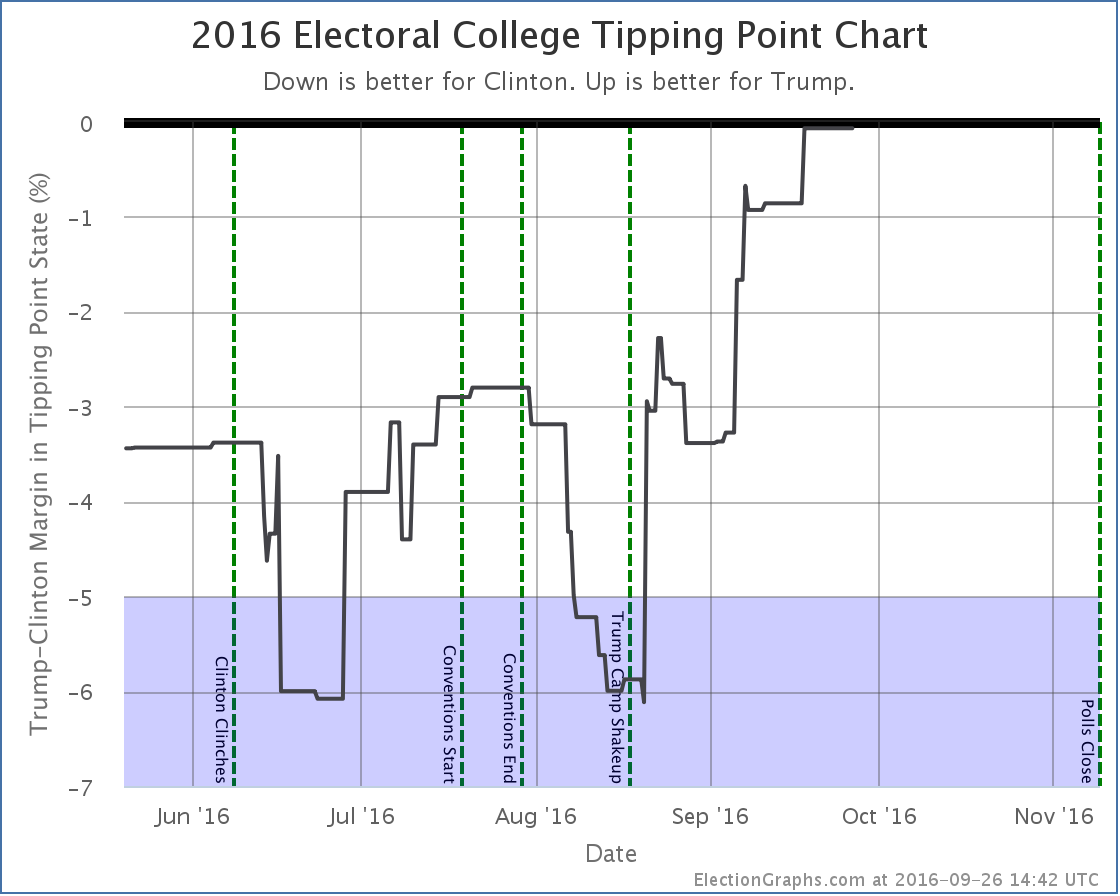
I’ve added a new vertical line marking the moment when Trump shook up his campaign by bringing in Steve Bannon and Kellyanne Conway. Looking back, we can now see this very closely aligns to the moment Trump stopped dropping and started closing the gap with Clinton.
Trump has still not led in my model, but this is about as close as you can get without crossing that line.
The fact that we are now seeing simultaneous moves in both directions might indicate we are near the top of this particular trend toward Trump. But events have the potential to change things quickly… in either direction.
43.4 days until polls start to close on election day…
State Details
For those who are interested in the individual state moves that combine for the national changes above, here they are. I will only add individual commentary when there is something specific worth noting.
Flipping to Clinton
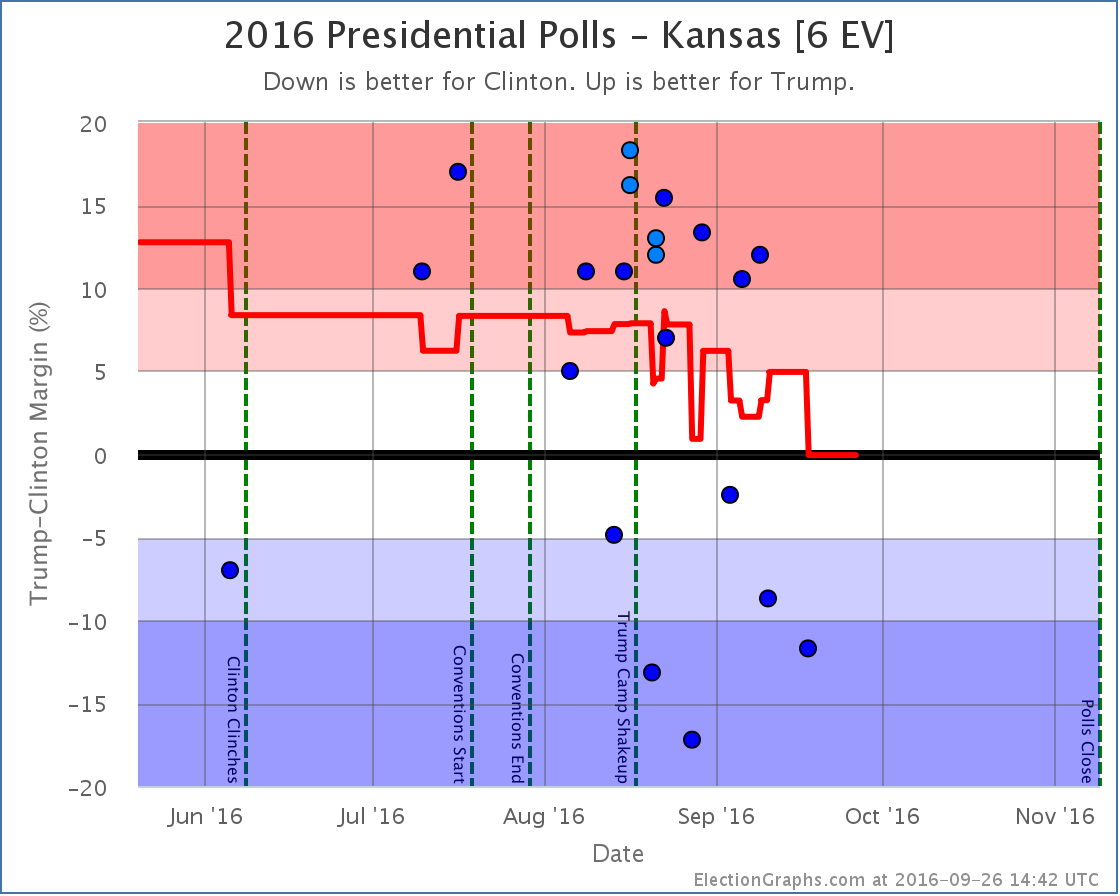
I’m putting this one first, because it is one I honestly don’t believe. Every single one of the results showing Clinton ahead since August is from one pollster… Google Consumer Surveys. This pollster has some unorthodox methods, and has produced strings of outliers in a wide variety of states… some favoring Trump, others favoring Clinton. In this case, other than a single Zogby poll in June, every other pollster shows Kansas not only favoring Trump, but favoring Trump by a substantial margin.
Because I am inclusive and try not to exclude polls, three of the five polls in my average in Kansas are from Google at the moment. This leads to a 0.1% Clinton lead in Kansas. If you excluded the Google polls, my average would show Trump leading by 11.6%. I am very very dubious that Kansas is even a close state, let alone that Clinton is ahead. We need more non-Google polls in Kansas to clear up this situation.
Now, astute observers will note that if you flip Kansas back to red, Trump would actually now be leading in the “expected” result. But not so fast. Google causes changes in other states too. To pick out one prominent example, Google has been giving Trump much bigger leads than other pollsters in Florida. My average in Florida currently shows Trump up by 1.1%, but if you removed Google, the average moves to Clinton by 1.3%. So removing Google might flip Kansas, but it would also flip Florida. You’d still have a Clinton lead overall, just in a different way.
The philosophy of this site is to just include everything unless is it obviously fake or fraudulent. The Google polls may be bad… they are just all over the place compared to more traditional pollsters… but they are not an obvious fake or fraud. So I will continue to include them. I don’t pick and choose polls based on if I “believe” them. Google is in the average. So you end up with a very slight Clinton lead… in Kansas.
But Google is clearly adding noise to the model at the moment… which I’m not particularly thrilled about.
Note that Kansas moved all the way from Strong Trump to Weak Clinton in one jump, so it improved both Clinton’s expected case and her best case.
Flipping to Trump
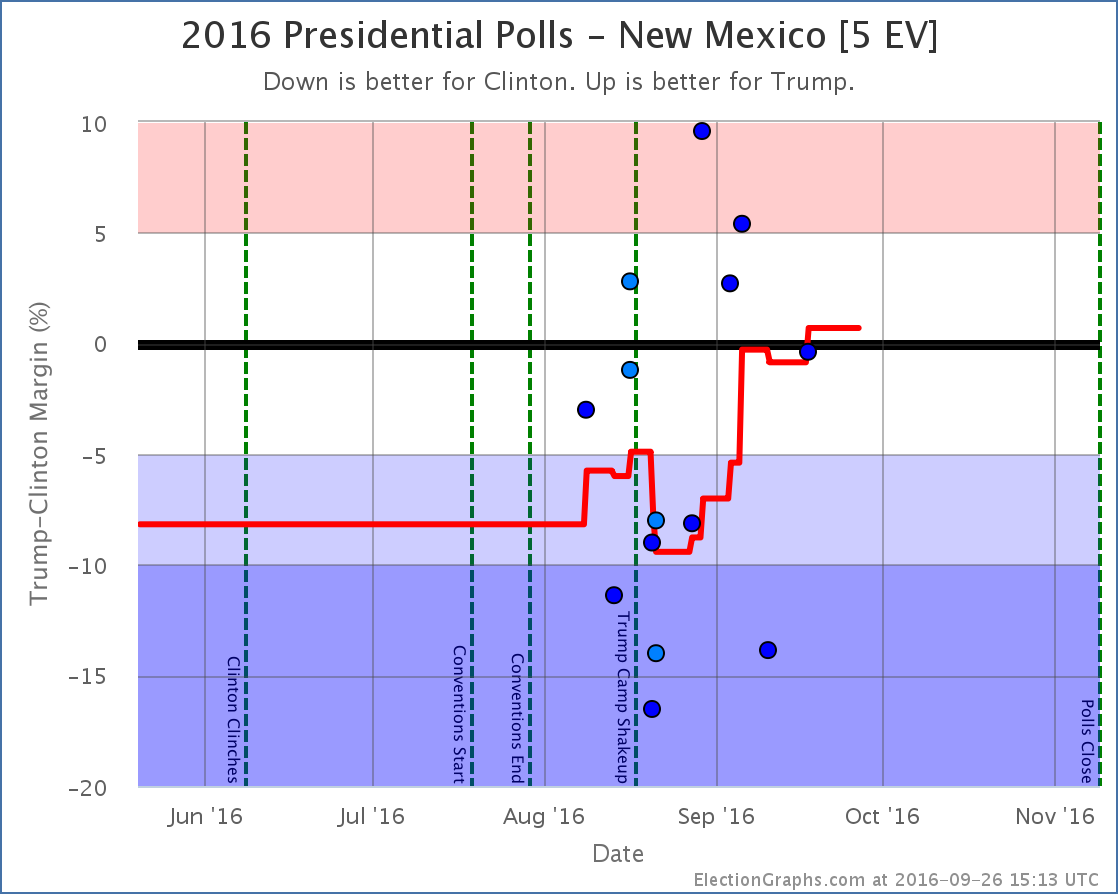
This is another state where three of five data points in my average are from Google, and this time the other two are from Reuters/Ipsos, another “50 state” pollster where the numbers can sometimes be way out of line with other polls. In this case Google and Ipsos seem to trend in opposite directions, but it would be really nice to have some other big name pollsters check out New Mexico again before too long, because when all you have are these polls looking at the whole country and then breaking out subsamples by state, you really have a lot of uncertainty on the results. So like Kansas, treat New Mexico with a substantial pile of salt.
Now in reach for Trump
No longer in reach for Clinton
Interview
The latest Curmudgeon’s Corner podcast presented interviews with three people who do independent electoral college projections based on state polls… Luis Mendez from projectiondesk.com, Darryl Holman from horsesass.org, and me… Sam Minter from electiongraphs.com. We each talked about how we got into this sort of analysis, what makes our sites different, the challenges we face, and more. Take a listen!
For more information…
This post is an update based on the data on ElectionGraphs.com. Election Graphs tracks both a poll based estimate of the Electoral College and a numbers based look at the Delegate Races. All of the charts and graphs seen in this post are from that site. Additional graphs, charts and raw data can be found there. Follow @ElectionGraphs on Twitter or like Election Graphs on Facebook to see announcements of updates or to join the conversation. For those interested in individual general election poll updates, follow @ElecCollPolls on Twitter for all the polls as they are added. If you find the information in these posts interesting or useful, please consider visiting the tip jar.
[Blog Post] Electoral College: Has Trump Peaked? https://t.co/33lhJIJKA9
RT @ElectionGraphs: [Blog Post] Electoral College: Has Trump Peaked? https://t.co/33lhJIJKA9
I can’t speak about the Google polls, but Ipsos has apparently stated a lack of confidence in some of its recent polling (after producing odd results). It’s results being somewhat outside the margin of error or confidence interval in most states because of extremely small samples and so on.
I know one site dropped them completely (http://www.electoral-vote.com/evp2016/Pres/Maps/Sep21.html#item-11) because of this.
I’m not suggesting you arbitrarily scrap an entire dataset, or both, because of the inclusive nature of the site. If I were to suggest anything, it would be a minimum sample size or maximum margin for error cut off for inclusion into the database. I’m curious though, is it possible to work out what kind of margin for error (even roughly) the averages have? I don’t know enough about the field to do it myself. Is it possible to show sample size and moe on the list of polls in the average too? I know I can view the individual Google results easily, but the others don’t seem to be in a compatible format for iPad/chrome/both :(
I live in an area with salt mines, and believe me they don’t have enough in them to take some of these results. Outliers are one thing but the consistency with which some of these results are presented suggests major problems (small sample size etc). I can believe that some states are tightening, but Google giving HRC double digit leads in KS (and even if you account for the error margin, she’d still be tied pretty much).
I am, of course, prepared to eat my words with a good helping of humble pie when HRC wins KS by 15, DT wins NM by 3 and other similarly crazy seeming results come to pass. Brexit, UK general and other Elections recently have produced a number of spectacular polling failures :)
Having a minimum sample size is a possibility for 2020. But with Google/Ipsos/CVoter the states where they seem to have the biggest outliers are not always the ones with really small samples! They seem to be way off in some states where they have fairly large samples too! My gut is that there are fundamental issues they just haven’t solved yet in terms of weighting their raw results to account for differences in their sample compared to the voting population. I think on balance it is good to have them, as they provide some information in states where otherwise there would be much less. But it does cause me stress whenever I’m entering data points that are obviously pretty far off from any other polls in one state or another. For the most part, these end up balanced out by other polls, but… Looking at Kansas for instance, CVoter and Ipsos consistently agree that Trump is way ahead, Google consistently thinks Clinton is way ahead. Given Kansas’ history, I know which one I believe, but I’m not going to impose my judgement. Sigh! (In Kanas specifically, I keep wondering if Google just has their Clinton/Trump reversed… if you just flipped the Google numbers to the other side of the axis, they would be right in line with the others…)