This is the website of Abulsme Noibatno Itramne (also known as Sam Minter). Posts here are rare these days. For current stuff, follow me on Mastodon

Categories

Calendar

April 2024
S M T W T F S
 123456
78910111213
14151617181920
21222324252627
282930  

Electoral College: Clinton Slips a Little More in New Hampshire

Today there was yet another poll in New Hampshire, this time from WMUR, as well as one in New Jersey from Monmouth.

Today’s changes actually lead to Clinton vs Walker bumping Clinton vs Rubio off my “five best polled candidate combinations” list, at least according to my metric.

Even though Clinton vs Rubio isn’t in the top five any more, since it WAS in the top five prior to this update, I’ll briefly cover the change.

Just like Bush and Paul improved their situation in New Hampshire polling yesterday, today’s poll data boosts Rubio in New Hampshire, and Clinton’s lead falls to less than 5%.

chart-35

Notice the huge range here. Just within the last month, polls have ranged from Clinton up by 12% to Rubio up by 5%. That is a crazy range. I don’t feel a lot of confidence about what is really going on in New Hampshire. The average at the moment though puts New Hampshire in the “Weak Clinton” category vs Rubio, so Rubio’s best case improves:

chart-36

This doesn’t put Rubio quite as close as Bush, but still puts his best case at losing to Clinton by only 18 electoral votes. So there are a couple of the Republicans now threatening to actually make a race out of this.

Note: This post is an update based on the data on my 2016 Electoral College Analysis Site. All of the charts and graphs seen here are from that site. Graphs, charts and raw data can be found there for the race nationally and in each state for every candidate combination that has been polled at the state level. In addition, comparisons of the best polled candidate combinations both nationally and each in each state are available. All charts above are clickable to go to the current version of the detail page the chart is from, which may contain more up to date information than the snapshots on this page, which were current as of the time of this post.

Electoral College: Virginia moving away from Clinton

I added a bunch of new polls today, catching up after being preoccupied with something else the last few days.

The first thing to note is a change to the “top five best polled” candidate pairs. With the latest batch of polling, a well polled state (North Carolina) that had been really close in Clinton vs Walker became less close, and thus this combination slipped out of the top five, replaced by Clinton vs Ryan again. I expect this won’t last long, with one of Clinton vs Rubio, Clinton vs Cruz, or Clinton vs Walker once again jumping onto the top five very soon.

Within the top five candidate combinations, there were two changes of note this time:

Clinton vs Paul

chart-21

The latest polling in Virginia from CNU improves Paul’s situation in Virginia from losing by 8.4% to only losing by 6.8%. This does not change Virginia’s categorization as a “Strong Clinton” state, but since Virginia was the tipping point state, it moves that metric:

chart-22

With this the tipping point moves from Clinton leading in Virginia by 8.4% to Clinton leading by 7.6% in Ohio. This is a nice bump toward Paul. We’re still in “Strong Clinton” territory by this metric of course, but this continues a general trend of Paul’s tipping point against Clinton improving ever since last summer. Paul and Bush are the only two Republicans in the current five best polled combinations that can claim a positive trend against Clinton on this metric.

Clinton vs Bush

chart-23

Once again it was the CNU Virginia poll making a difference. Clinton’s polling average lead vs Bush declines from 6.6% to 3.3% with this new poll. This moves Virginia from “Strong Clinton” to “Weak Clinton” and puts it back in play for Bush and improves his “best case” (which is where I give him not just the states he is ahead in, but all the states where Clinton is ahead by less than 5%):

chart-24

This brings Bush’s best case to losing to Clinton by only 24 electoral votes. This is the best best case Bush has had since there was any real significant polling on 2016. Bush is currently doing better against than the other four Republicans in the five best polled combos in every metric I’m tracking. If he can make at least another 12 electoral votes close… say perhaps Iowa (6 EV) and Minnesota (10 EV)… the two “Strong Clinton” states that are the weakest for Clinton at the moment… then for the first time since early 2013 (when polling data was still sparse and we were mainly relying on previous elections) we’ll have a real race, where the Republican is actually in contention.

Others

Normally I wouldn’t mention combinations not in the top five, but since Clinton vs Walker just fell off with this update, I’ll briefly note that the news was mixed for him in today’s batch of polls. On the one hand, he improved in Virginia, which improved his tipping point. On the other hand, North Carolina flipped from Weak Walker to Weak Clinton, increasing the amount he would be expected to lose to Clinton by if each of them won all the states they were ahead in.

Note: This post is an update based on the data on my 2016 Electoral College Analysis Site. All of the charts and graphs seen here are from that site. Graphs, charts and raw data can be found there for the race nationally and in each state for every candidate combination that has been polled at the state level. In addition, comparisons of the best polled candidate combinations both nationally and each in each state are available. All charts above are clickable to go to the current version of the detail page the chart is from, which may contain more up to date information than the snapshots on this page, which were current as of the time of this post.

Electoral College: Clinton slips a bit more, and first look at Clinton vs Walker

Today I added results from PPP’s latest polling of North Carolina to my database. They polled 11 different candidate combinations, but only one of these resulted in a significant change to one of the five best polled candidate combinations. So lets hit that quickly:

Clinton vs Huckabee

chart-18

Yup, that newest poll may or may not prove to be an outlier, but that looks like a real trend, with Huckabee gaining a lot of ground vs Clinton over the last year, and now Huckabee takes the lead, just barely. This changes Huckabee’s expected result vs Clinton:

chart-19

Huckabee’s “expected” result where he wins all of the states he is ahead in is now to lose to Clinton by 332 to 206… losing by 126 electoral votes… which is exactly the same as Romney’s loss to Obama. Right now, looking at the five best polled candidate combinations, Bush and Paul both do better than this, with Bush losing by 98 electoral votes and Paul losing by 108. Christie on the other hand does worse, losing by 156. But what about the 5th candidate combination? This brings up the other big news of the day, namely, the debut of Clinton vs Walker in my “Top 5”.

Clinton vs Walker

The new batch of polling added today causes a big improvement for Clinton vs Walker in my metric to measure polling quality. There is plenty to quibble with on how I construct this metric, namely that it might be overly sensitive to the situation in states that are VERY close in the poll averages, and I second guess it myself all the time, but it is “good enough” for these purposes. With today’s update, Clinton vs Walker jumps past Clinton vs Cruz, Clinton vs Rubio and Clinton vs Ryan to take the #5 spot in my top five ranking.

Looking at the historical trend charts for Clinton vs Walker wouldn’t really tell us too much. At this point those don’t really show real “trends” they just show the process of slowly getting enough polling to show where Clinton vs Walker really is, rather than having the map based mostly on the average of the 1996-2012 elections. So instead lets just look at a snapshot of NOW:

chart-20 Screen Shot 2015-04-11 at 16.34.42777Screen Shot 2015-04-11 at 16.43.44900

So where does Walker start out? 332-206. Matching the Obama vs Romney result. Matching Huckabee. Not doing as well as Bush or Paul, but not as badly as Christie. At least in terms of the “Expected” result.

Now, even though Walker makes it on to the Top 5 best polled list, that doesn’t mean polling is super robust. Only two states (Iowa and Wisconsin) actually have more than the five polls I usually use in my averages, and they aren’t even close states. (Hillary is ahead by over 8% in both.) Every other state is still relying to some degree on the results in the 1996-2012 elections to provide a baseline in the absence of actual Clinton vs Walker polls. Sixteen states have at least one Clinton vs Walker poll though, and a good number of those have several polls at this point, so we have enough to start paying attention.

On Walker’s map right now there are only four “close” states: Ohio, Colorado, North Carolina and Missouri. The current “shortest path” to a Walker win is for him to win those four states, plus pull Pennsylvania, Nevada, New Mexico and Virginia over from the “Strong Clinton” category, first into contention as a close state, and then over to his side. The tipping point is Virginia, where Clinton’s lead is currently 6.6%.

6.6% seems like a pretty big lead. But the events of a long campaign can and do erase leads like that. Remember the crucial point that this far out polls are NOT predictive of the final result, instead, they essentially just show how much work the losing candidate needs to do (or how much the leading candidate needs to screw up) in order to flip the result. Another way of looking at a 6.6% lead is that 3.3% of people need to change their minds. Or the undecided need to break strongly in favor of the challenger. (My model just looks at the margin between the polling of the two candidates, and doesn’t take into account the size of the undecided pool at all.) In that context, 3.3% doesn’t seem quite as formidable.

Clinton has a strong lead here. Catching up and winning will take some hard work or good luck for Walker. But it is certainly possible. 577 days is a long time.

Note: This post is an update based on the data on my 2016 Electoral College Analysis Site. All of the charts and graphs seen here are from that site. Graphs, charts and raw data can be found there for the race nationally and in each state for every candidate combination that has been polled at the state level. In addition, comparisons of the best polled candidate combinations both nationally and each in each state are available. All charts above are clickable to go to the current version of the detail page the chart is from, which may contain more up to date information than the snapshots on this page, which were current as of the time of this post.

Curmudgeon’s Corner: All Kinds of Noises

In the latest Curmudgeon’s Corner Sam and IvГЎn talk about:
* Bill O’Reilly vs Brian Williams
* Questioning Patriotism and Religion
* Iran and Israel
* Lightning Round

CCCover20141121-bigheads-2
Recorded 2015-02-26

Length this week – 1:14:36

1-Click Subscribe in iTunes
Download MP3 File
View Podcast in iTunes
View Raw XML Feed

Paul Improves Again, Mixed picture for Bush

Another day and yet more polls moving things around. So lets go…

As usual click on any of the charts for more detail.
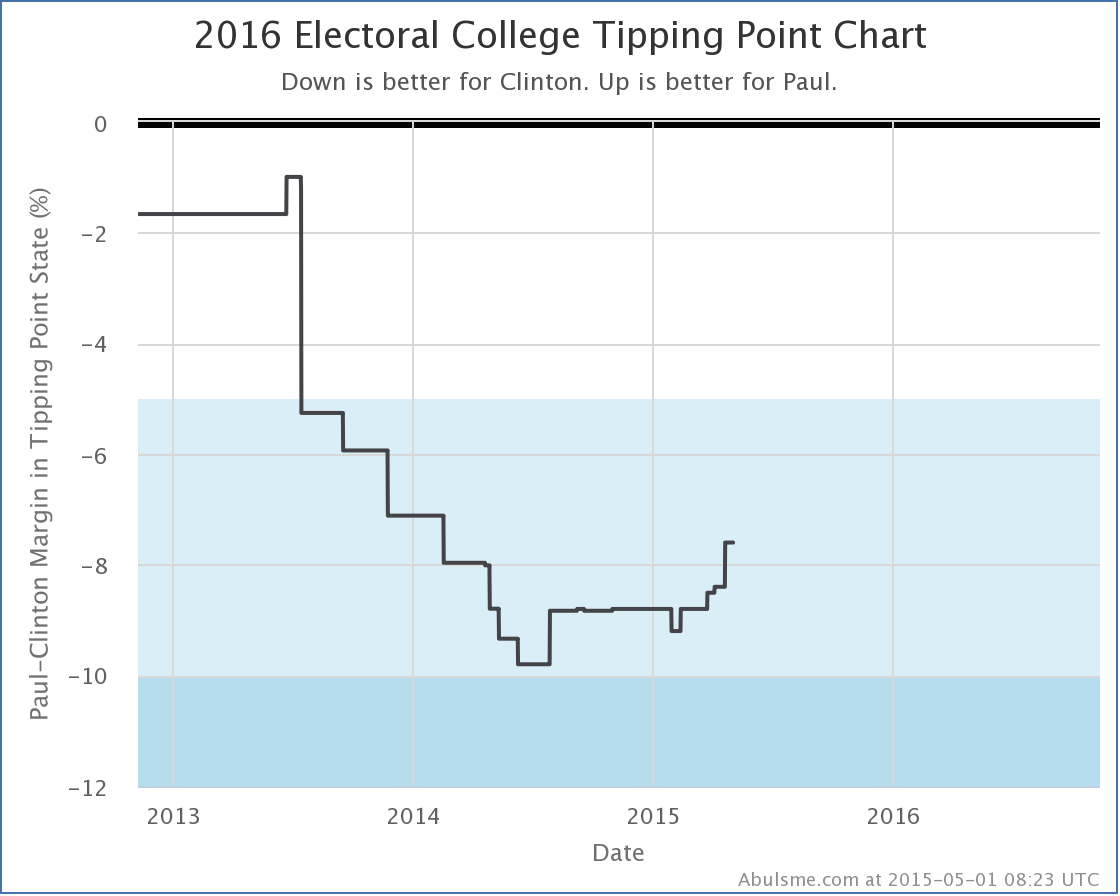
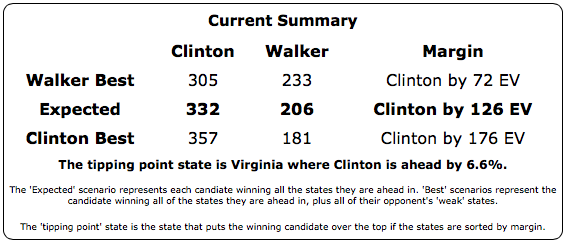
Clinton vs Paul

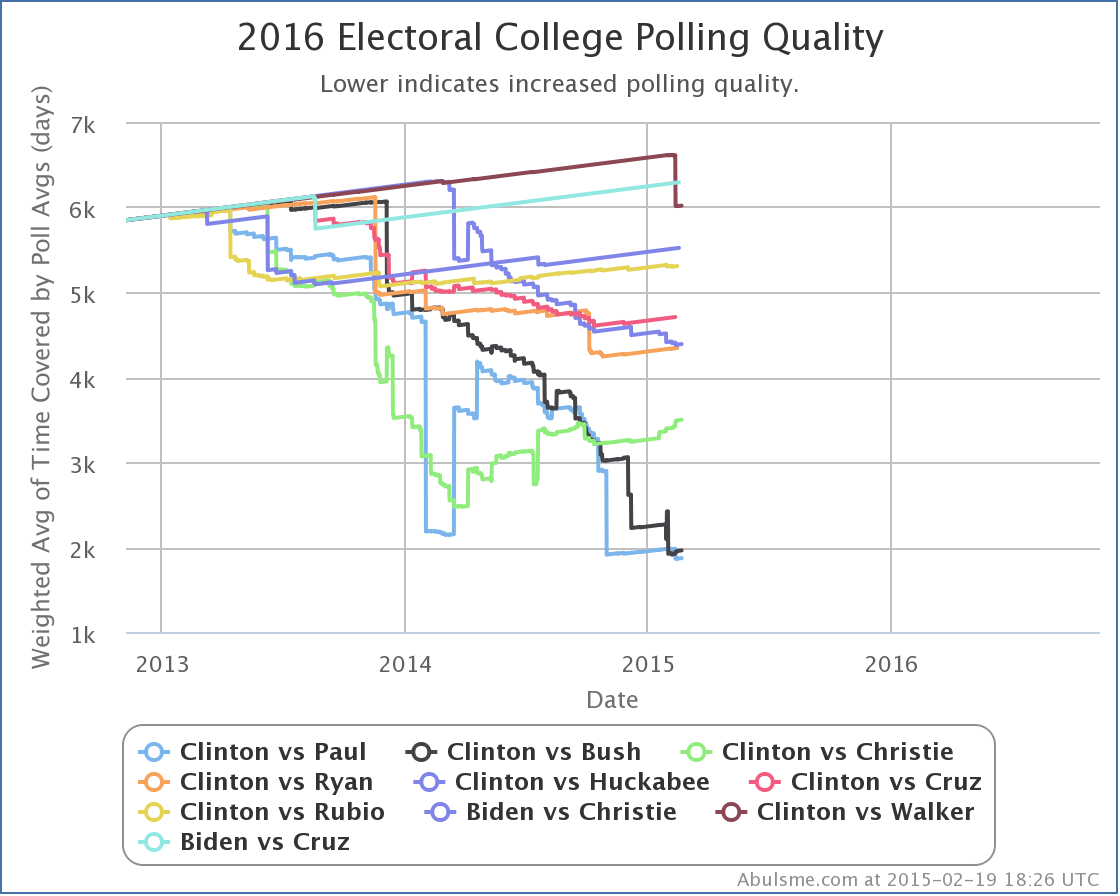
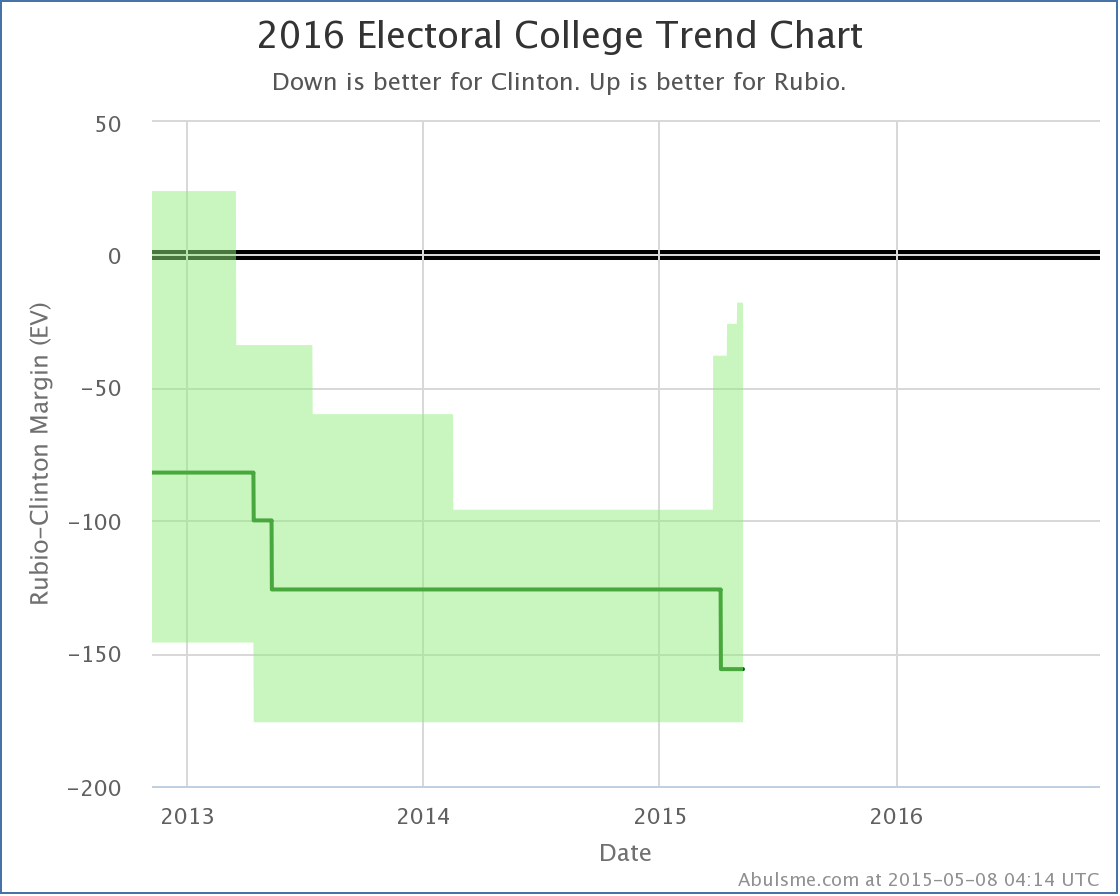
First of all, the latest batch of polls has Clinton vs Paul once again the “best polled” candidate combination, pushing Clinton vs Bush out of that spot. Keep in mind this does NOT mean they are the frontrunners in their respective parties, just that there have been more polls in the closest states than there have been for other candidate pairs. This means the default view on election2016.abulsme.com is now Clinton vs Paul. But the gap between them on my polling quality metric is very small, so don’t be surprised if they switch places again.

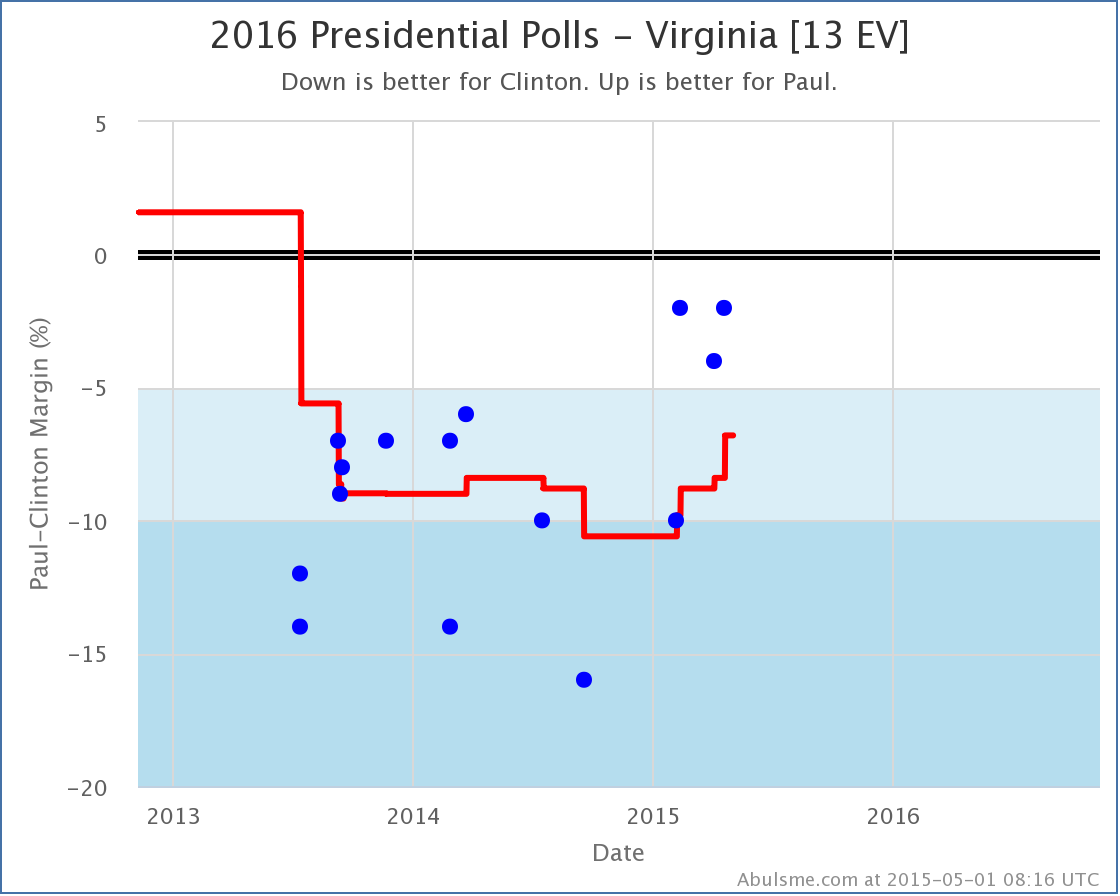
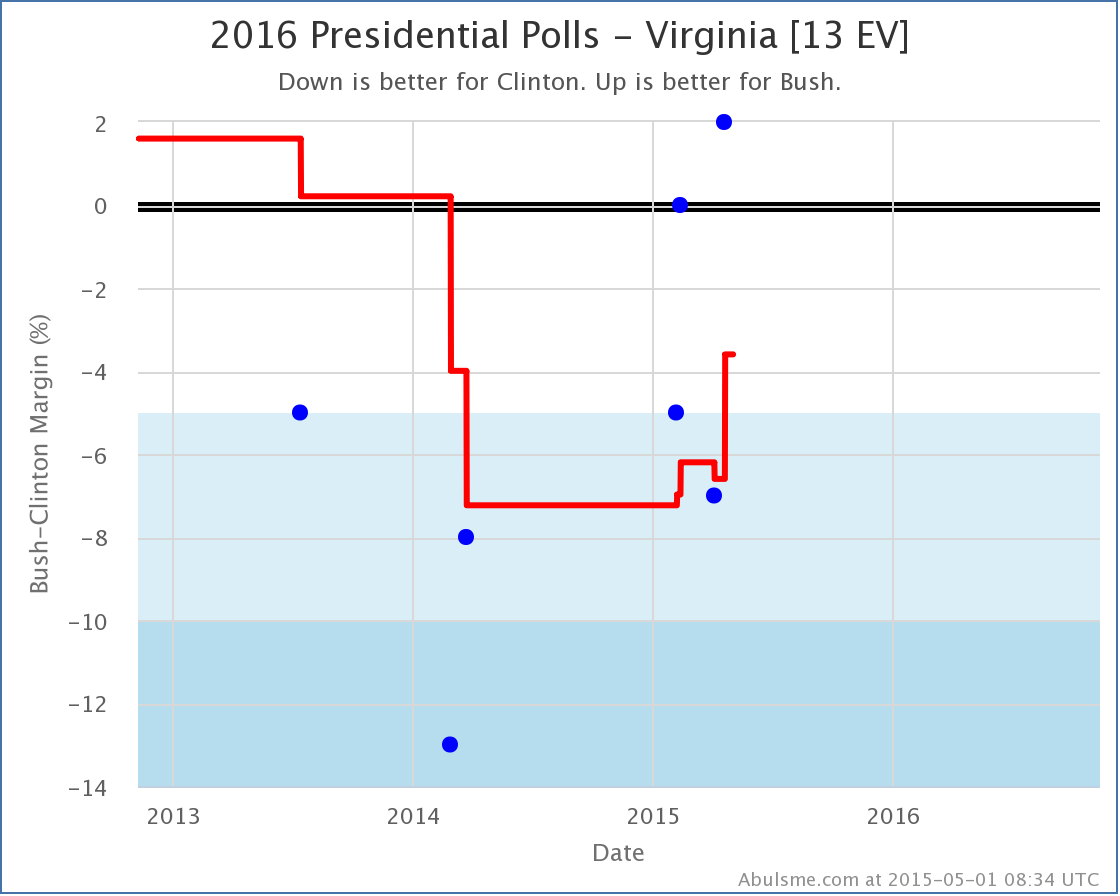
Next, a new poll in Virginia improved Paul’s standing slightly. No category change, Virginia is still a “Strong Clinton” state based on current polling against Paul. But the tipping point was moved:

chart (8)

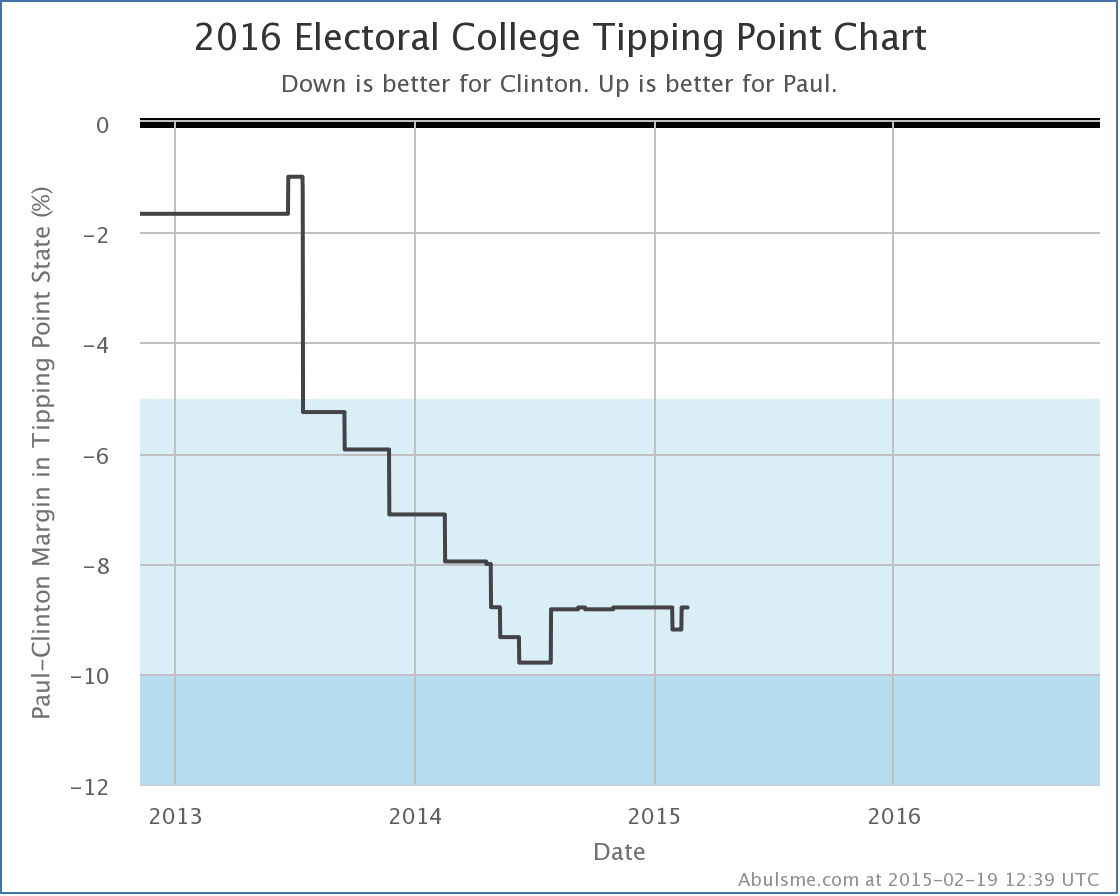
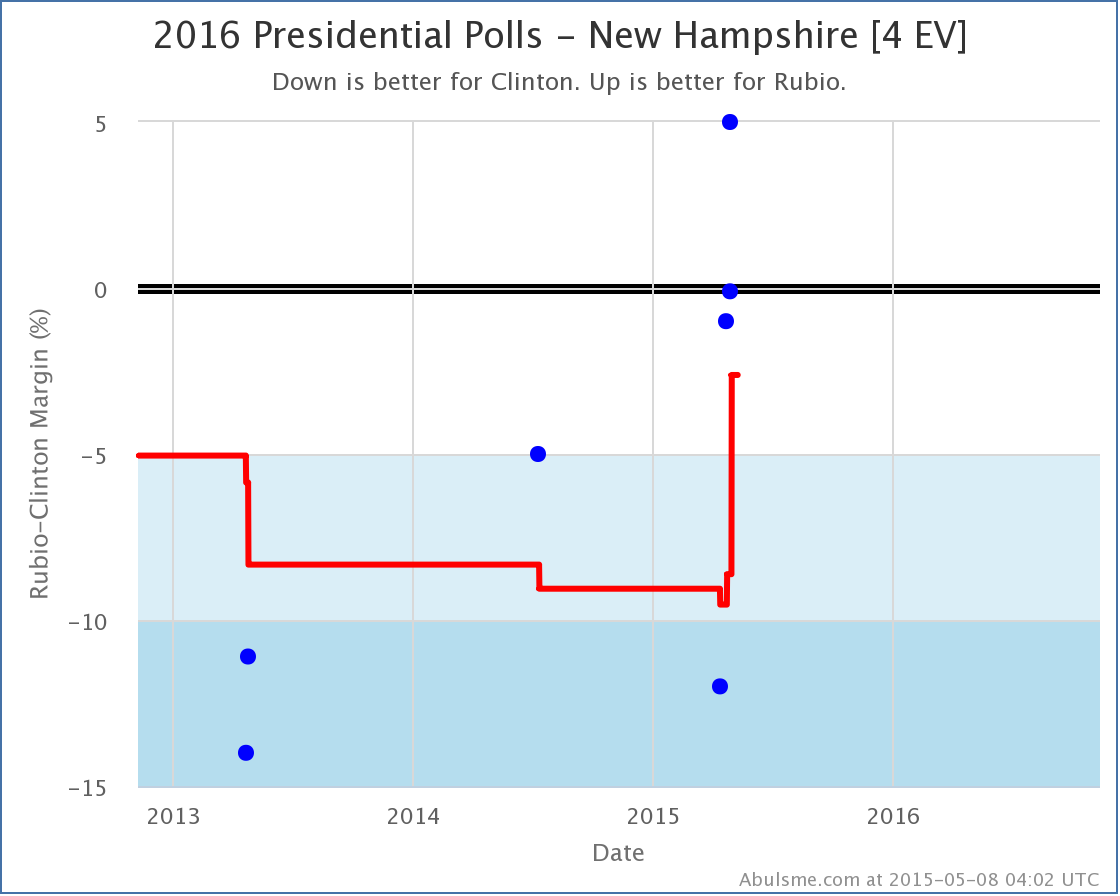
The tipping point moves from Clinton by 9.2% in Ohio, to Clinton by 8.8% in Virginia. This represents how big a uniform move in the polls across ALL states would have to happen to give Paul the edge in the Electoral college. This is basically because at the moment, to win, Paul would have to flip North Carolina (0.2% Clinton lead), Nevada (2.8% Clinton lead), Iowa (4.2% Clinton lead), New Hampshire (4.9% Clinton lead), Minnesota (7.0% Clinton lead), Michigan (8.6% Clinton lead), and Virginia (8.8% Clinton lead). [This is the list of states that are closest that would need to be flipped, there are of course other combinations that would do the trick if Paul flipped states with even bigger Clinton leads.]

Since Virginia would be the state that would put Paul over the top, it is the tipping point state and the margin there is the amount everything would have to move to make this scenario happen.
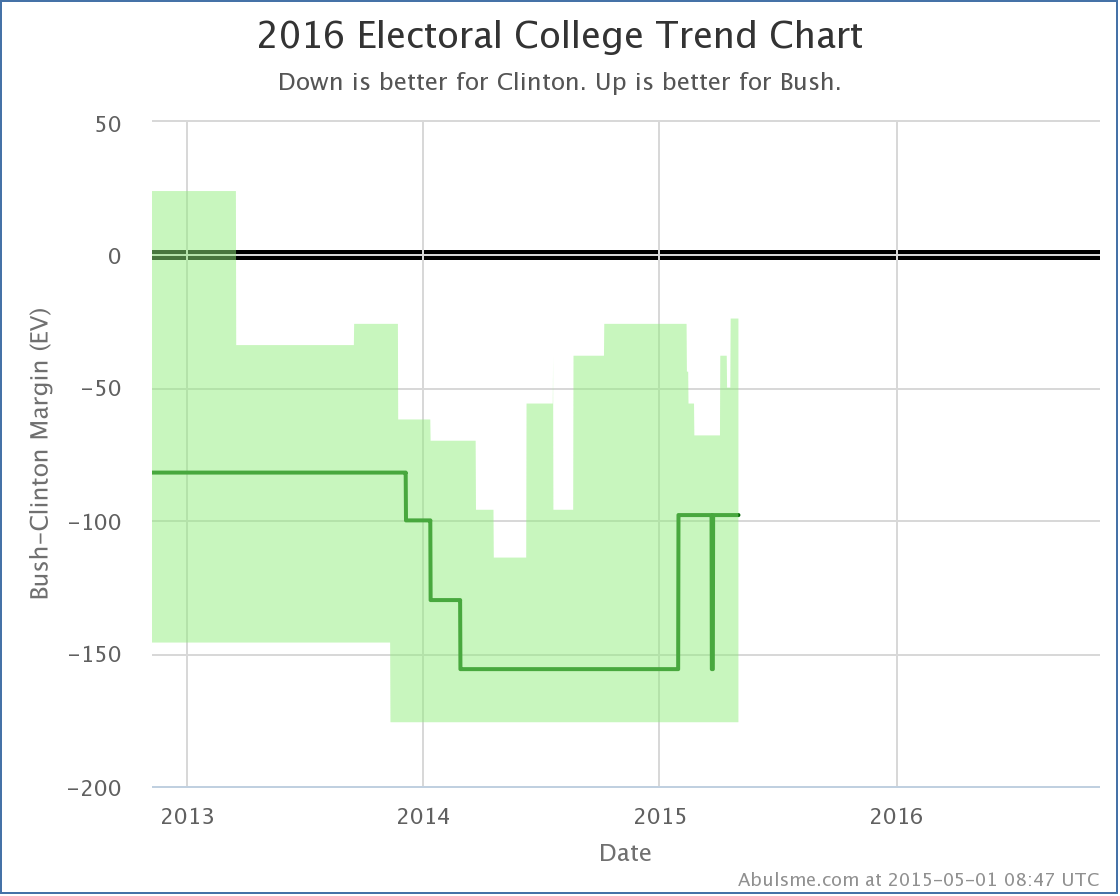
Clinton vs Bush

This combination sees relevant changes in Colorado, Iowa and Virginia.

chart (9)

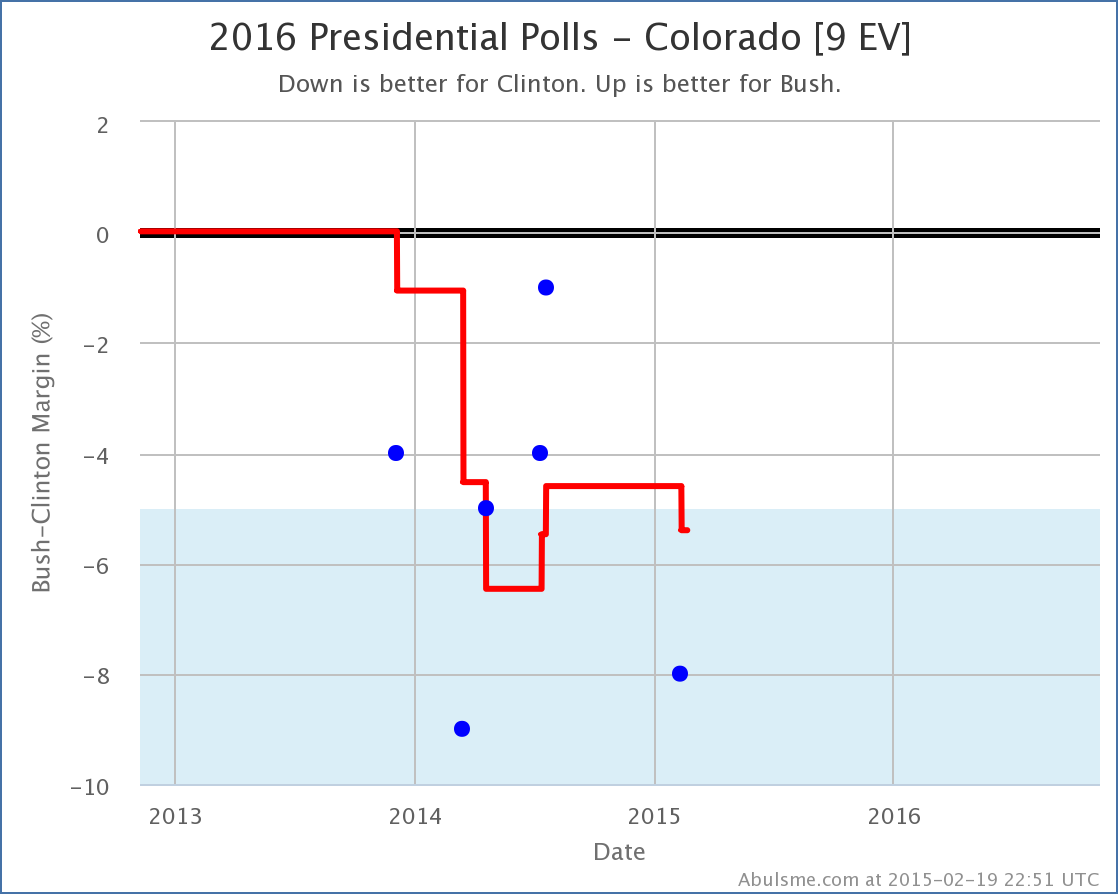
In Colorado, Clinton’s lead grows to over 5%, so this state moves out of contention and into “Strong Clinton”. (For now anyway, but do I really need to repeat just how early things are, and how relatively sparse polling still is too?)

chart (10)

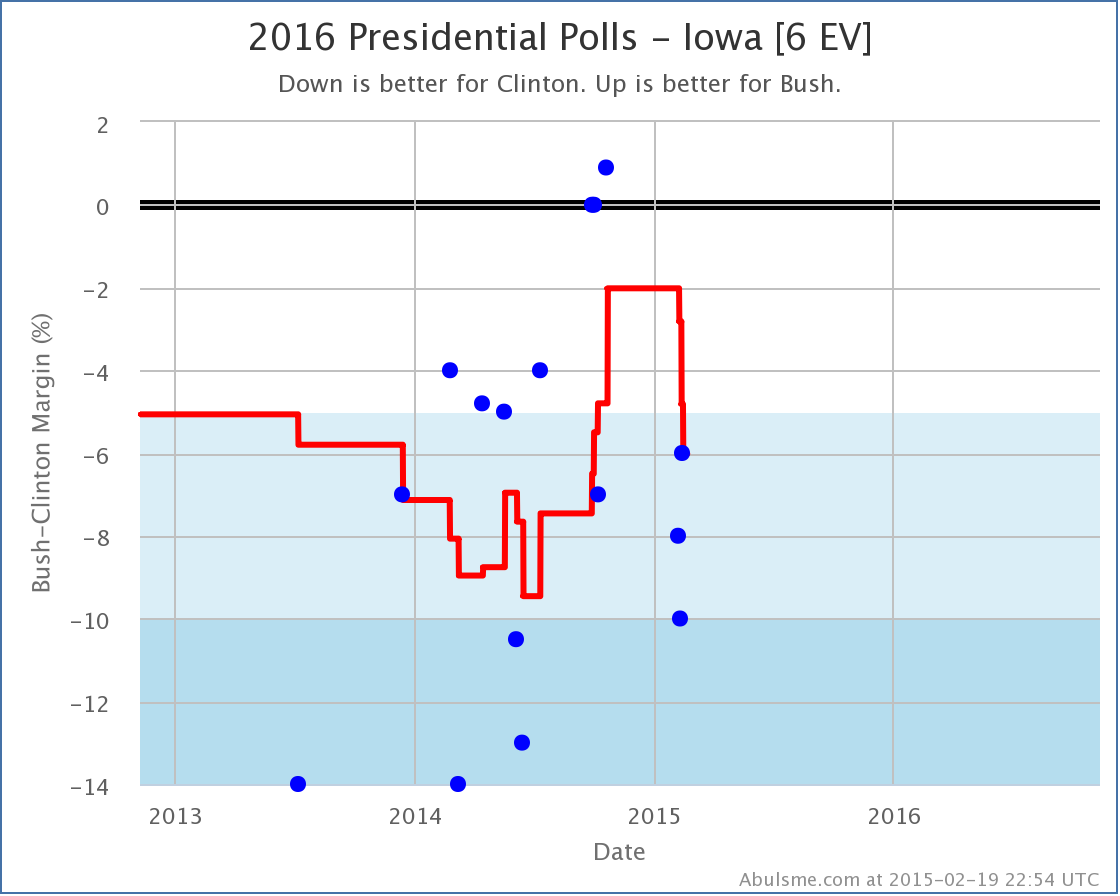
Same thing in Iowa. Although in Iowa, it looks like we might have a situation where the polling is returning to “normal” after a couple of outlier polls, while you could argue that in Colorado, the “true” state might just be bouncing around the 5% boundary line.

In either case, we shouldn’t be too surprised if the states get closer again.

With both of these states moving out of the “Weak Clinton” category, Bush’s overall best case against Clinton deteriorates a bit:

chart (11)

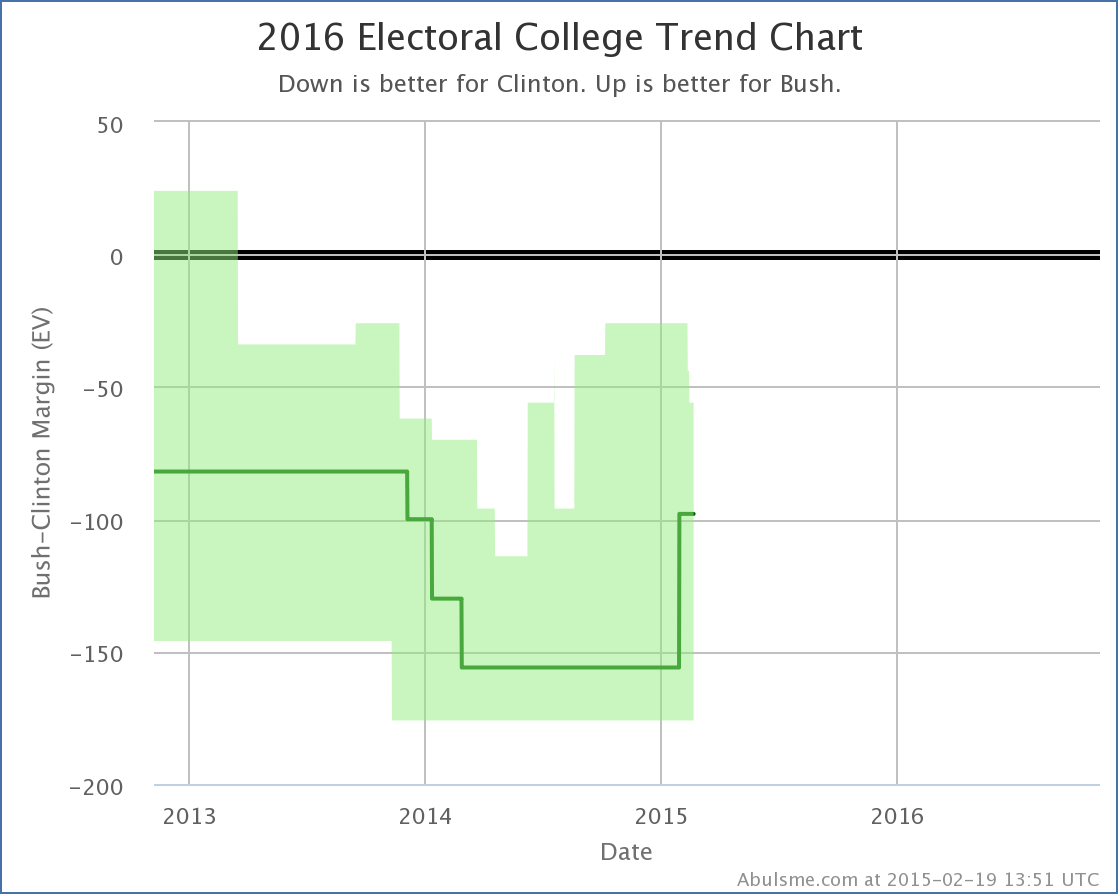
With this (plus another Iowa poll that was added yesterday) Bush’s best case against Clinton moves from losing by 26 electoral votes to losing by 56 electoral votes.

But while things haven’t been moving his way in Colorado or Iowa, in Virginia the latest polls have actually been moving toward Bush. No category changes… Virginia moved from a 7.0% Clinton lead to a 6.2% Clinton lead. This was enough to move the tipping point in Bush’s direction:

chart (12)

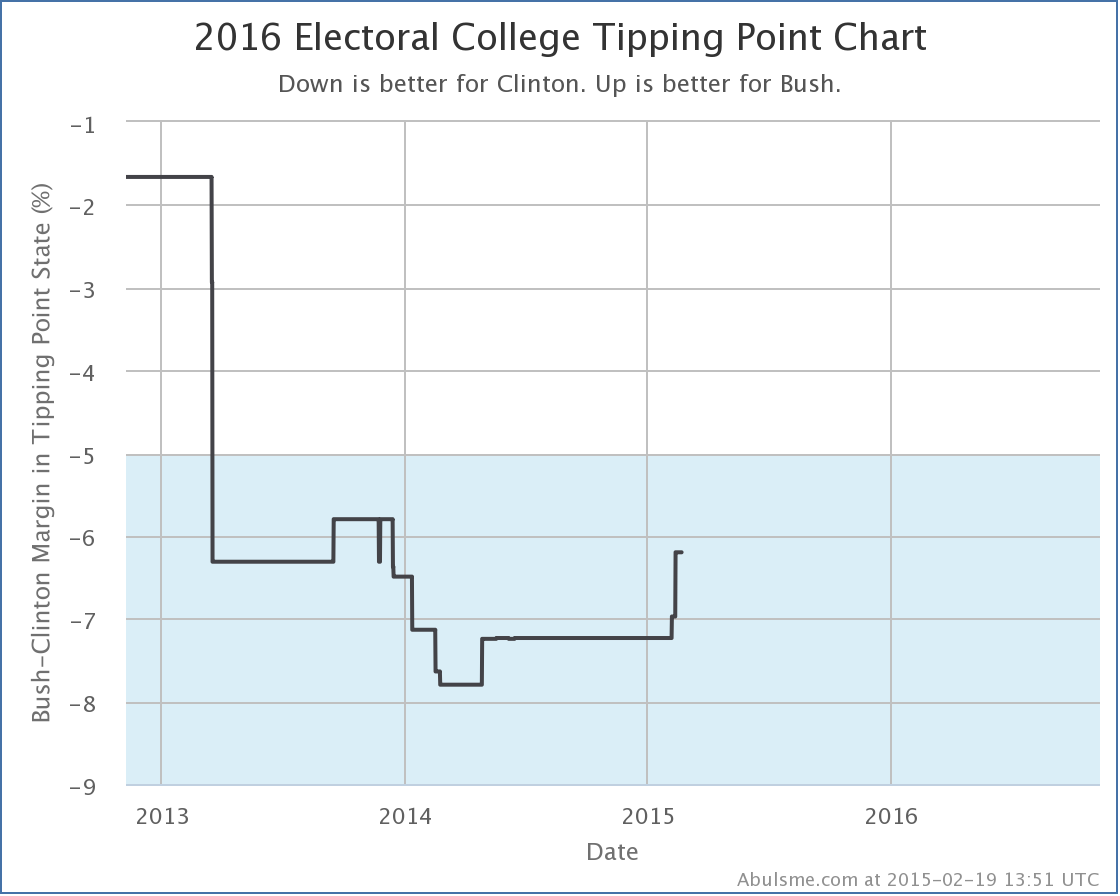
Virginia was the tipping point before this move, and it didn’t leapfrog any other states, so the tipping point stays in Virginia as it moves.

So Bush’s best case is getting worse, but his overall position is getting better? Yes, basically.

With current polling Iowa and Colorado now look like they aren’t competitive. So that is worse for Bush. But in order to win, Bush would have to flip a LOT of states, and the one he needs that he is furthest behind in is Virginia… but he is now not quite as far behind there. So if he is going to move all the states he needs to in order to win, he’s actually got a little bit less to move overall, even though Iowa and Colorado just moved a little further away.

Other folks

Just yesterday I was noting that Clinton vs Walker, despite being talked about quite a lot was still #18 on the ranking of best polled candidate combinations. With todays polls, he burst into the Top 10, debuting at #9, pushing Biden vs Rubio out of the Top 10. Still a bit away from the Top 5 combinations that I highlight here as having enough polling to say something useful about the race, but getting closer. If he continues to get lots of polling attention, while Clinton vs Ryan and Clinton vs Cruz and such do not, then he may get there sooner rather than later.

chart (13)