Hey, I rarely post here any more, but Brandy is running to be properly elected to the position she was appointed to last December. Please visit her website and donate to support the cause, and if you actually live in the 44th Legislative District in Washington State, please vote for her in both he primary in August, and the general election in November. Thank you!
This week on Curmudgeon’s Corner, Sam and Ivan do a lightning round show, talking about a bunch of smaller topics, including the “Defund the Police” slogan, Space X’s successful trip to the ISS, how the markets are reacting to the pandemic, Trump moving his convention acceptance speech to Jacksonville, and four other exciting topics!
Click below to listen and subscribe!
1-Click Subscribe in iTunes View Podcast in iTunes View Raw Podcast Feed Download MP3 File Follow the podcast on Facebook Support us on Patreon
Show Details:
Recorded 2020-06-12 Length this week – 1:54:36
(0:01:51-0:58:10) Lightning 1
Ivan: Sam’s Kidney Stone
Sam: Markets and the Pandemic
Ivan: Trump Convention and Rallies
Sam: Second Wave?
(1:00:10-1:54:13) Lightning 2:
Ivan: Defund the Police
Sam: Democratic Primary Update
Ivan: Space X to the ISS
Sam: Georgia Elections
The Curmudgeon’s Corner theme music is generously provided by Ray Lynch.
That’s just bookkeeping though, there was one status change of note:
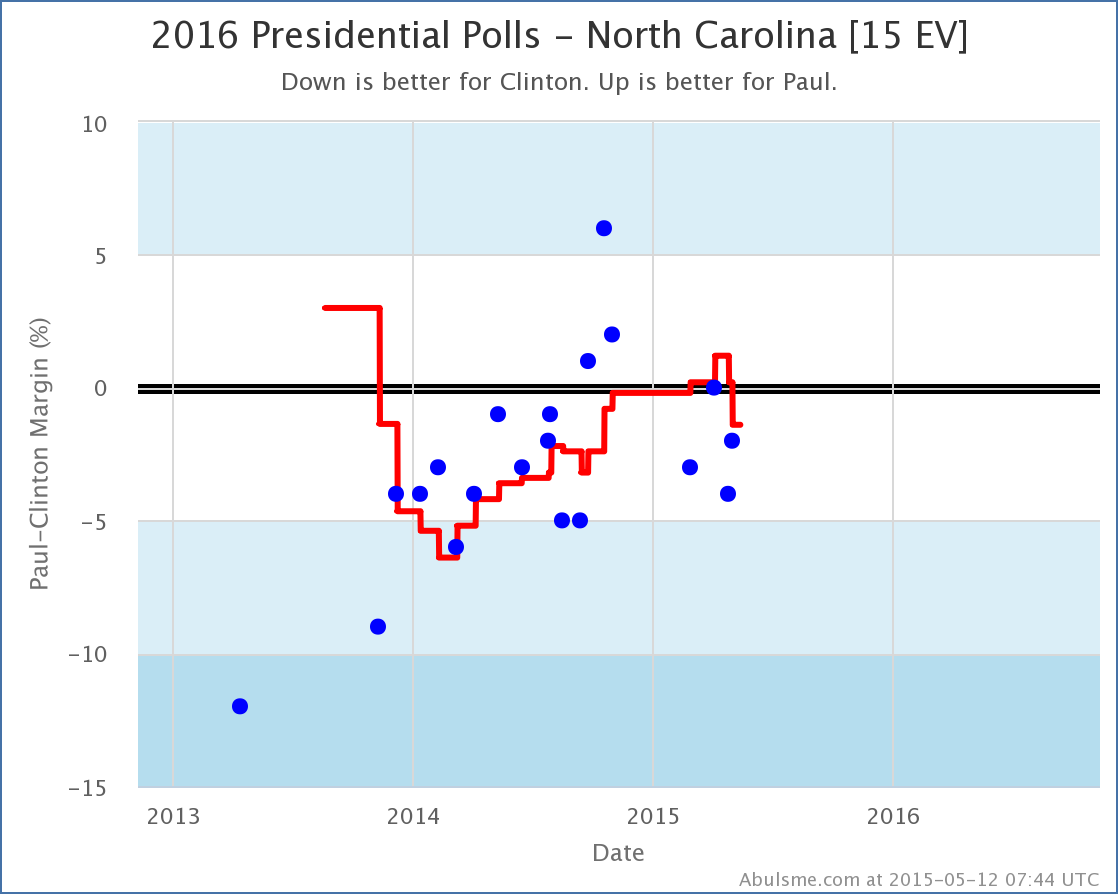
Clinton vs Paul
The newest poll in North Carolina bumps a poll from last October that had Paul ahead by 6% out of the poll average. With that poll gone, the average changes from Paul ahead by 0.2% to Clinton ahead by 1.4%. But the bottom line here is that all but one poll in the past year shows less than a 5% gap between Paul and Clinton. This is a close state. Yes, all but a few have shown Clinton ahead, so calling this “Weak Clinton” seems fair, even if you go beyond the last five polls. But it is close, and could flip back to Paul easily enough.
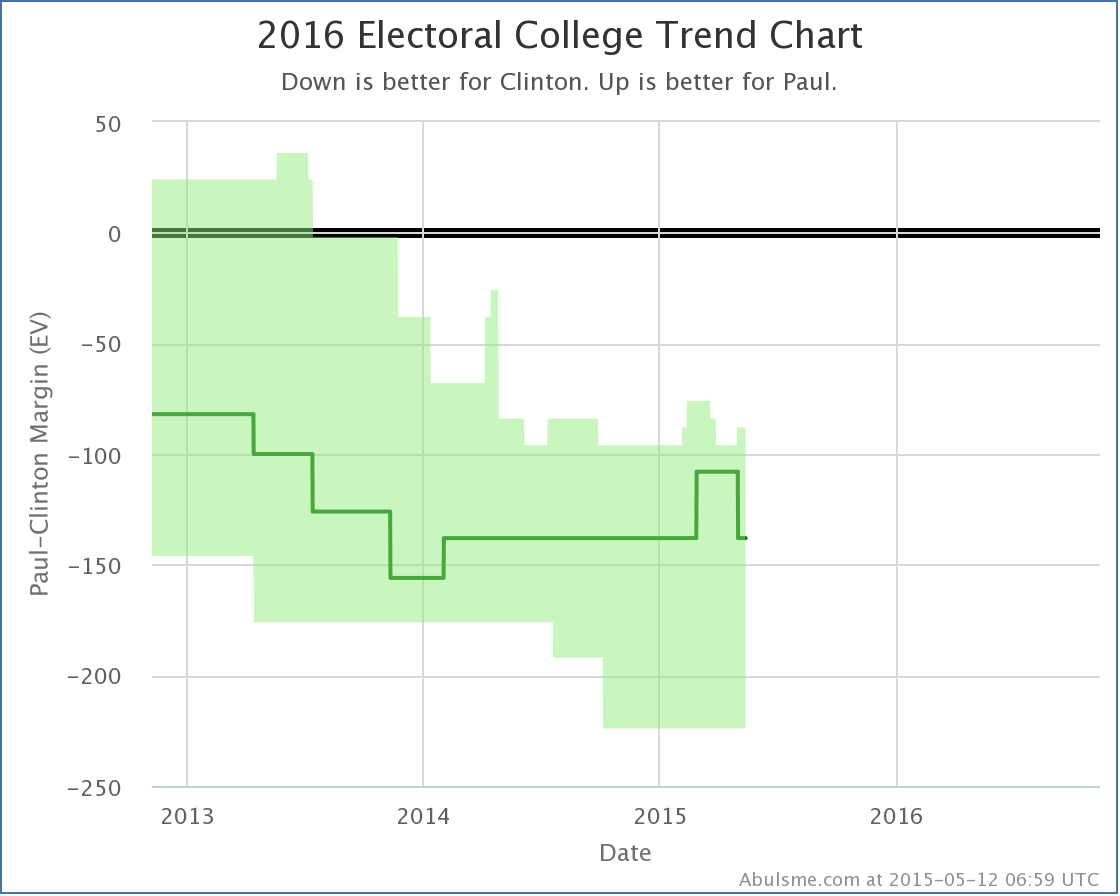
For now though, North Carolina returns to the Clinton side of the fence, and so the “Expected Case” moves 30 electoral votes toward Clinton:
With this Paul is back to losing to Clinton by 138 electoral votes, which is where he has been for most of the last year.
Note: This post is an update based on the data on my 2016 Electoral College Analysis Site. All of the charts and graphs seen here are from that site. Graphs, charts and raw data can be found there for the race nationally and in each state for every candidate combination that has been polled at the state level. In addition, comparisons of the best polled candidate combinations both nationally and each in each state are available. All charts above are clickable to go to the current version of the detail page the chart is from, which may contain more up to date information than the snapshots on this page, which were current as of the time of this post.
New polls added today. The ones that make a difference are new results from Dartmouth in New Hampshire. Specifically, two of our top five candidate pairs get status changes:
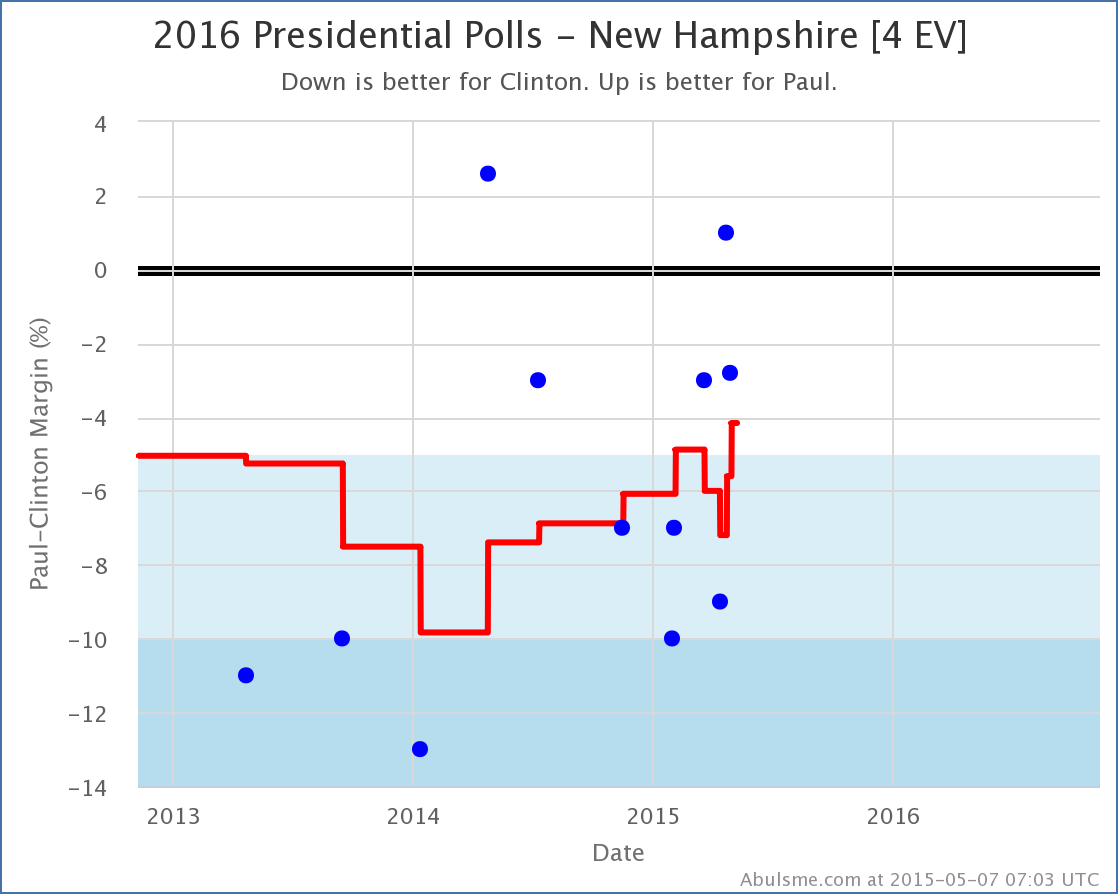
Clinton vs Paul
The latest polling once again moves New Hampshire into “Weak Clinton” territory. New Hampshire has been in and out of this category since the 2014 elections, but longer term trend here seems to be away from Clinton, so it is certainly possible New Hampshire will stay here for awhile, but it would also not be surprising if the state continues to bounce in and out of this category. For now, New Hampshire is back in play and improves Paul’s “best case”:
New Hampshire is a little state. It is the little bump in the top right of the “realistically possible” bubble above. Paul’s best case is still a long way from winning. That is not not the case with Clinton vs Bush.
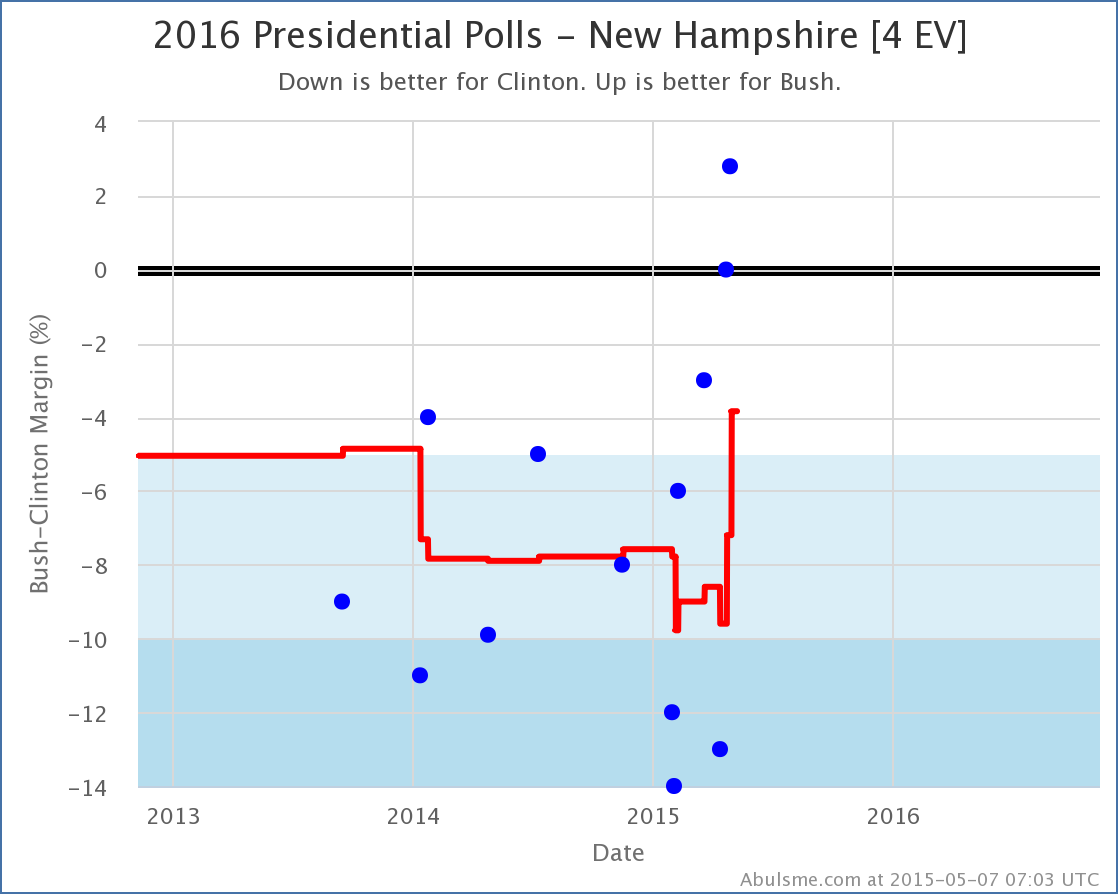
Clinton vs Bush
Bush’s improvement has been much more recent and sudden than Paul’s, so there is a greater chance this may just be a result of an outlier or two, and so it will be good to wait for confirmation from additional polls before thinking this is permanent, but for now, this is yet another state that has been moving Bushward…
Look at that spike! At the beginning of April, Bush’s best case was to lose to Clinton by 68 electoral votes. In the weeks since, Clintons lead in my poll average has declined to less than 5% in several states and now Bush’s best case is to lose by only 4 electoral votes! Yes, yes, this is still a loss, and this is still only assuming Bush can flip all of the states where Clinton is ahead by less than 5%, but this is still a big move. Bush only has to move one more state from the current “Strong Clinton” category into the “Weak Clinton” category to make his best case actually be to WIN.
Given current polling, the best candidates to try to reduce Clinton’s lead would be Minnesota (Clinton leads by 6.8%), Nevada (Clinton leads by 7.9%), Wisconsin (Clinton leads by 8.6%) or Ohio (Clinton leads by 9.2%). Making any one of those close would bring “Bush wins!” into the “possible bubble” for the first time since we’ve had any significant amount of 2016 polling.
Of course, after that, to really win, Bush needs to actually start flipping some more states to his side as opposed to just making them close.
But one thing at a time.
Note: This post is an update based on the data on my 2016 Electoral College Analysis Site. All of the charts and graphs seen here are from that site. Graphs, charts and raw data can be found there for the race nationally and in each state for every candidate combination that has been polled at the state level. In addition, comparisons of the best polled candidate combinations both nationally and each in each state are available. All charts above are clickable to go to the current version of the detail page the chart is from, which may contain more up to date information than the snapshots on this page, which were current as of the time of this post.
I added a bunch of new polls today, catching up after being preoccupied with something else the last few days.
The first thing to note is a change to the “top five best polled” candidate pairs. With the latest batch of polling, a well polled state (North Carolina) that had been really close in Clinton vs Walker became less close, and thus this combination slipped out of the top five, replaced by Clinton vs Ryan again. I expect this won’t last long, with one of Clinton vs Rubio, Clinton vs Cruz, or Clinton vs Walker once again jumping onto the top five very soon.
Within the top five candidate combinations, there were two changes of note this time:
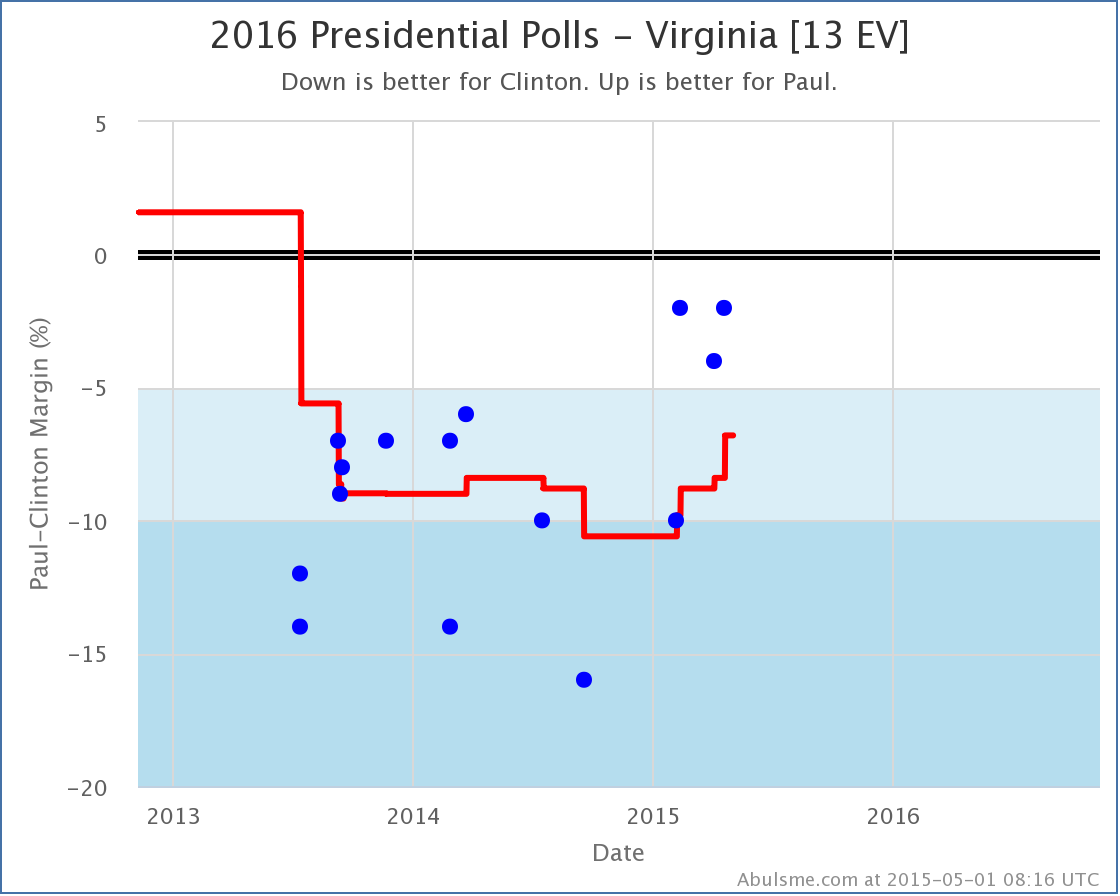
Clinton vs Paul
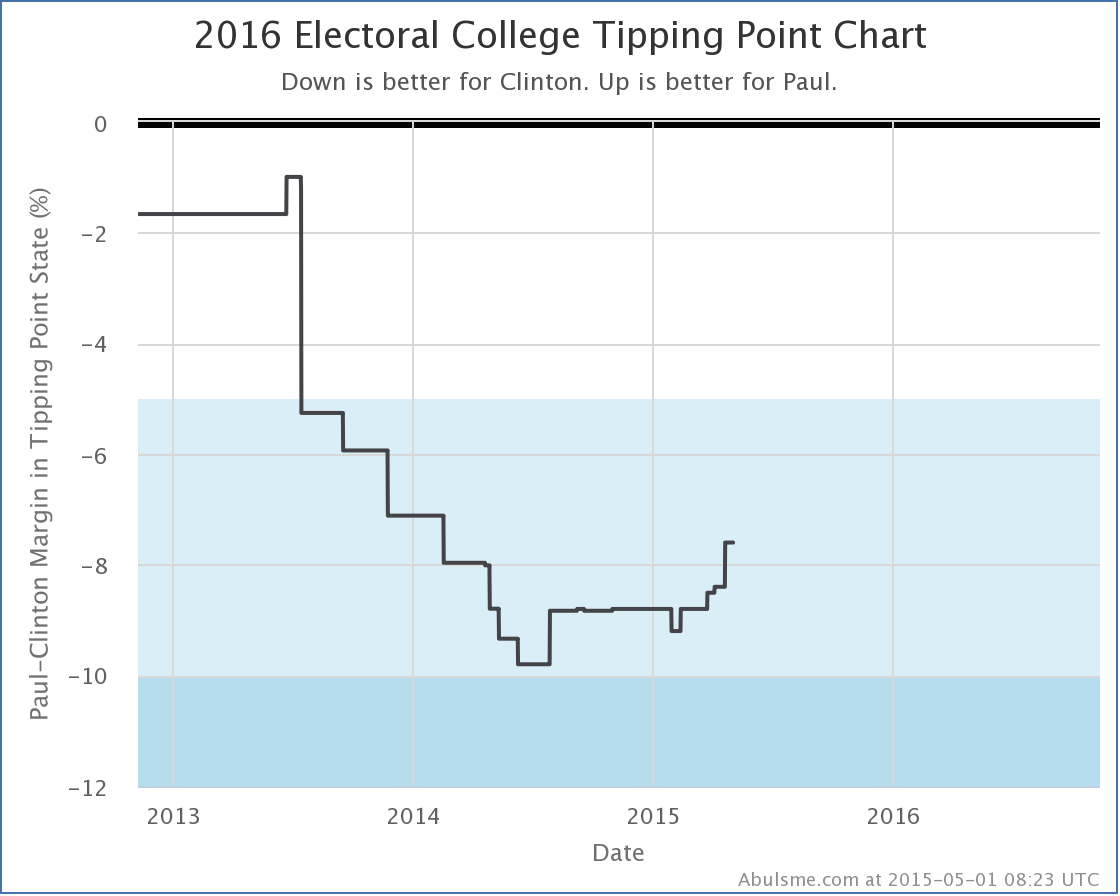
The latest polling in Virginia from CNU improves Paul’s situation in Virginia from losing by 8.4% to only losing by 6.8%. This does not change Virginia’s categorization as a “Strong Clinton” state, but since Virginia was the tipping point state, it moves that metric:
With this the tipping point moves from Clinton leading in Virginia by 8.4% to Clinton leading by 7.6% in Ohio. This is a nice bump toward Paul. We’re still in “Strong Clinton” territory by this metric of course, but this continues a general trend of Paul’s tipping point against Clinton improving ever since last summer. Paul and Bush are the only two Republicans in the current five best polled combinations that can claim a positive trend against Clinton on this metric.
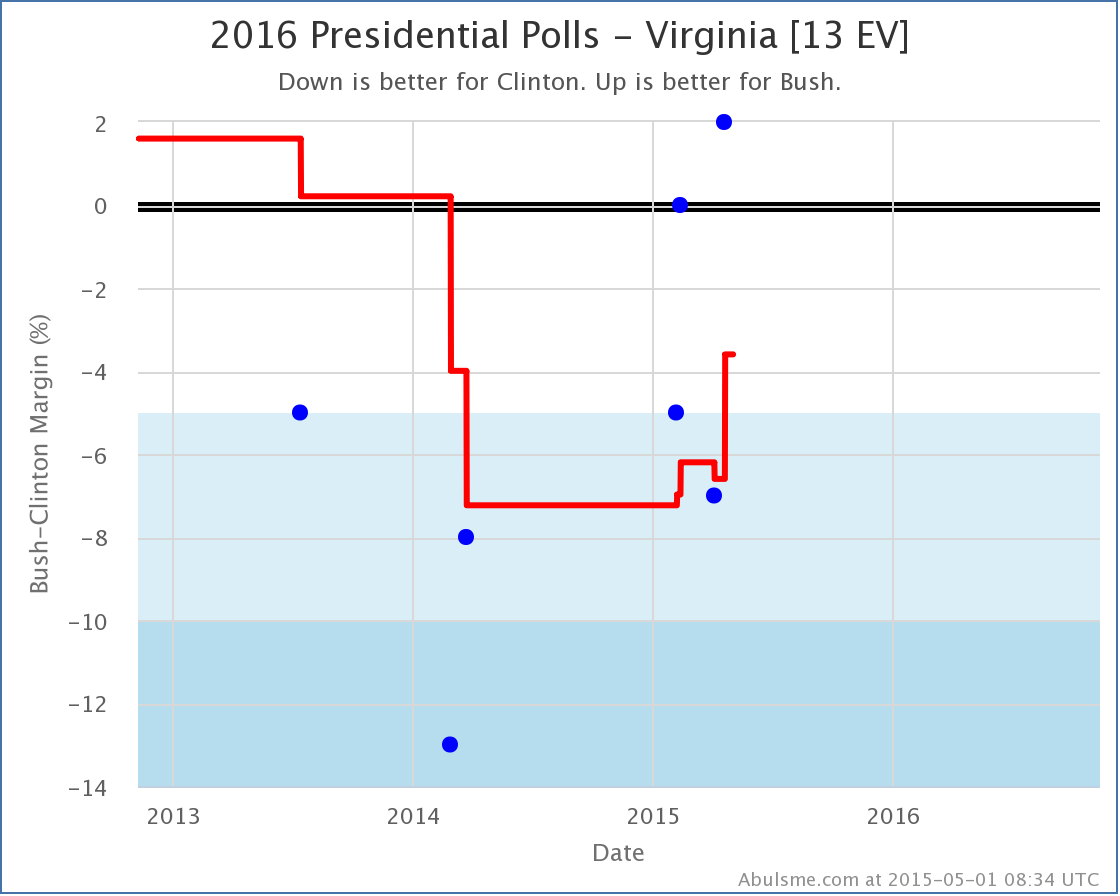
Clinton vs Bush
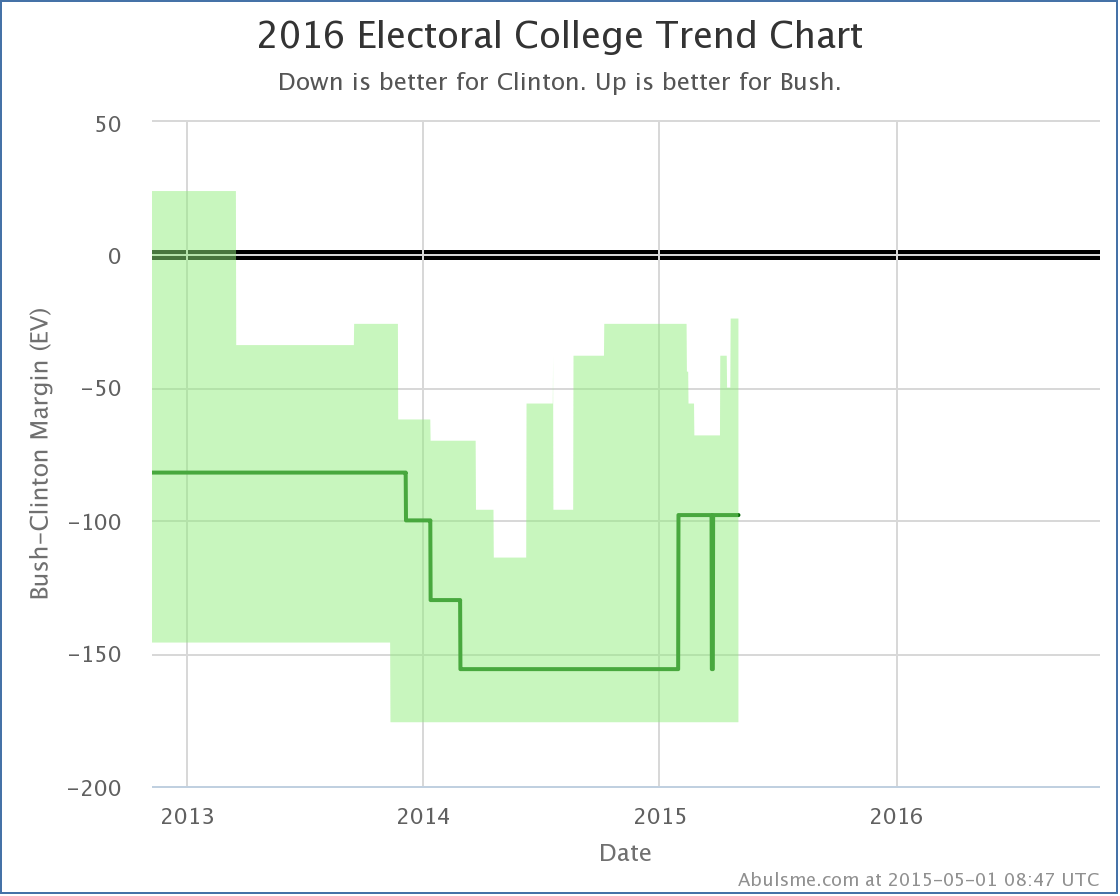
Once again it was the CNU Virginia poll making a difference. Clinton’s polling average lead vs Bush declines from 6.6% to 3.3% with this new poll. This moves Virginia from “Strong Clinton” to “Weak Clinton” and puts it back in play for Bush and improves his “best case” (which is where I give him not just the states he is ahead in, but all the states where Clinton is ahead by less than 5%):
This brings Bush’s best case to losing to Clinton by only 24 electoral votes. This is the best best case Bush has had since there was any real significant polling on 2016. Bush is currently doing better against than the other four Republicans in the five best polled combos in every metric I’m tracking. If he can make at least another 12 electoral votes close… say perhaps Iowa (6 EV) and Minnesota (10 EV)… the two “Strong Clinton” states that are the weakest for Clinton at the moment… then for the first time since early 2013 (when polling data was still sparse and we were mainly relying on previous elections) we’ll have a real race, where the Republican is actually in contention.
Others
Normally I wouldn’t mention combinations not in the top five, but since Clinton vs Walker just fell off with this update, I’ll briefly note that the news was mixed for him in today’s batch of polls. On the one hand, he improved in Virginia, which improved his tipping point. On the other hand, North Carolina flipped from Weak Walker to Weak Clinton, increasing the amount he would be expected to lose to Clinton by if each of them won all the states they were ahead in.
Note: This post is an update based on the data on my 2016 Electoral College Analysis Site. All of the charts and graphs seen here are from that site. Graphs, charts and raw data can be found there for the race nationally and in each state for every candidate combination that has been polled at the state level. In addition, comparisons of the best polled candidate combinations both nationally and each in each state are available. All charts above are clickable to go to the current version of the detail page the chart is from, which may contain more up to date information than the snapshots on this page, which were current as of the time of this post.
Earlier this week, Andrew Sullivan had a series of posts exploring trends in Texas that may eventually make it a swing state. (Part 1, Part 2, Part 3) This prompted me to wonder what the actual numbers were and what the trend might look like.
Demographic trends may well cause changes in the electoral balance in Texas at some point in the future, but looking at actual historical election results shows no such trend so far.
Similar to the chart I did of national trends on Sunday, the chart above shows the Democratic proportion of the two party vote (ignoring third parties) over the last 100 years, this time just for Texas. Over this timescale, clearly the trend is from a very reliable Democratic state prior to 1950 to a solid Republican state since 1970.
Looking just since 1970, one could argue that the trend is fairly flat, but if you look at how winning Democratic presidents have done, you see that Clinton did not match Carter’s numbers (Carter actually won Texas in 1976) and then Obama has not matched Clinton’s numbers. Each winning Democratic president has done worse in Texas than the one before.
Now, one could say that Obama did better in Texas than Kerry or Gore, and that would be quite true. But it seems like that is more just a factor of being a winning candidate, and thus having higher levels of support overall.
And in the most recent timeframe you can look at, Obama 2012 didn’t do as well as Obama 2008.
There may be underlying demographic trends that will eventually favor Democrats in Texas, but they haven’t actually started to bend the curve there quite yet.
But wait! There is another way of looking at this!
I hinted at it when I mentioned that the winning Democratic candidates (Obama, Clinton, Carter) got a boost compared to the losing Democratic candidates (Kerry, Gore, Dukakis, Mondale) just by virtue of being winners.
You can correct for this by looking at how Texas voted relative to the national vote rather than just looking at Texas in isolation. If you take the Democratic percentage of the two party vote in Texas, and subtract from that the Democratic percentage of the two party vote nationwide, you get a measure of how much more (or less) Democratic Texas is than the country at large. With this, you get the following chart:
I’ve left out the red and blue coloring this time because it clutters up the image, but this chart is a lot less noisy. You still see a very clear trend with Texas becoming less Democratic and more Republican over the last 100 years (compared to the rest of the country).
In this view however you CAN see an inflection point at the 2000 election. Up until 2000 Texas was clearly getting more Republican (compared to the rest of the country) with almost every election. Then that trend seems to stop.
In 2000 Texas was 11.2% more Republican than the nation.* Each election since then the difference between Texas and the national average has been slightly less. In 2004 Texas was 10.3% more Republican. In 2008 it was 9.6%. And in 2012 the preliminary numbers have it at 9.4%.
At that rate Texas still has a LONG time to go until it is really close to the national numbers. But with this view, you actually do see a trend with Texas’s Republican lean (relative to the rest of the country) decreasing slightly over the past few elections.
* I’m being slightly sloppy with language here, to be more correct I would say that the Democratic proportion of the 2 party vote was 11.2% less in Texas than the Democratic proportion of the 2 party vote nationwide.
OK. Lunch break time. I am allowing myself 45 minutes, and am doing this instead of eating lunch today. Bleh. Of course, they put out excess Halloween candy in the hallway, so I am not hurting for junk calories with no actual nutrition value. Woo! Anyway…
Port of Seattle Commissioner Position No. 1
One candidate. John Creighton. Leaving aside the Farscape reference (yes, I know it is spelled differently) the unopposed thing gets me again, and I write myself in. I vote for SAMUEL MINTER.
Port of Seattle Commissioner Position No. 3
Two candidates. Holland: Truck Fleet Salesperson. Supported by unions. Doud: Investment properties broker. Says he represents the whole county rather than just Seattle. Criticizes union support of opponent. I think I’ll go with the more business oriented Doud. I generally dislike the idea of unions, and therefore am wary of Holland. I will vote for DAVID DOUD.
Port of Seattle Commissioner Position No. 4
Two candidates. Albro: Touts his independence. Bunch of endorsements. Small business owner. An engineer. Vekich: Former longshore worker and Democratic Legislator. Says we don’t need an insider, but then lists a bunch of insiders who endorse him. Why are these elected positions again? The Stranger says: “The port needs a business-minded person who isn’t evil. That’s Tom Albro.” Ha! OK. Good enough. I’ll vote for TOM ALBRO.
City of Bellevue Council Position No. 2
Two candidates. Orrico: Involved in a lot of local commissions and such. Points out opponent is running for 4th term. Her website was done by a middle school aged relative (child?). Lee: Incumbent. Basically says he has done a good job so bring him back. Looking around I don’t see much about issues that are very contentious. I think multiple terms in local government is generally not a great idea though, and I liked the middle school designed website. So I’ll vote for VICKI ORRICO.
City of Bellevue Council Position No. 4
Two candidates. Wallace: Looks like he is the keep taxes low, fiscal responsibility, that sort of thing type. Also pushing light rail. Bonincontri: Some stuff about parks and quality of life and the like. There really isn’t much to go on here. Most of the stuff on both of them is of the “I’ll work to make things better” type. On balance though, I think I’m leaning Wallace. I will vote for KEVIN R. WALLACE.
City of Bellevue Council Position No. 6
Two candidates again. Marchand: Talks about jobs and pushing Bellevue to the next level. Davidson: 22 years on the city council. He says to reelect him because he has done a good job. OK. Marchand looks OK, and Davidson has just been there too long. I will vote for MICHAEL MARCHAND.
OK. My timer went off and my 45 minutes are up. I have five more races to make decisions on. They will have to wait for a few more hours until I am done with work. I did six in this last 45 minutes, so I should be able to finish up in another 45 minute batch. There should be plenty of time. I’ve got just under four hours left before the time I usually leave work, and just under six hours before the ballots are due. I can do that.