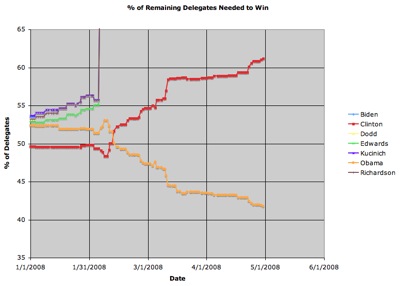
Starting today, a new chart. The chart above (click through for a full size version) shows the percentage of the remaining delegates that a candidate needs to get in order to get to the magic 2025 delegate number which will secure the nomination. I’ve been reporting this number for awhile now in my blog updates on the delegate race, but I think it helps to see it in this chart. (To be clear in case it isn’t obvious, on this chart going up is bad, moving down is good.)
These numbers, more so than any of the numbers being reported or looked at, gives the best picture of where the race really is, and what the “momentum” toward winning really is. This trend is absolutely clear at this point. Obama pulled ahead on February 13th and since then there have been only TWO DAYS (March 5th and March 22nd) where Clinton managed to move things in a direction that favored her. In the first case her gains were reversed within one day. In the second case it took 11 days. But then in each case, the trend toward it being harder for Clinton to win and easier for Obama to win has continued.
And at this point we have so few delegates remaining that even when a single superdelegate declares their preferences you can see these lines move visibly. And given where we are today, Clinton needs to get almost 2 delegates for every 1 delegate Obama gets in order to move her line in a direction favorable to her. So far, that just is not happening.
This is the chart that should be plastered all over the newspapers and the television every time there is any discussion of the state of the Democratic race. All of this talk of states being “won” or “lost” and the “momentum” coming out of those wins is complete bullshit. It is about delegates. And right now Clinton needs to get 61.2% of all remaining delegates in order to win. And that percentage has been increasing practically every single day for the last three months. As every day goes by, with each new batch of primary results or superdelegate announcements, it has been getting harder and harder for Clinton to win. But is that what we hear from the so called analysts of this race? No, not at all. Of course not. Why would we have any sort of analysis that was based on the actual mathematics of the race. Oh yeah, that’s right, “Math is Hard”. Bleh.
Now, she *has* gotten that percentage in at least a couple of states… Arkansas and New York come to mind. But it is very very rare, and very difficult. And to get the win she needs to reach that sort of percentage in ALL of the remaining 9 primaries *and* get that percentage of the remaining superdelegates. Many of these last 9 primaries are well made for Clinton. She may even reach that sort of percentage in West Virginia, Kentucky and Puerto Rico. Maybe. It is within the realm of possibility. But not in the rest. And the superdelegates certainly haven’t been moving in the ratios she needs.
Case in point, lets get to today’s actual delegate update.
Three new superdelegate declarations this time. Two for Obama, One for Clinton.
Updated stats:
The new delegate count is: Obama 1727, Clinton 1589, Edwards 19
In percent terms that is: Obama 51.8%, Clinton 47.7%, Edwards 0.6%
2025 delegates are needed to win.
There are 713 delegates yet to be determined.
Obama needs 298 more delegates to win.
Clinton needs 436 more delegates to win.
In percentage terms, that means:
Obama needs 41.8% of the remaining delegates to win.
Clinton needs 61.2% of the remaining delegates to win.
(Still no update on the final 2 Democratic delegates from the Pennsylvania primaries, or on ANY of the delegates from the Republican Pennsylvania primaries.)
Leave a Reply
You must be logged in to post a comment.