Today’s update (which included a Detroit News poll in MI and Quinnipiac polls in Florida, Ohio and Pennsylvania) brings seven changes of note to the five best polled candidate pairs. Plus Clinton vs Bush once again takes the top spot as the best polled candidate pair, but there isn’t much else to say about that. As usual, click on any of the charts for more details from election2016.abulsme.com or follow @ElecCollPolls on Twitter for detailed poll information as I add it.
Tipping Point Moves
Five of those seven changes are tipping point changes. (Reminder: The tipping point is the margin in the state that would put the winning candidate “over the top” in the electoral college.) The tipping point changed for all five of the candidate pairs, so instead of looking at them individually, lets look at the comparison:
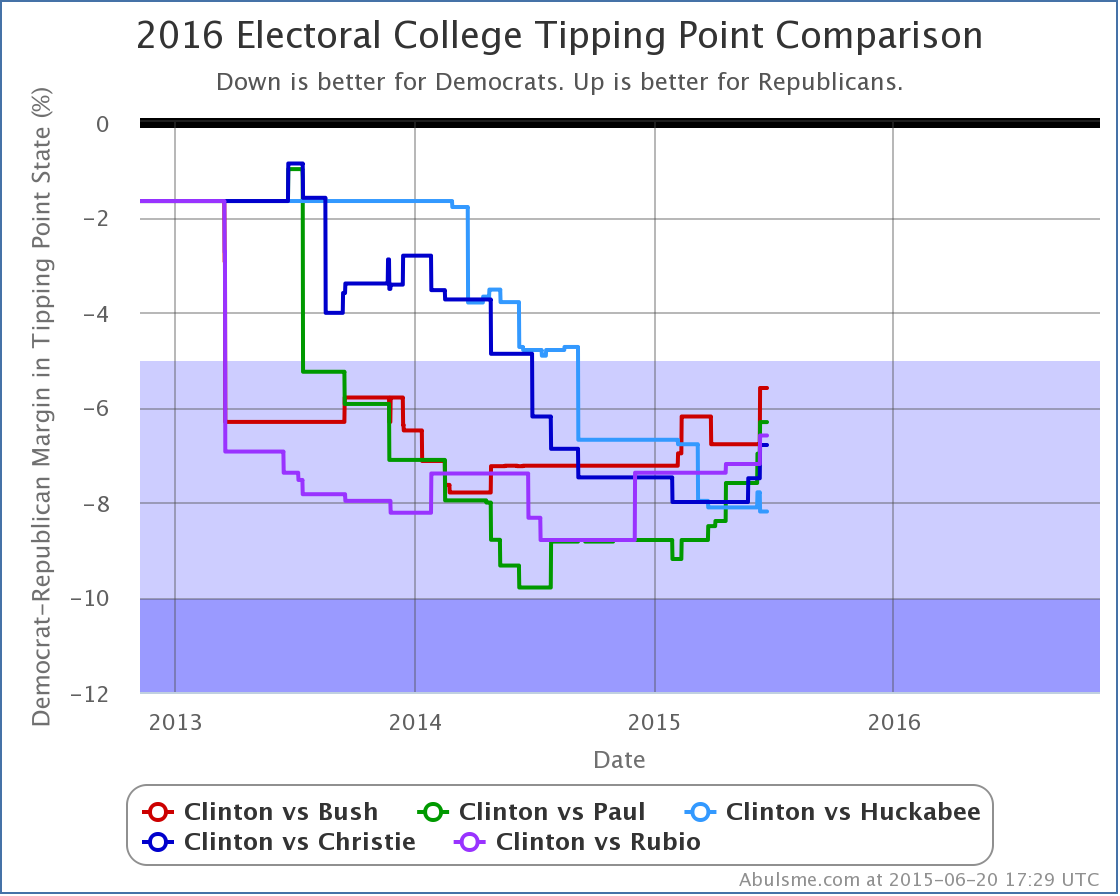
Looking both at the most recent change, and also at the change over the last three months, Bush, Paul, Christie and Rubio have all improved vs Clinton. Only Huckabee’s situation has worsened. For the candidates that are improving, the movement seems to be accelerating.
Bush’s tipping point specifically is down to only 5.6%. This still translates into a “Strong” lead for Clinton according to the categories I have defined, but we’re getting pretty close to the 5.0% boundary. Just a few more good polls for Bush in the right states, and the tipping point could move into the “Weak Clinton” zone, meaning that if Bush managed to win all of the close states (including the ones where Clinton is a little ahead) he would win. At that point, we would have an actual competitive race. Clinton would still be ahead, but a Bush win would be within the realm of reasonable possibility.
Clinton vs Bush
In addition to the tipping point changes, a couple of states changed categories. First up, Bush in Florida.
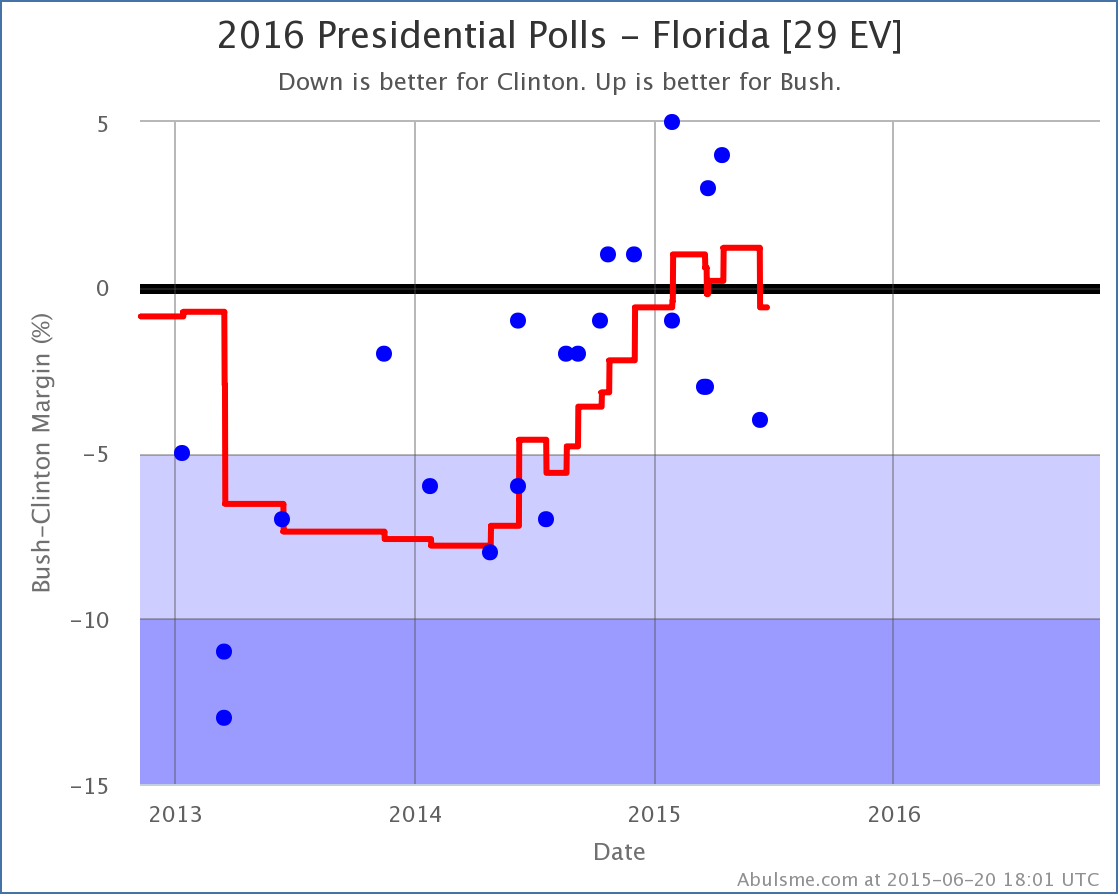
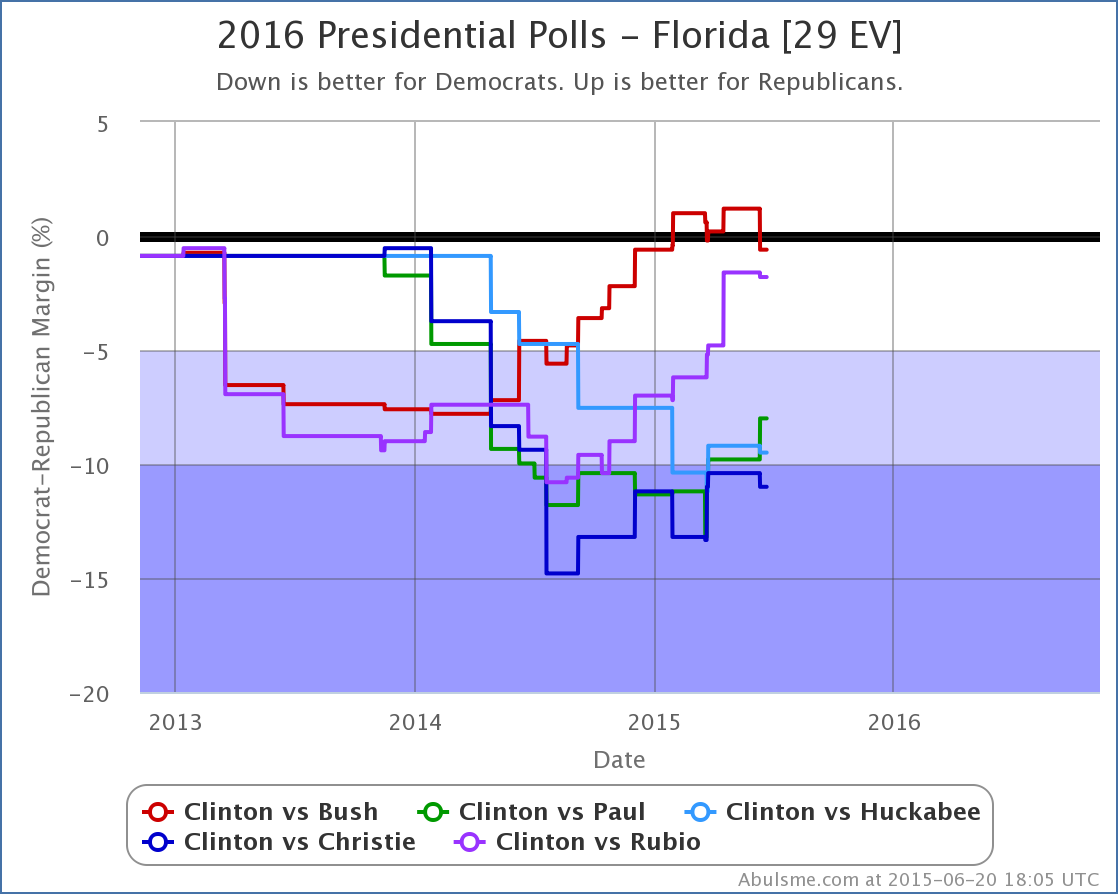
Florida moves from just barely Bush, to just barely Clinton. Bottom line, in this paring, Florida is close. Right now this is true for only Bush and Rubio. The other three Republican candidates in the top five polled pairs trail Clinton badly:
For Bush though, for the moment, Florida slips off the list of states he is ahead in, and his “expected case” drops:
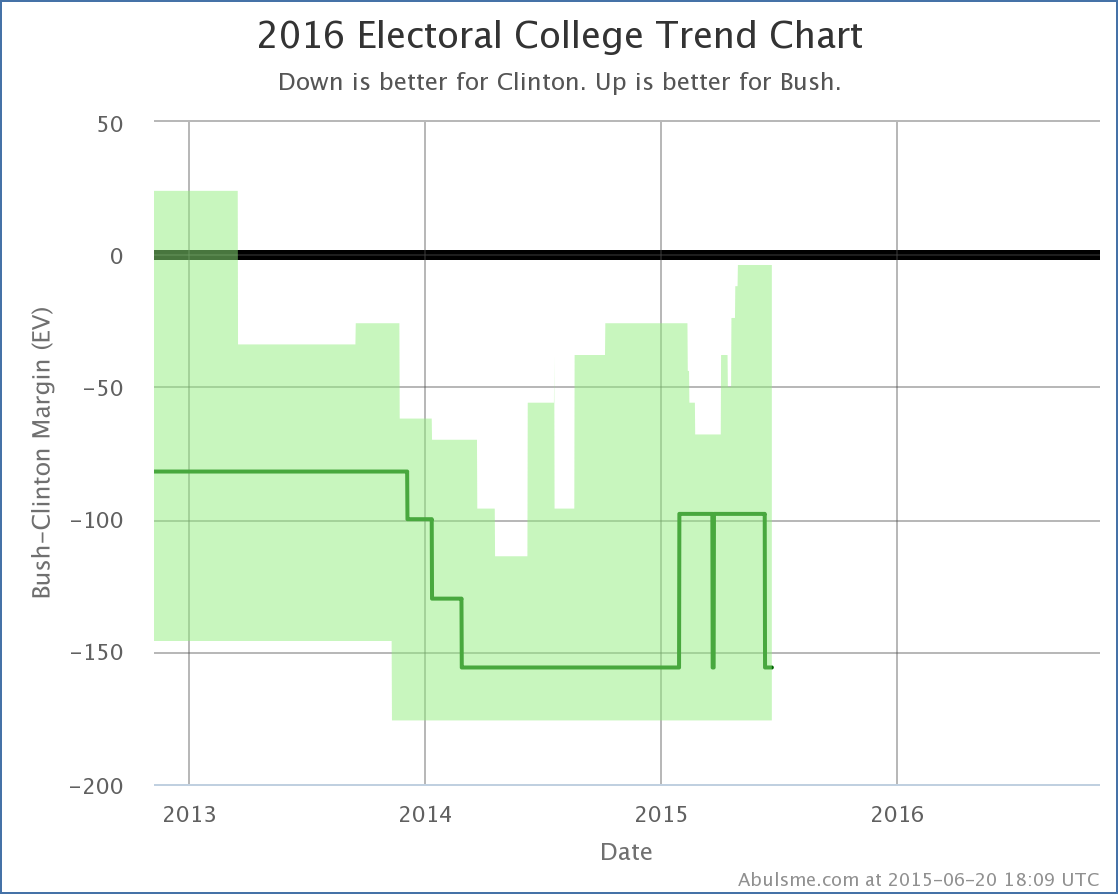
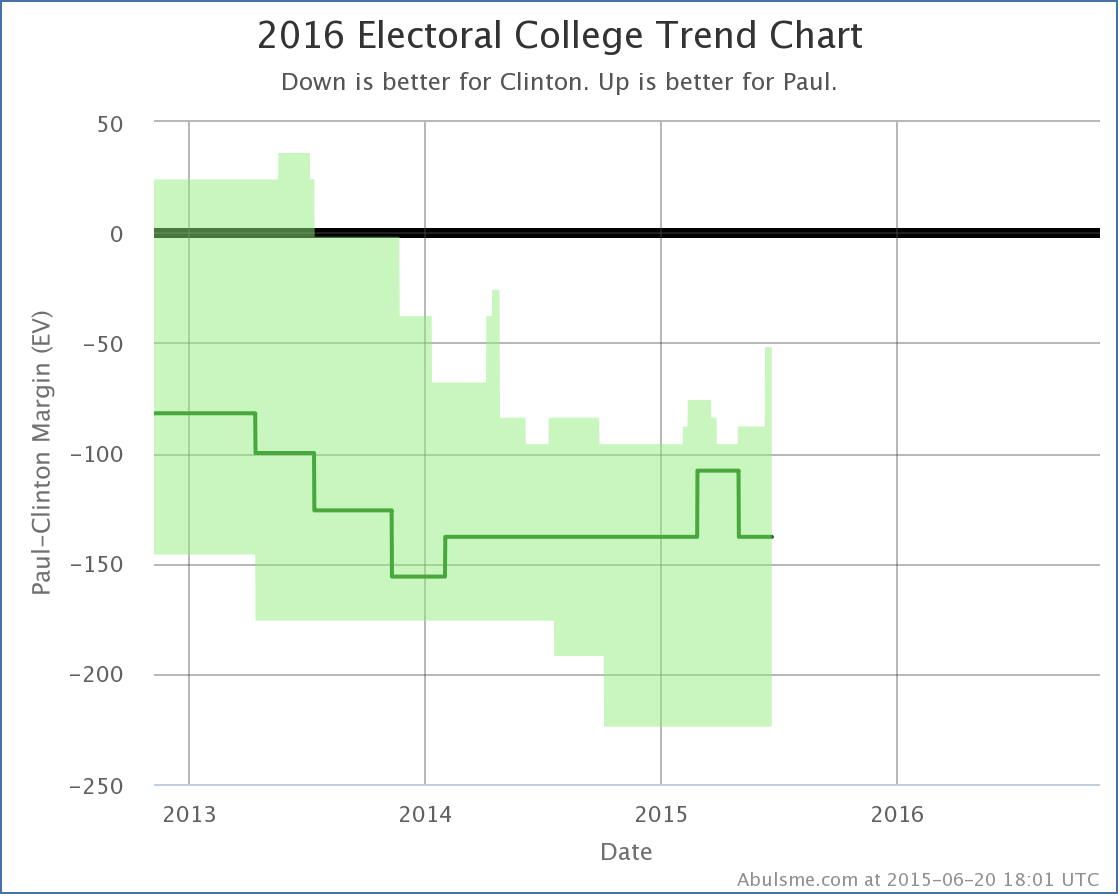
This brings Bush’s “expected” result back to Clinton 347 to Bush 191, a 156 electoral vote loss. (This is the same margin at the moment as Huckabee, Christie and Rubio… only Paul differs right now, losing by only 138 electoral votes because unlike the others, Paul is ahead in Colorado.)
Clinton vs Paul
The other category change is that in Clinton vs Paul, Ohio moves from Strong Clinton to Weak Clinton:
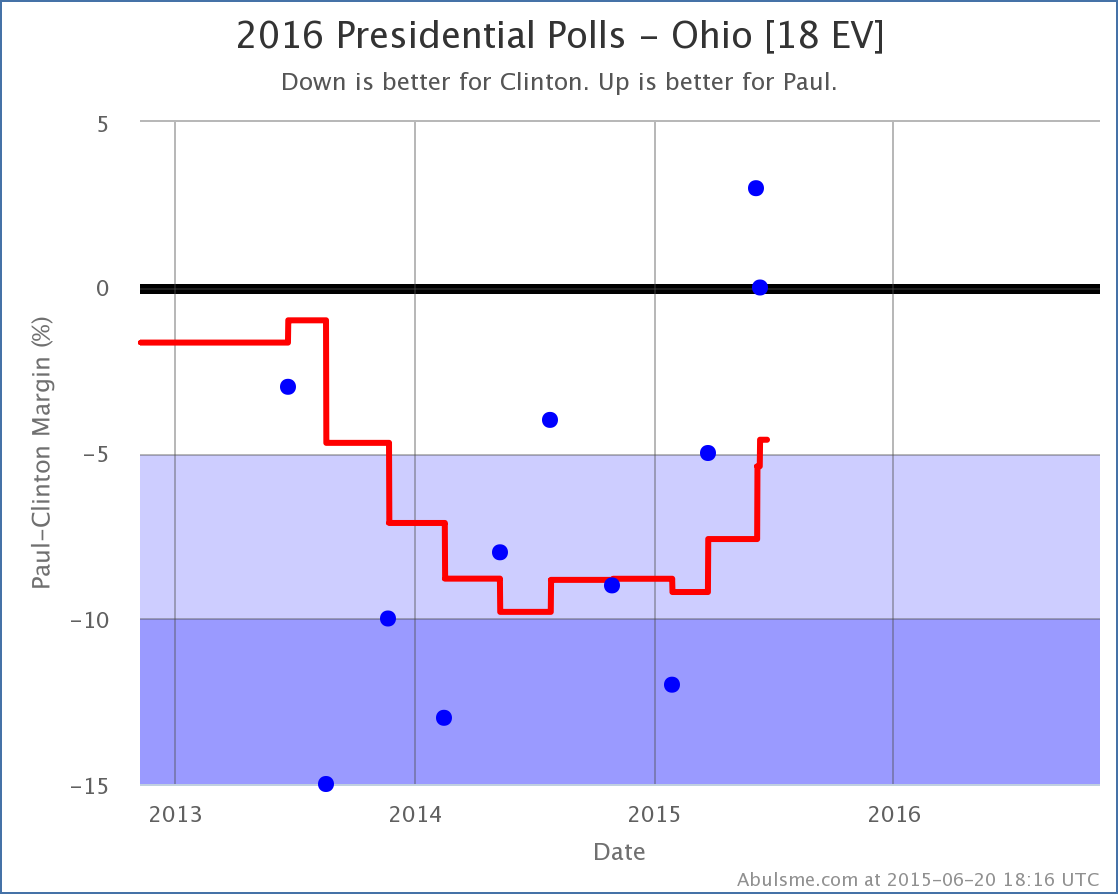
The last two polls actually show Paul ahead in Ohio. The average, which covers almost 8 months of polls at the moment, isn’t there yet, but it is moving in Paul’s direction. Ohio is looking closer and closer.
And that isn’t just Paul. If we do the comparison in Ohio, we see this movement is broader:
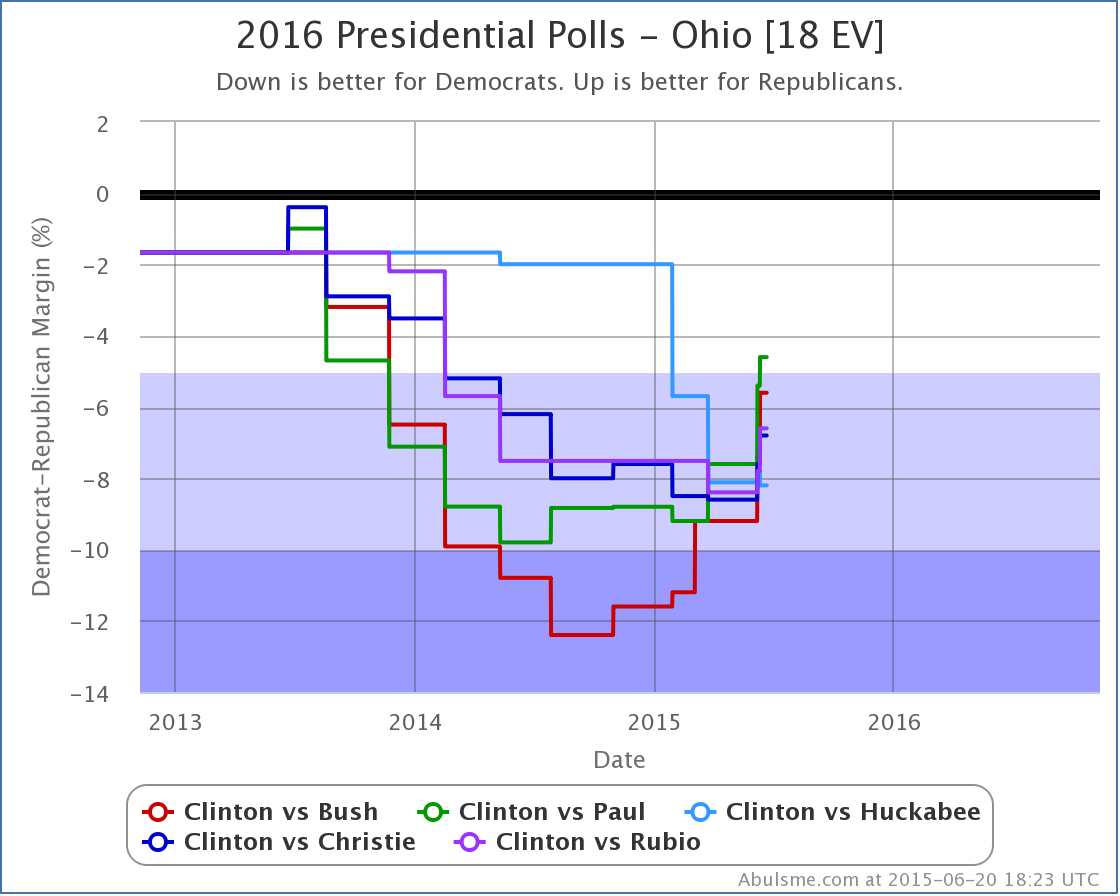
Once again, everybody except Huckabee is improving against Clinton. Or perhaps it would be better to say that Clinton is falling. Either way, Ohio is looking closer than it did. Paul is the first of these five candidates to move Ohio into the “potential win” category according to my classifications, but Bush isn’t far behind.
For Paul, this improves his “best case” where we give him all of the states he is ahead in, plus all the states where Clinton’s lead is less than 5%:
In his “best case” Paul now only loses to Clinton by 52 electoral votes. This is Paul’s best best case since I officially launched this analysis after the November election.
Pennsylvania
The polls this time around in Michigan didn’t change anything, but the ones in Pennsylvania are worth mentioning even though there were no category changes for any of the five candidate pairs.
Brandon Finnigan (@ConArtCritic) of the Ace of Spades HQ Decision Desk election tracking site tweets constantly about how Republicans should be targeting Pennsylvania as the keystone (get it?) to their election strategy. In his recent article “How The GOP Could Win Pennsylvania” he outlines the argument. So lets look at how the state is going given current polling. (Which of course will change a lot before we get to the election.)
Moves in Pennsylvania did contribute to some of the tipping point changes we talked about today, and when we look at Pennsylvania, we are seeing what looks like clear movement toward the Republicans, even though it isn’t quite switching categories yet:
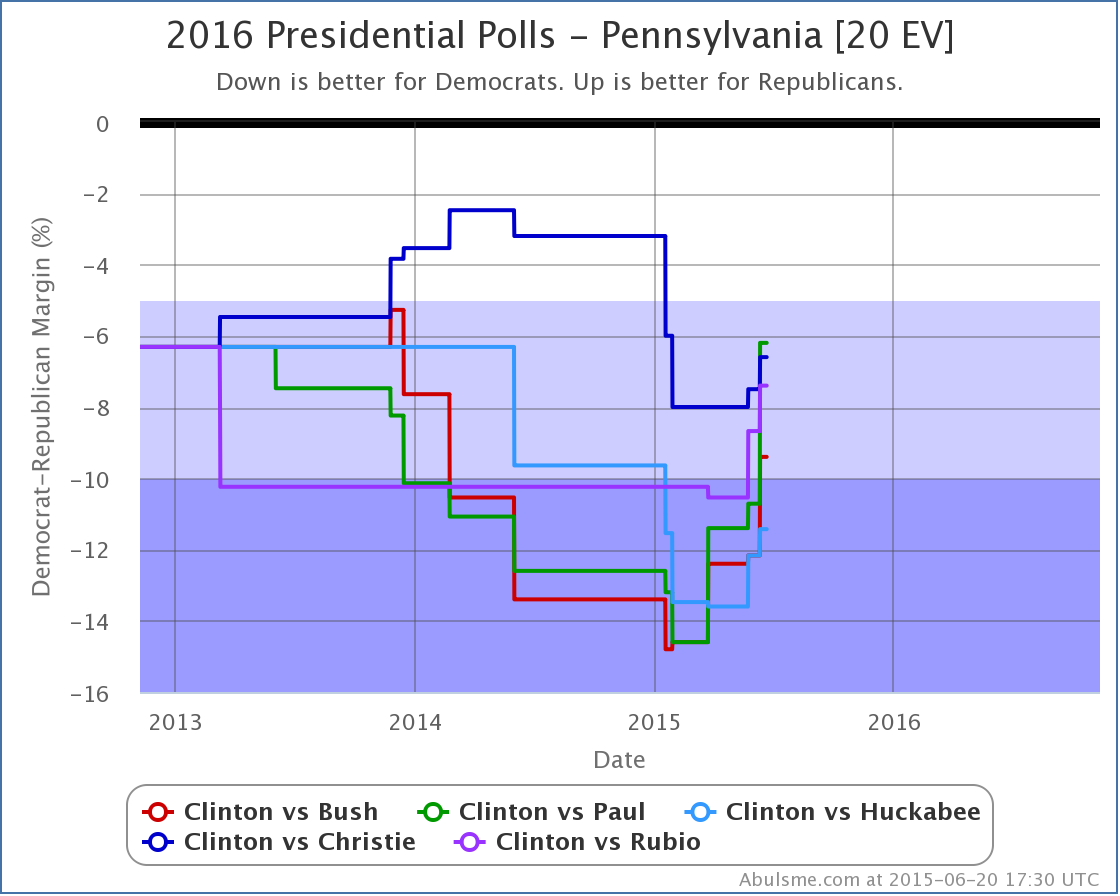
All five candidates have improved against Clinton in the last three months, some of them by large margins. Paul went from down by 14.6% in March, to down by only 6.2% right now. That is a huge move!
Now, this probably isn’t because any of the candidates are specifically targeting Pennsylvania at this point, but more likely just a reflection of Clinton’s overall decline nationally. None of the candidates have made it close in my poll averages yet, but Clinton’s margins have been narrowing rapidly.
Finnigan is certainly right that if the Republicans can make Pennsylvania close, let alone turn it red, this probably means an overall Republican victory in the electoral college, because whatever they did that could flip Pennsylvania would almost certainly flip other blue states that currently are closer than Pennsylvania as well.
Now, does that mean targeting Pennsylvania specifically rather than going after those closer states first is the best strategy? I don’t know.
For Bush for instance, if you start with the states he is already ahead in and then see which states he would need to flip to win, you get this list (in order by how far behind Bush is right now in my poll averages):
- Florida – 29 EV – Clinton ahead by 0.6%
- New Hampshire – 4 EV – Clinton ahead by 1.2%
- North Carolina – 15 EV – Clinton ahead by 2.9%
- Iowa – 6 EV – Clinton ahead by 3.2%
- Virginia – 13 EC – Clinton ahead by 3.6%
- Colorado – 9 EV – Clinton ahead by 4.2%
- Ohio – 18 EV – Clinton ahead by 5.6%
At that point Bush would have enough electoral votes to win. To get to Pennsylvania on this list, you’d have to also go past Minnesota, Nevada, Wisconsin, and Michigan. Then Pennsylvania.
Would it be better to concentrate directly on the seven states above? Or is jumping forward to Pennsylvania’s 20 electoral votes somehow an easier path? If Pennsylvania is specifically more vulnerable due to some of the factors Finnigan mentions, then maybe.
I think Finnigan’s point is broader than that though. It isn’t that Pennsylvania is a better target than Ohio or Colorado, although maybe it is. It is more that if the Republicans took Pennsylvania seriously, and did everything they needed to do to win Pennsylvania, then those same things could be applied more broadly, and a lot of other states would move too, and the Republicans would not just win, but win clearly, not a “just barely” sort of win like they got in 2000 and 2004.
The movement we’re seeing so far does show that Pennsylvania is movable. Can it move enough to make it red? I have my doubts absent the Democratic candidate simply collapsing on a nationwide basis. But Pennsylvania might be worth watching anyway…
Bottom Line
Aside from Florida moving her direction but remaining pretty close, and Huckabee generally not doing well, Clinton seems to be continuing to weaken against most Republicans. This reflects the campaign beginning to get under way in earnest, and the name recognition gap slowly diminishing. The question is where this trend ends. After a few debates happen, do we reach some sort of steady state Clinton lead a bit narrower than it is today, or do the Republicans continue to gain on her until we really have a race that could go either way, or even with Republicans in the lead?
As usual, stay tuned. 507 days to go!
Note: This post is an update based on the data on my 2016 Electoral College Analysis Site. All of the charts and graphs seen here are from that site. Graphs, charts and raw data can be found there for the race nationally and in each state for every candidate combination that has been polled at the state level. In addition, comparisons of the best polled candidate combinations both nationally and each in each state are available. All charts above are clickable to go to the current version of the detail page the chart is from, which may contain more up to date information than the snapshots on this page, which were current as of the time of this post. Follow @ElecCollPolls on Twitter for specific poll details as I add them.
Edit 23:07 UTC to add some additional links to the election site and Twitter.