- 02:21:41 [Blog Post] Republicans: Still in the grey zone https://t.co/Knd0kJv1yX
- 02:49:18 Some of the Rubio delegates may become unbound! -> Trump turns to charm to woo unbound delegates (Matt Viser) https://t.co/vAq6CwDaCr
- 03:39:07 Retweeted @sadydoyle 03:34:50 But, yeah, a lot of the "WHY ARE THE OLDS SO ANTI-BERNIE" might be because they look at him and see this: https://t.co/JvFBEvXTtF
- 04:38:01 Reading – Clinton sought secure smartphone, rebuffed by NSA (Michael Biesecker) https://t.co/SmlX5kfe4F
- 15:55:09 Reading – Could the GOP really break up into two parties? Here’s what history says. (Janell Ross) https://t.co/68dTfIzFsu
- 16:45:23 More Republican delegate loose ends -> What Really Happens To Rubio’s MN Delegates (Jeff Kolb) https://t.co/4UcNGHClG2
- 17:44:48 Listening to The Other Washington Episode 4: Gig Economy https://t.co/6csDpFjIWh
|
In my last post on the Republicans I used current polls to try to guess the March 15th results. This was my guess: Trump +226, Kasich +86, Cruz +36, Rubio +19 Results are not yet final in Missouri, and because it is winner take all in each congressional district as well as statewide, and it is close in most congressional districts, things could still swing there quite a bit. But for the moment, with the best estimates I had from Green Papers, the actual results from the 15th were: Trump +229, Kasich +81, Cruz +51, Rubio +6 Cruz got a bit more than my predictions, Rubio a bit less. But basically using the polls a couple days out got things pretty spot on. So minus any big changes from Missouri or minor adjustments elsewhere, this was the expected scenario. So time to look at some graphs, including some I don’t usually bother with…
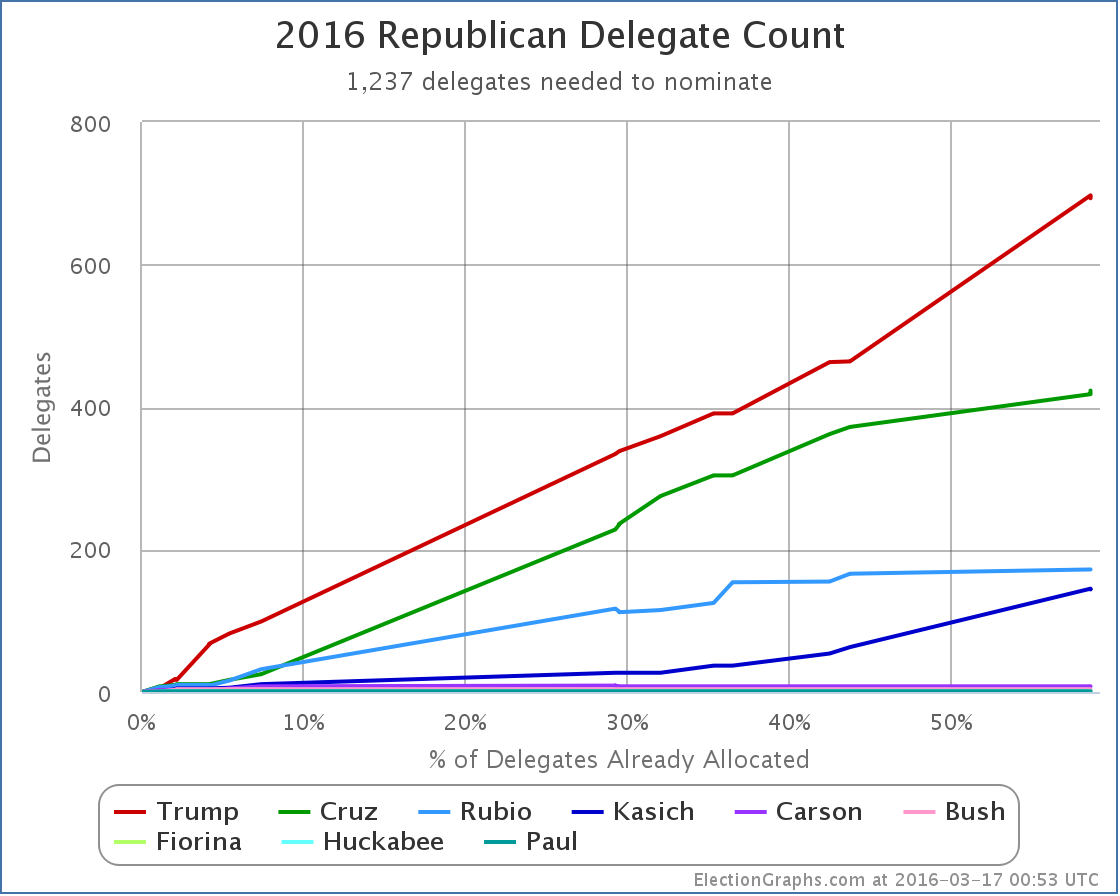
In raw delegate counts we now have: Trump 693, Cruz 423, Rubio 172, Kasich 144, Carson 8, Bush 4, Fiorina 1, Huckabee 1, Paul 1 Trump, Cruz and Kasich both look like they made significant improvements, but…
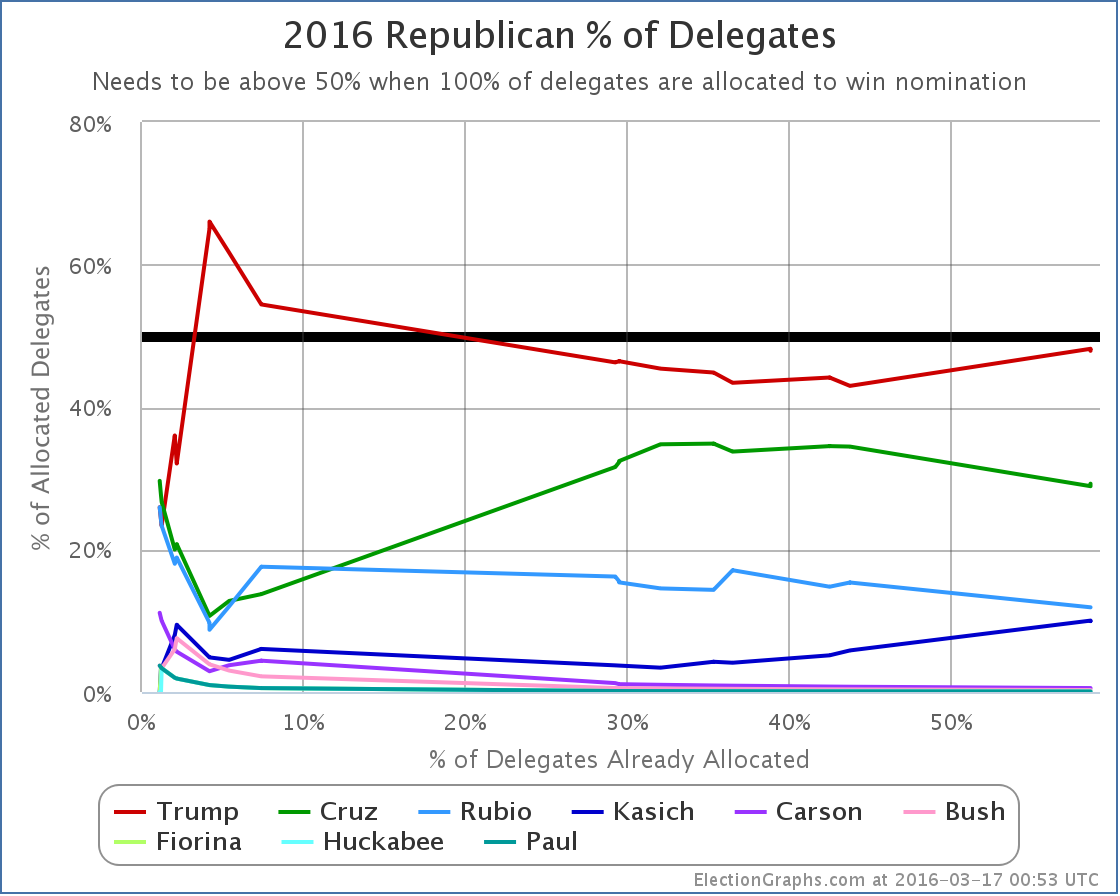
This is the percentage of delegates allocated so far to each candidate. Trump is just BARELY under the 50% mark. Only Trump and Kasich improved on this metric with the March 15th results. But… looking at the much more useful “% of remaining delegates needed to win” graph…
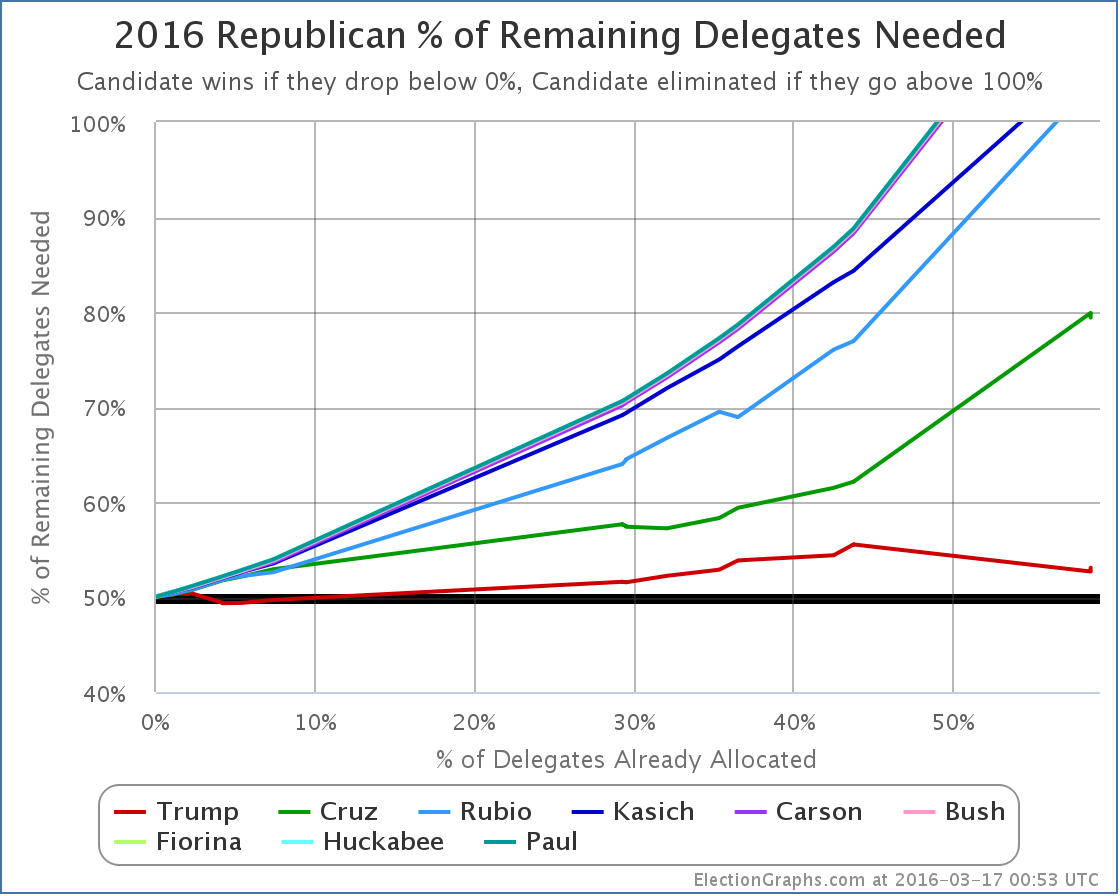
Everybody except Trump got further away from the nomination after March 15th. In fact, all of them got a LOT farther from the nomination. In fact, almost all the candidates have now been mathematically eliminated from a first round convention win. We knew for a long time that Paul, Huckabee, Fiorina, Bush and Carson were headed there. But it is now official. But Rubio was also eliminated. And despite his “big win” in Ohio, so was Kasich. All of these candidates could get every delegate still outstanding… and still not end up with enough delegates to win. Only Trump and Cruz still have the possibility of collecting a majority of the delegates before the convention. And Cruz just went from needing 62.14% of the remaining delegates, to needing 79.41%. This is a completely unrealistic number, even if it was a two person race between him and Trump. (For the moment, despite it being impossible for him to get enough delegates, Kasich is staying in, so we still have a three way split, which favors Trump.) Trump needs 53.07% of the remaining delegates to win outright. Less than that will get us to a contested convention and all kind of chaos. But how likely is Trump to get those sorts of margins? So far of course he has only gotten 47.89% of the delegates. So he does have to improve on his previous performance by about 11%. This sounds like a lot, but it is probably quite reachable. First, Trump will undoubtedly pick up some of Rubio’s supporters, they won’t all go to Cruz and Kasich. Second, there are a number of winner take all states coming up. Third, a lot of the states that are not winner take all are still winner take most. Basically, the structure of the primary calendar is DESIGNED to help the front running candidate wrap things up. It is not unreasonable to think Trump will be able to do that. To stop it, Cruz and Kasich between them need to be getting more than a majority of the delegates despite the fact that neither of them has a realistic shot at an outright win. The only plan for those two is to force the contested convention, then win there. Some places have tried to game out all of the remaining primaries and caucuses, and they conclude that we may in fact not know if we have an outright Trump win or a contested convention until the very last contests on on June 7th. That would be California, Montana, New Jersey, New Mexico and South Dakota. And there is a possibility we won’t even know until after that, because although their numbers are small, some states and territories have actually elected uncommitted delegates, who like superdelegates on the Democratic side are free agents able to vote however they see fit. There is a posisbility (a small one, but non-zero) that these uncommitted delegates may be in a position to determine if there will indeed be a contested convention. I won’t try to game out the rest of the season, but I will look at next Tuesday… Arizona, Utah, and American Samoa. As usual, looking at RCP for polls, and Green Papers for delegate rules. But guess what? As of today, there has been NO recent polling on any of these three. So we’ll use national polling, but eliminating candidates who have dropped out. So Trump 36.0%, Cruz 21.8%, Kasich 12.0%. Normalized to 100%, that is Trump 51.6%, Cruz 31.2%, Kasich 17.2%..
Now, either Arizona or Utah COULD go in a completely different direction. As I said, there has been no recent polling. So who really knows? But if Trump ends up winning both, he will likely get something close to 98 delegates out of the two states. If that happened, that would put the total delegate count at: Trump 791, Cruz 423, Rubio 172, Kasich 144, Carson 8, Bush 4, Fiorina 1, Huckabee 1, Paul 1 That would give Trump 51.20% of the delegates. He would once again have a majority of the delegates. Trump would then need 446 delegates to win outright. There would be 927 delegates left undetermined at that point. So Trump would only need 48.11% of the remaining delegates to win. Which given his history at that point seems quite reachable. But continuing to block him might still be within reach. Cruz + Kasich would only need to manage about 52% of the delegates. Which might be possible if they could build on anti-Trump sentiment even in the face of Trump winning. If they can do that is a big open question though. The “I can’t win, and you might not even like me, but vote for me to block the other guy and cause a contested convention where the outcome is completely unknown” case may not be the easiest one to make. But if Cruz and Kasich can make that case, then it is not over yet. So then we start looking at North Dakota, Wisconsin, Colorado… and beyond. Of course, if Trump loses Arizona or Utah, that all changes. So we will have to wait and see… but if I had to put odds on it, I’m still thinking about an 80% chance that Trump just wins this outright. The structure of the contests themselves are designed to help the front runner, and that is Trump. [Update 2016-03-18 06:21 UTC – As per Alaska’s rules, after Rubio dropped out they reassigned his delegates to the remaining candidates. Result: Trump +3, Cruz +2, Rubio -5.] [Update 2016-03-23 01:43 UTC – The Virgin Islands updated their delegate results because the original slate of delegates (all uncommitted) did not end up qualifying under the rules (see here). The original delegates were replaced by alternates. The result for the counts was Rubio +2, Cruz +1, Trump +1.] Note: This post is an update based on the data on ElectionGraphs.com. Election Graphs tracks both a poll based estimate of the Electoral College and a numbers based look at the Delegate Races. All of the charts and graphs seen in this post are from that site. Additional graphs, charts and raw data can be found there. All charts above are clickable to go to the current version of the detail page the chart is from, which may contain more up to date information than the snapshots on this page, which were current as of the time of this post. Follow @ElectionGraphs on Twitter or like Election Graphs on Facebook to see announcements of updates or to join the conversation. For those interested in individual general election poll updates, follow @ElecCollPolls on Twitter for all the polls as they are added. [Edit 02:27 UTC to add final bit about odds.]
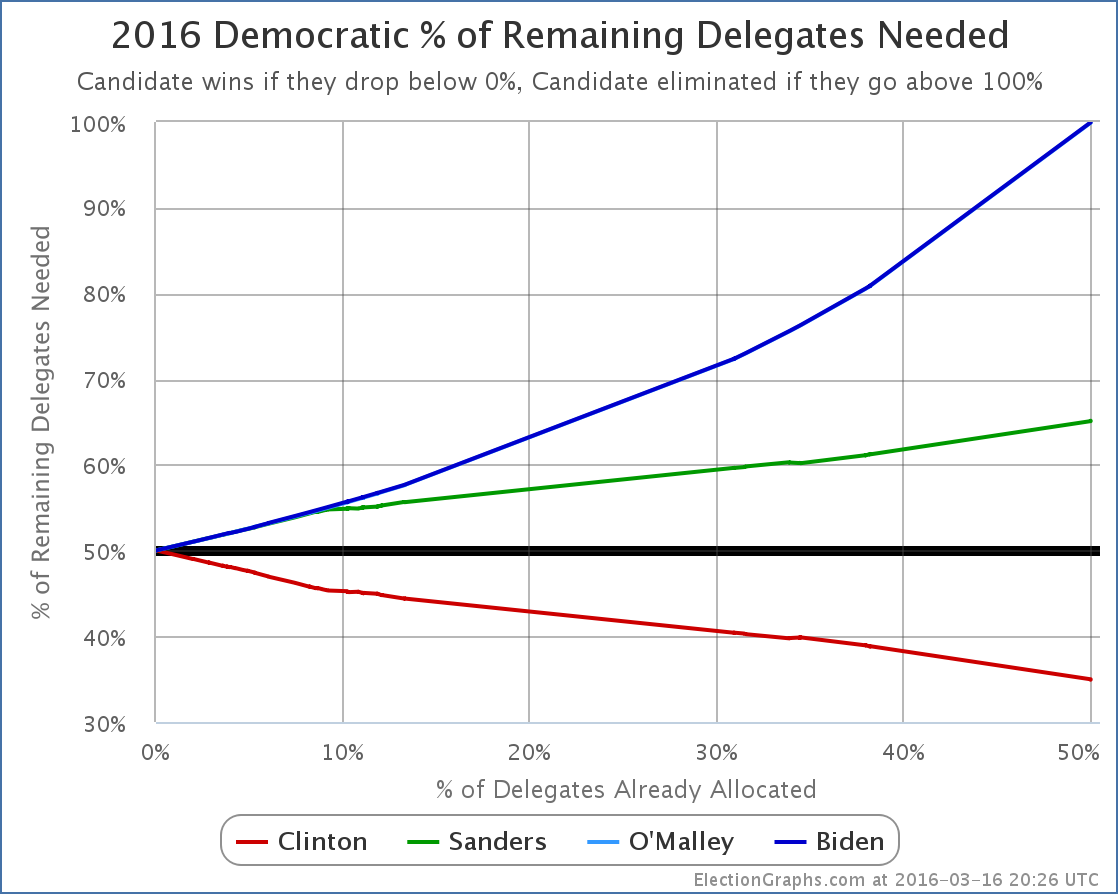
As of when I started writing this post, the results from the March 15th contests on the Democratic side were: Clinton +312, Sanders +251, TBD 128* In addition, since the last post other revisions netted: Clinton +3, Sanders +1. So of the delegates allocated since that last update, Clinton got 55.6%. She only needed 38.90% of the delegates to be on pace to win. So the updated “% of remaining needed to win” graph looks like this…
Clinton only needs 34.94% of the remaining delegates to win. Of course, if massive numbers of superdelegates start changing their minds, that number would get higher. Enough superdelegates flipping could in fact still put Sanders in the lead! But superdelegates haven’t been changing their minds in significant numbers yet. And so Clinton’s delegate accumulation continues. * I waited awhile before writing this post because the final disposition of 64 delegates each from Florida and Illinois is still undetermined as per my source (Green Papers). But at some point I had to go ahead with what I had. Those delegates are likely to split along the same lines as the other delegates from those states though, and they are unlikely to change the overall picture. If there are additional updates for those delegates before the results from Arizona, Idaho and Utah come in, I will add updates to the post with those results. [Update 2016-03-17 00:30 UTC – And here is the first of those updates. With updates to both Florida and Illinois, Clinton added 64 more delegates, and Sanders added 11. All 64 TBD delegates from Florida are now accounted for. There are still 53 delegates TBD in Illinois. Clinton now only needs 33.30% of the remaining delegates, while Sanders needs 66.78%. In addition, with this update O’Malley is officially mathematically eliminated.] [Update 2016-03-18 05:20 UTC – Update today for both Illinois and Ohio. Net result Clinton gained another 21 delegates, Sanders gained 32. There are no more TBD delegates remaining. Clinton now needs 33.16% of the remaining delegates while Sanders needs 66.93%.] [Update 2016-03-18 05:41 UTC – Superdelegate scan, Net: Clinton -1] [Update 2016-03-20 16:12 UTC – Superdelegate scan, Net: Clinton +1] [Update 2016-03-22 11:27 UTC – Superdelegate scan: Net: Clinton +5, Sanders +0.5 (Democrats Abroad superdelegates get half a vote)] Note: This post is an update based on the data on ElectionGraphs.com. Election Graphs tracks both a poll based estimate of the Electoral College and a numbers based look at the Delegate Races. All of the charts and graphs seen in this post are from that site. Additional graphs, charts and raw data can be found there. All charts above are clickable to go to the current version of the detail page the chart is from, which may contain more up to date information than the snapshots on this page, which were current as of the time of this post. Follow @ElectionGraphs on Twitter or like Election Graphs on Facebook to see announcements of updates or to join the conversation. For those interested in individual general election poll updates, follow @ElecCollPolls on Twitter for all the polls as they are added. [Update 2016-03-17 15:45 UTC to correct slight error in the second decimal place of the “needs” numbers for Clinton and Sanders in the 2016-03-17 00:30 UTC update note.]
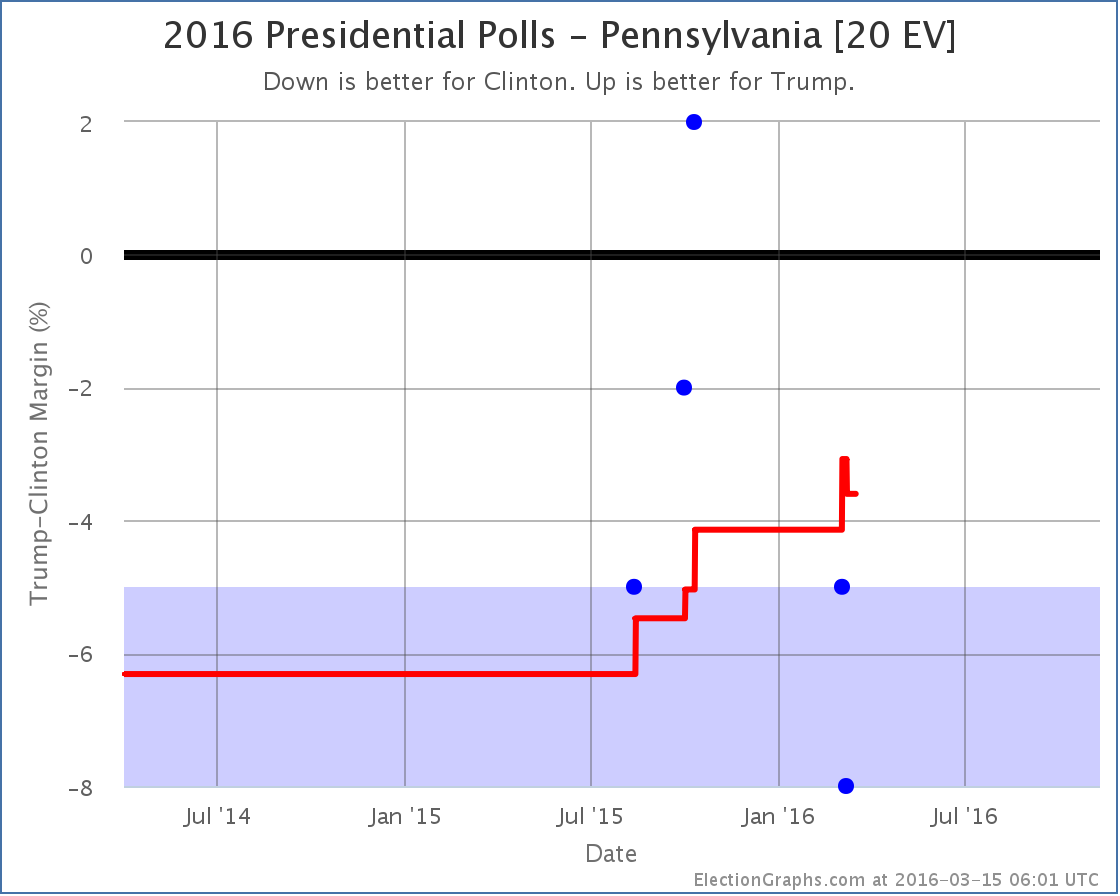
Yeah, yeah, primaries. Another general election poll, this time in Pennsylvania. They polled a bunch of different candidate combinations, but the one with a significant change was Clinton vs Trump:
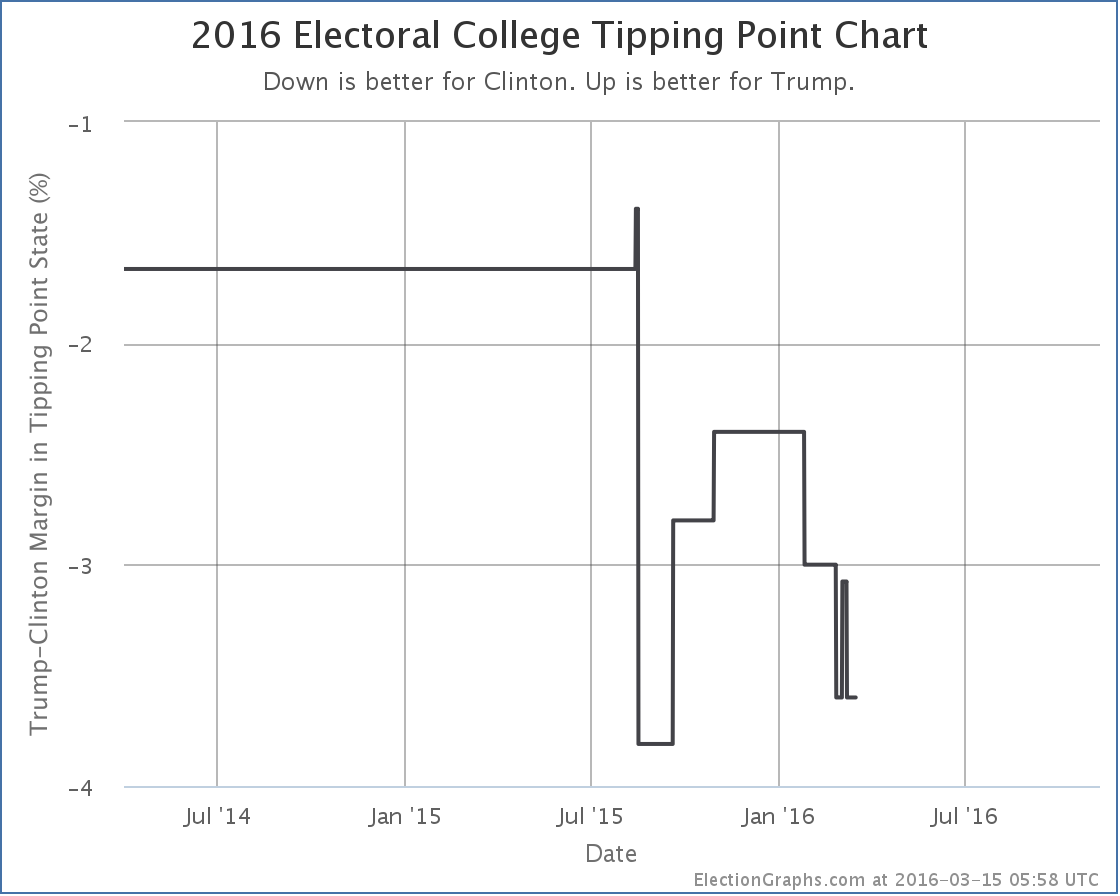
No category change. Pennsylvania stays “Weak Clinton”. But Pennsylvania was the tipping point state in Clinton vs Trump, so when Pennsylvania moves, so does the tipping point:
The tipping point goes from Clinton by 3.1% in Pennsylvania, to Clinton by 3.6% in Pennsylvania… which happens to be the same as it was just a few days earlier. So things just bouncing around a little bit. The trend since January on the tipping point seems to be away from Trump and toward Clinton… but there is lots of time yet. 238.0 days until the polls start closing on election day. Note: This post is an update based on the data on ElectionGraphs.com. Election Graphs tracks both a poll based estimate of the Electoral College and a numbers based look at the Delegate Races. All of the charts and graphs seen in this post are from that site. Additional graphs, charts and raw data can be found there. All charts above are clickable to go to the current version of the detail page the chart is from, which may contain more up to date information than the snapshots on this page, which were current as of the time of this post. Follow @ElectionGraphs on Twitter or like Election Graphs on Facebook to see announcements of updates or to join the conversation. For those interested in individual general election poll updates, follow @ElecCollPolls on Twitter for all the polls as they are added.
|
||