This is the website of Abulsme Noibatno Itramne (also known as Sam Minter).
Posts here are rare these days. For current stuff, follow me on Mastodon
|
Trump clinched the nomination a week and a half ago but there were a few more contests left. CA/NJ/SD/MT/NM have now weighed in with their 303 delegates. Trump got all 303. As an unopposed candidate at this point, this is not unexpected.
And while the Democrats still have DC left, this is the end of the primary process on the Republican side. There are still 18 uncommitted delegates whose preferences are unknown, but their decisions at this point won’t change much.
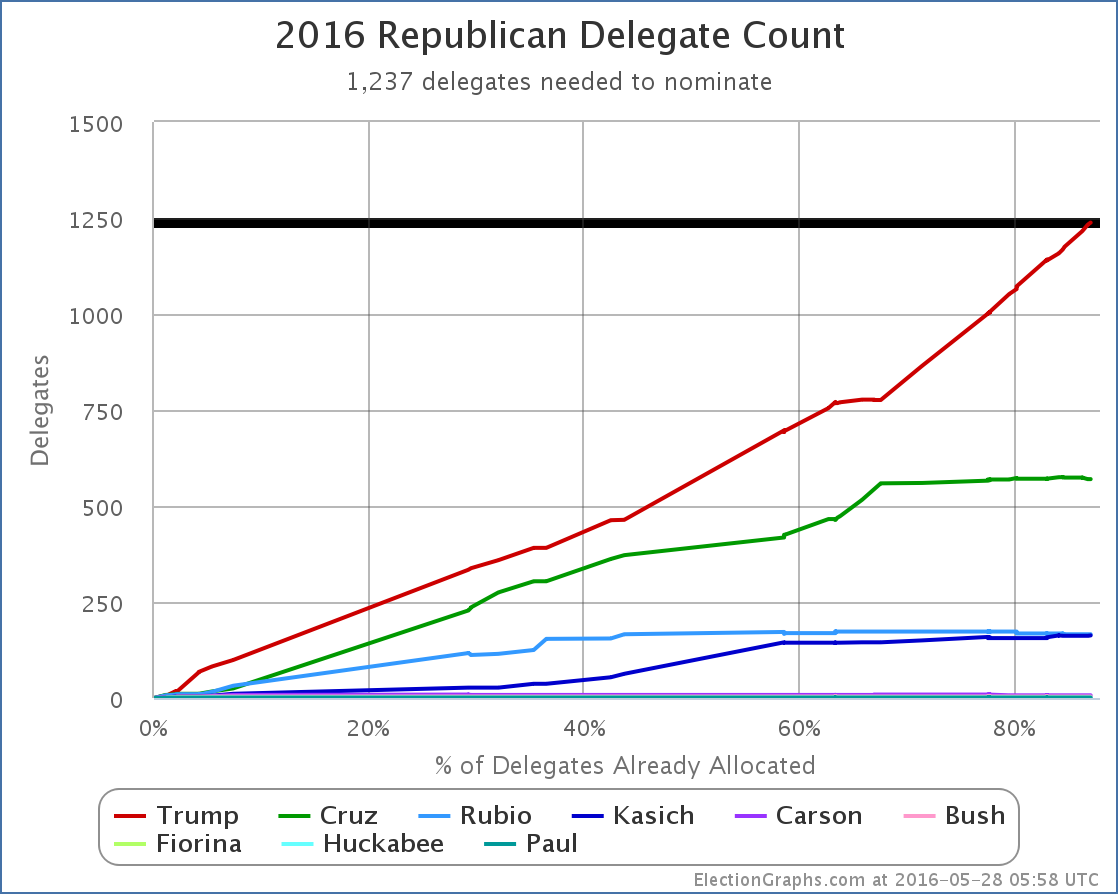
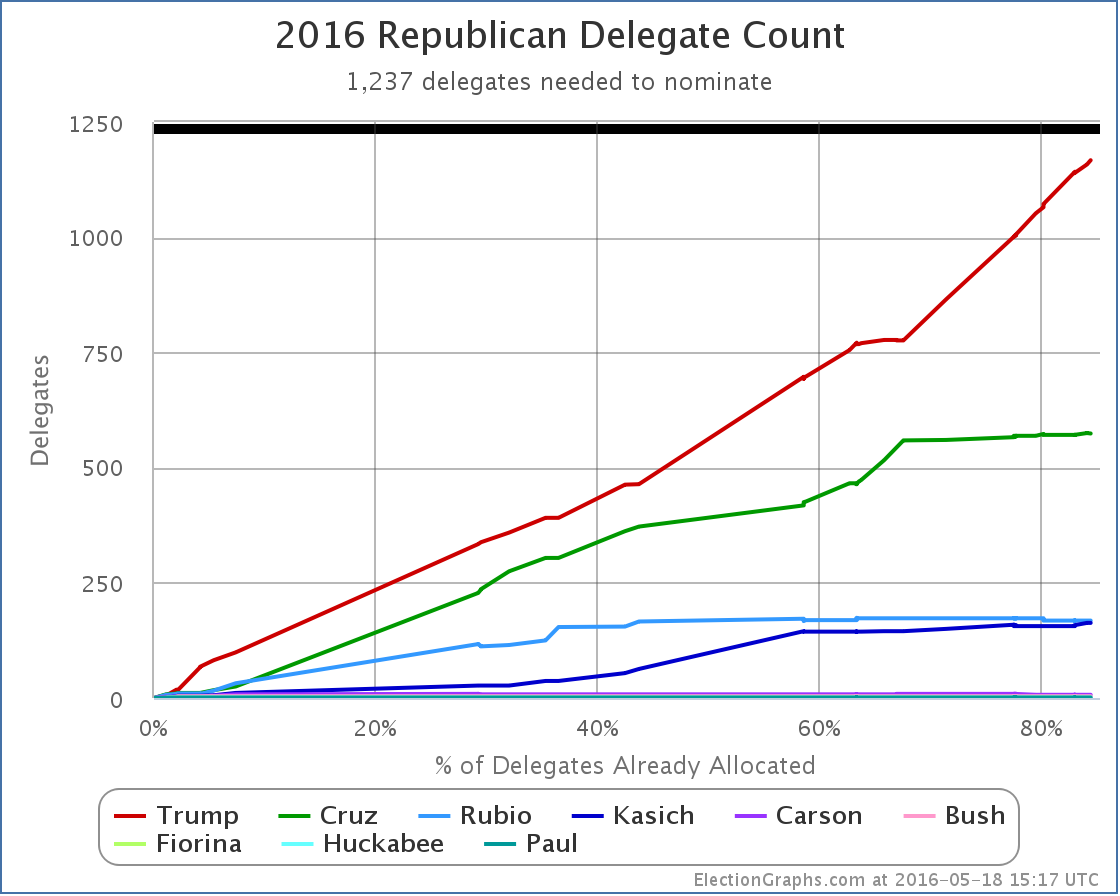
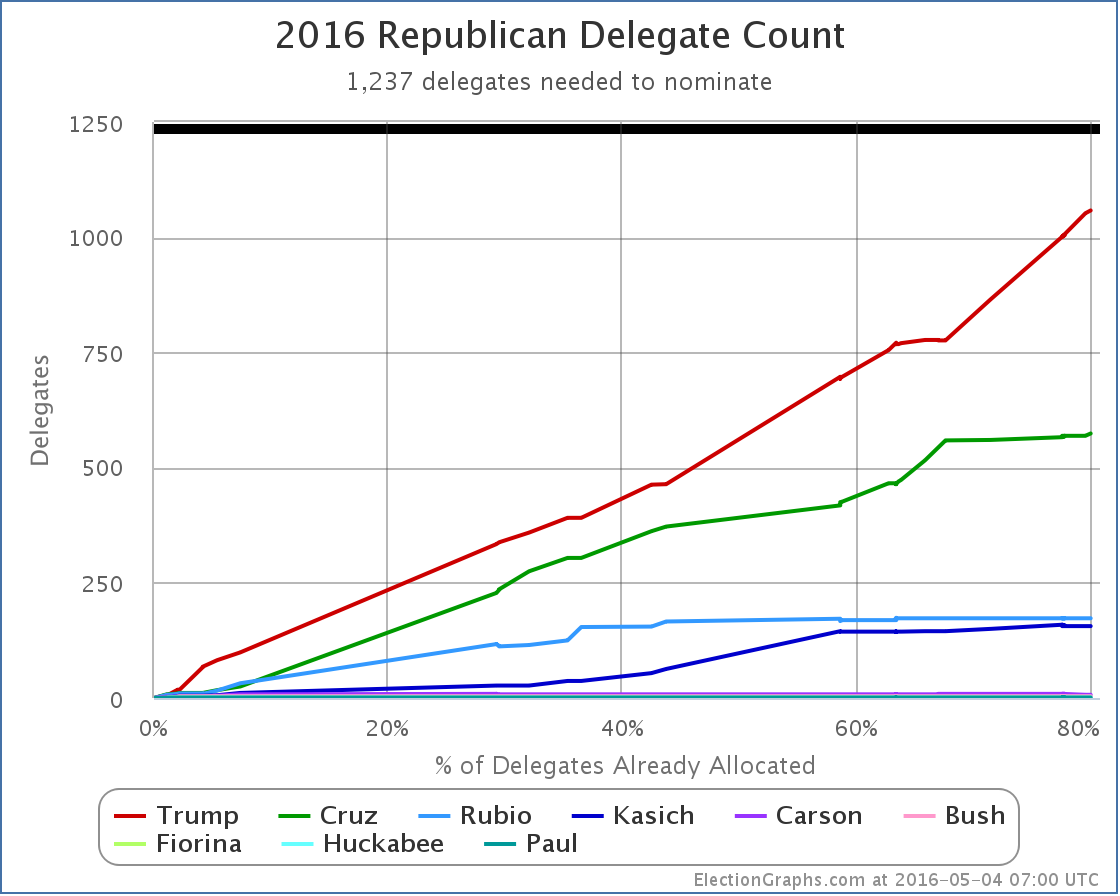
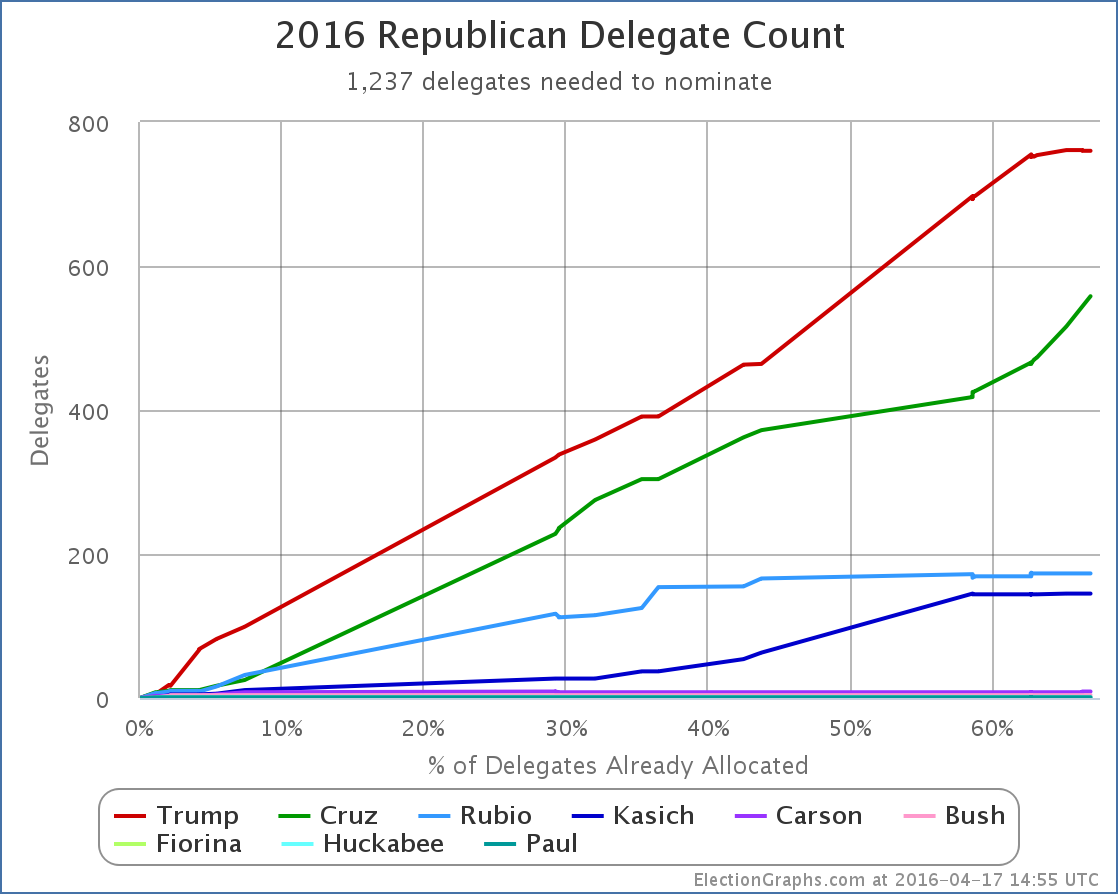
Lets look quickly at the updated graphs:
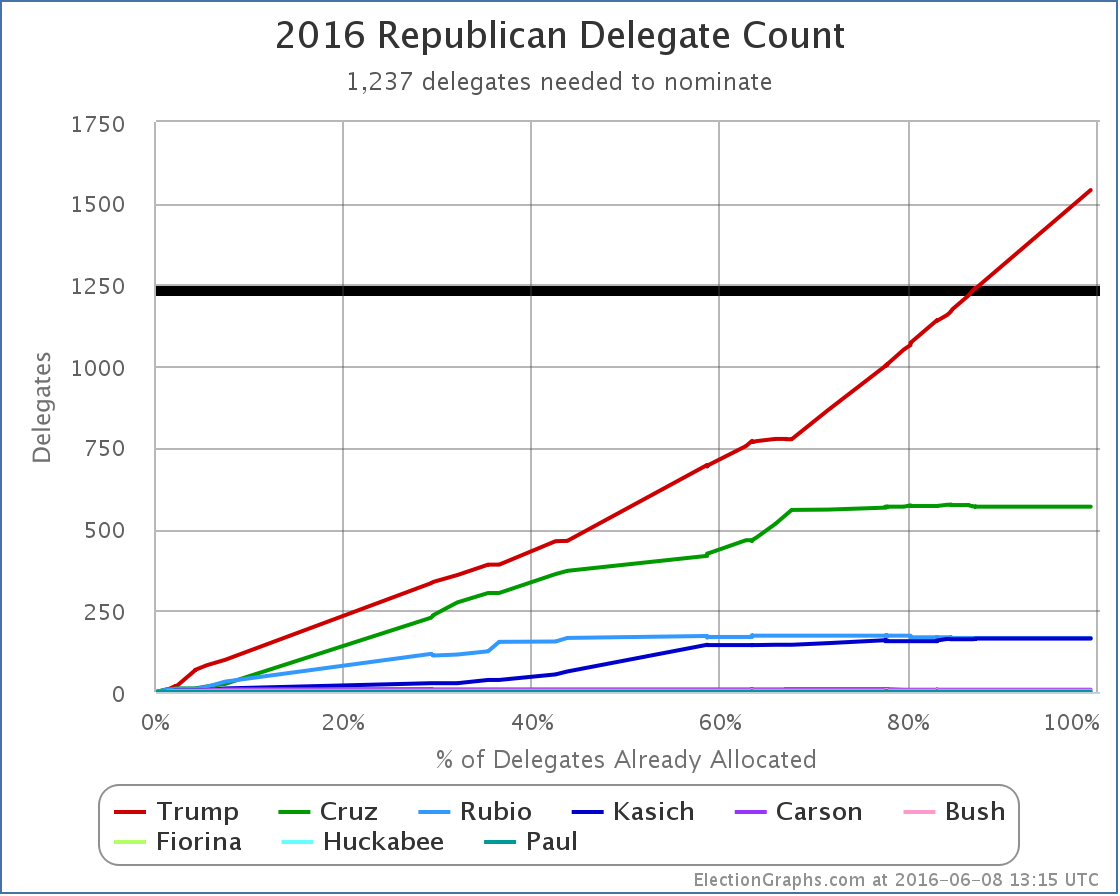
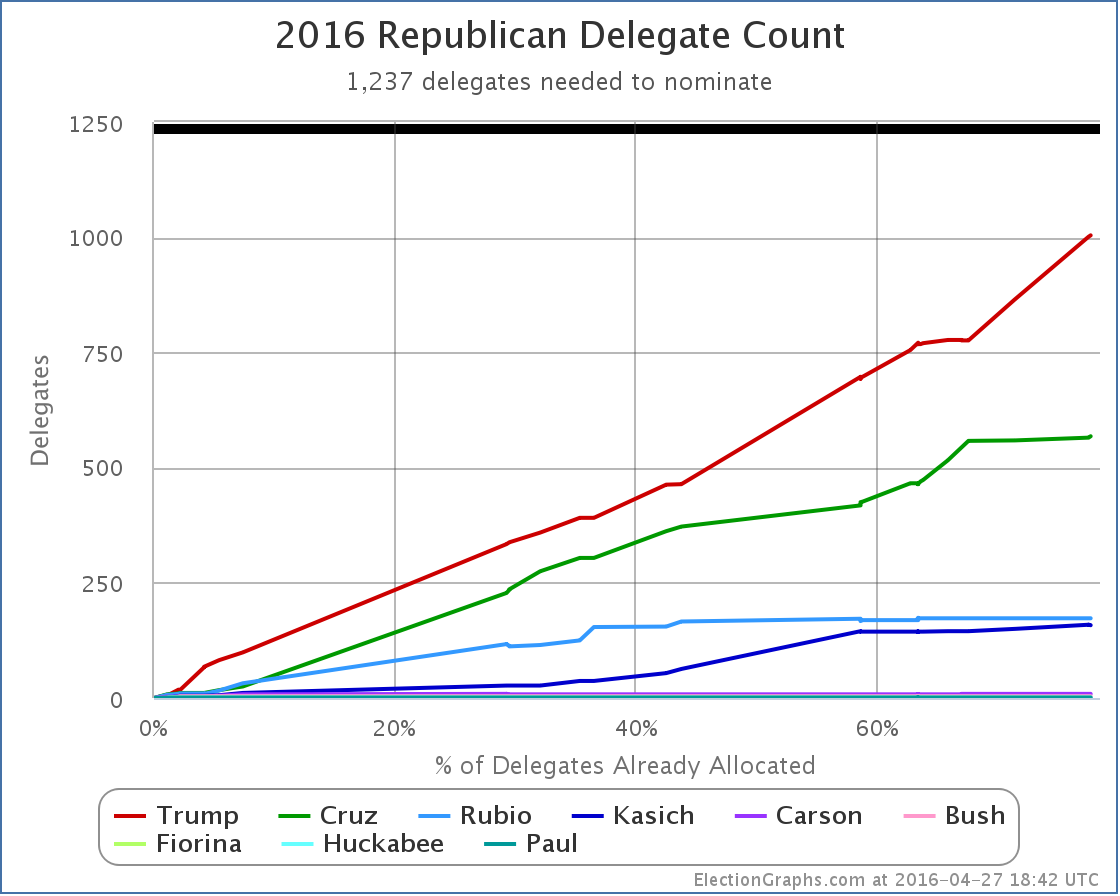
With this update Trump moves from just barely over the “magic number” to well over it with plenty of room to spare. The delegate count is now: Trump 1541, Cruz 569, Rubio 166, Kasich 164, Carson 7, Bush 4, Fiorina 1, Huckabee 1, Paul 1.
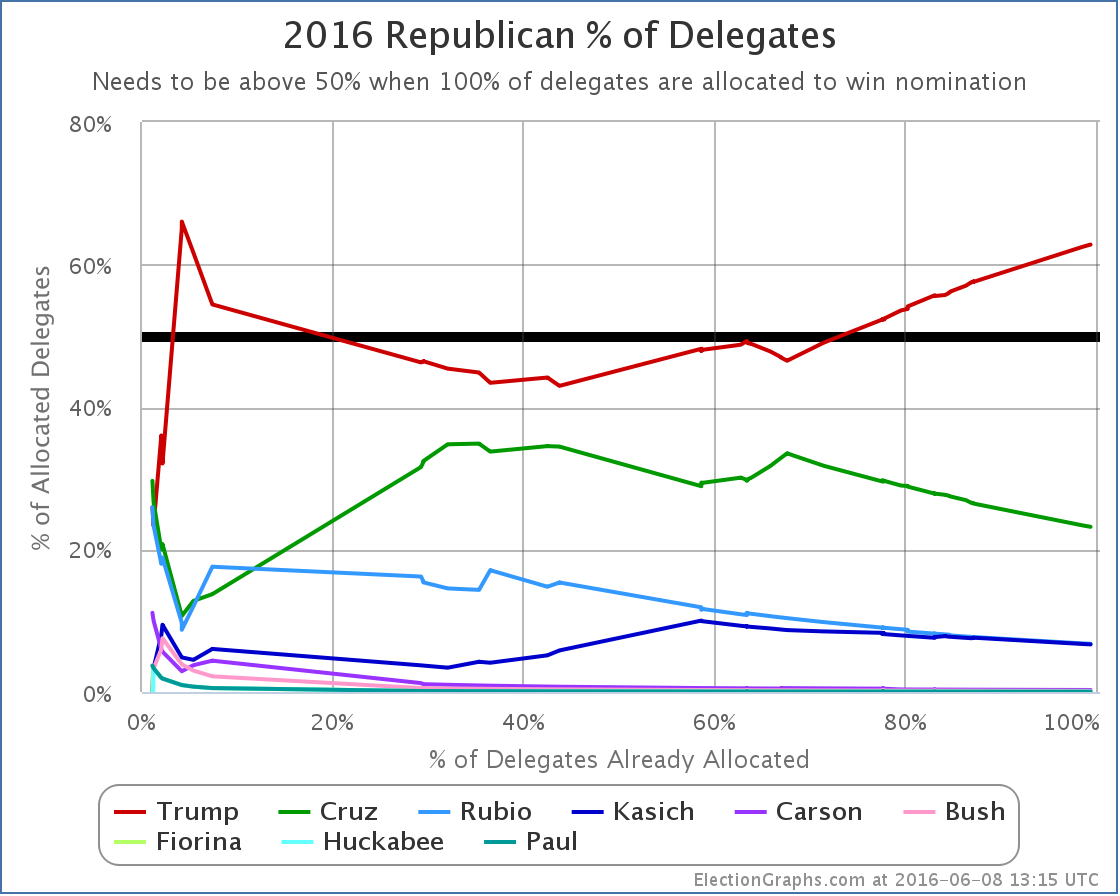
Trump now has 62.80% of the delegates allocated so far.
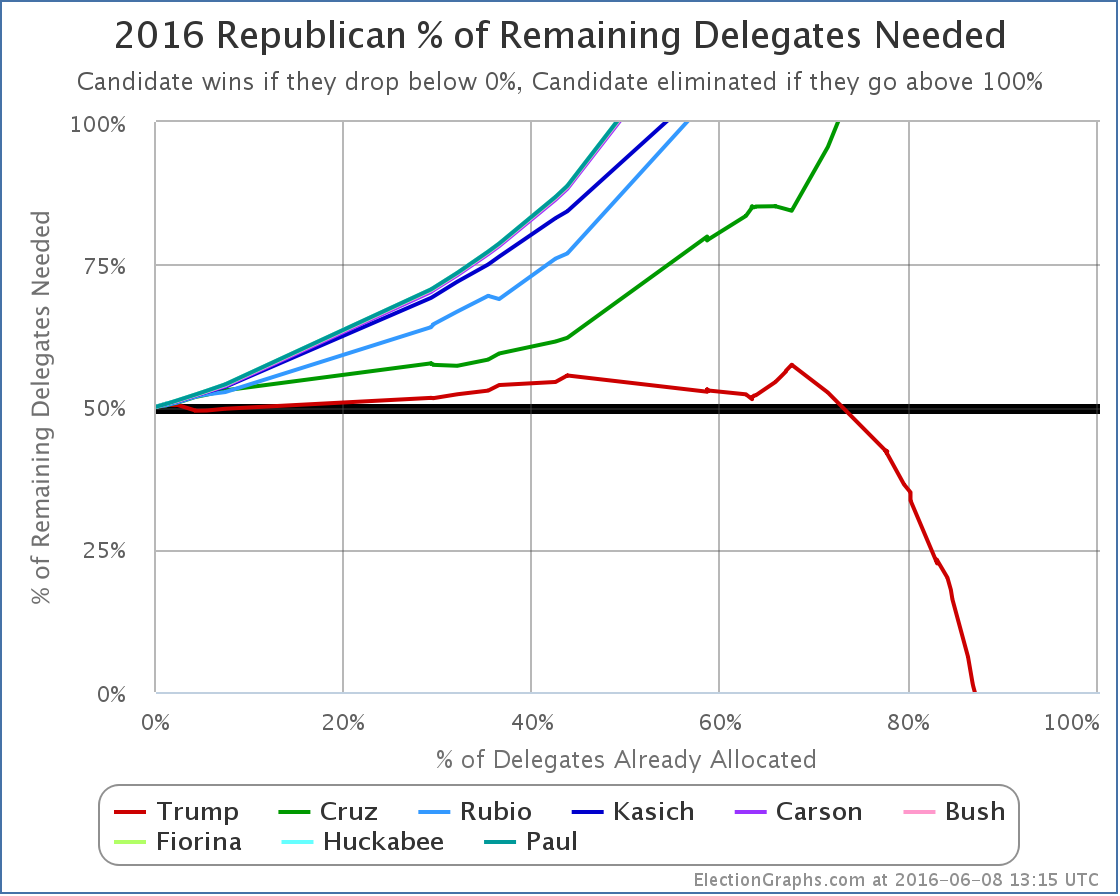
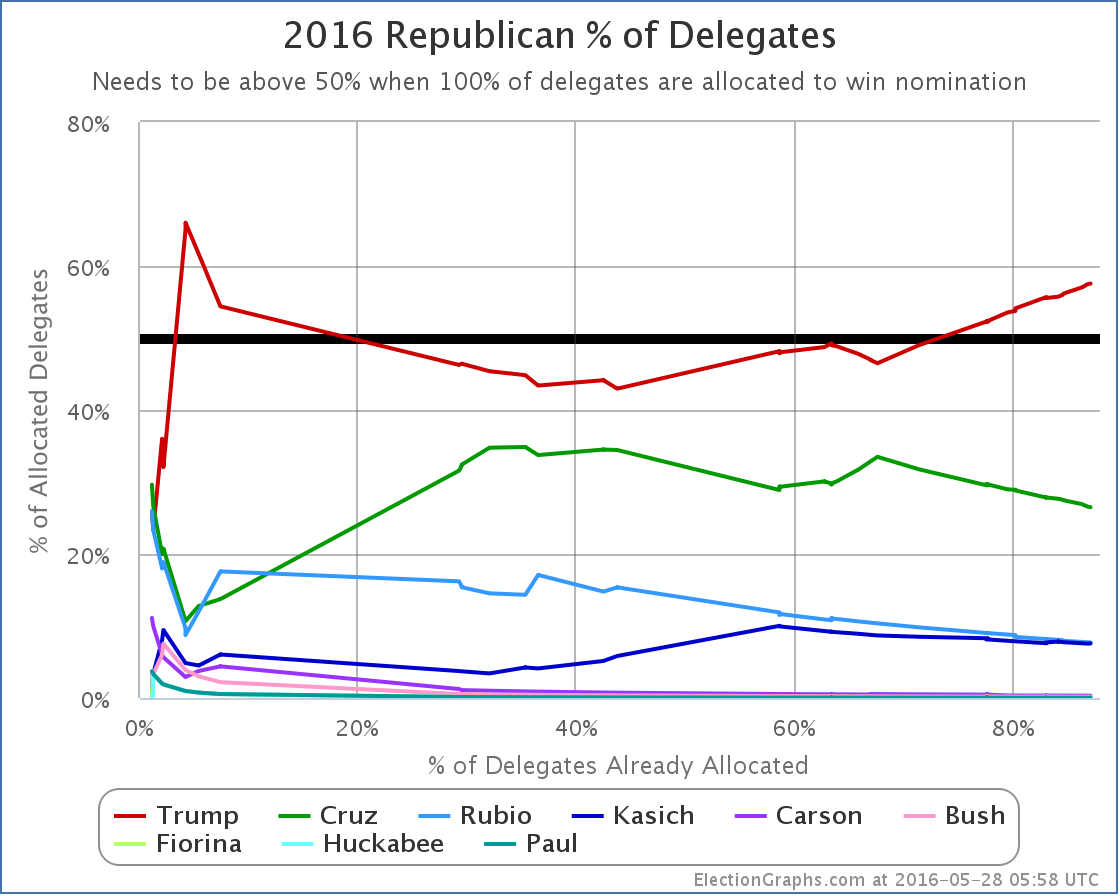
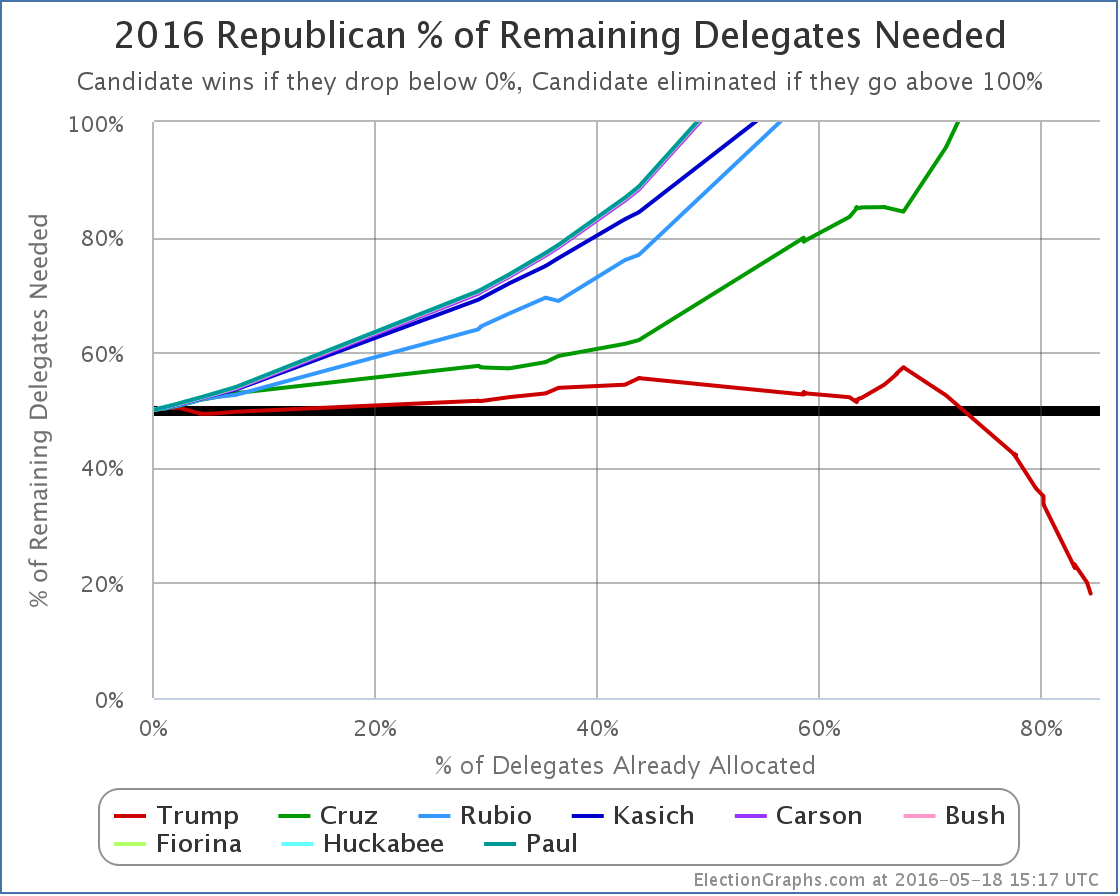
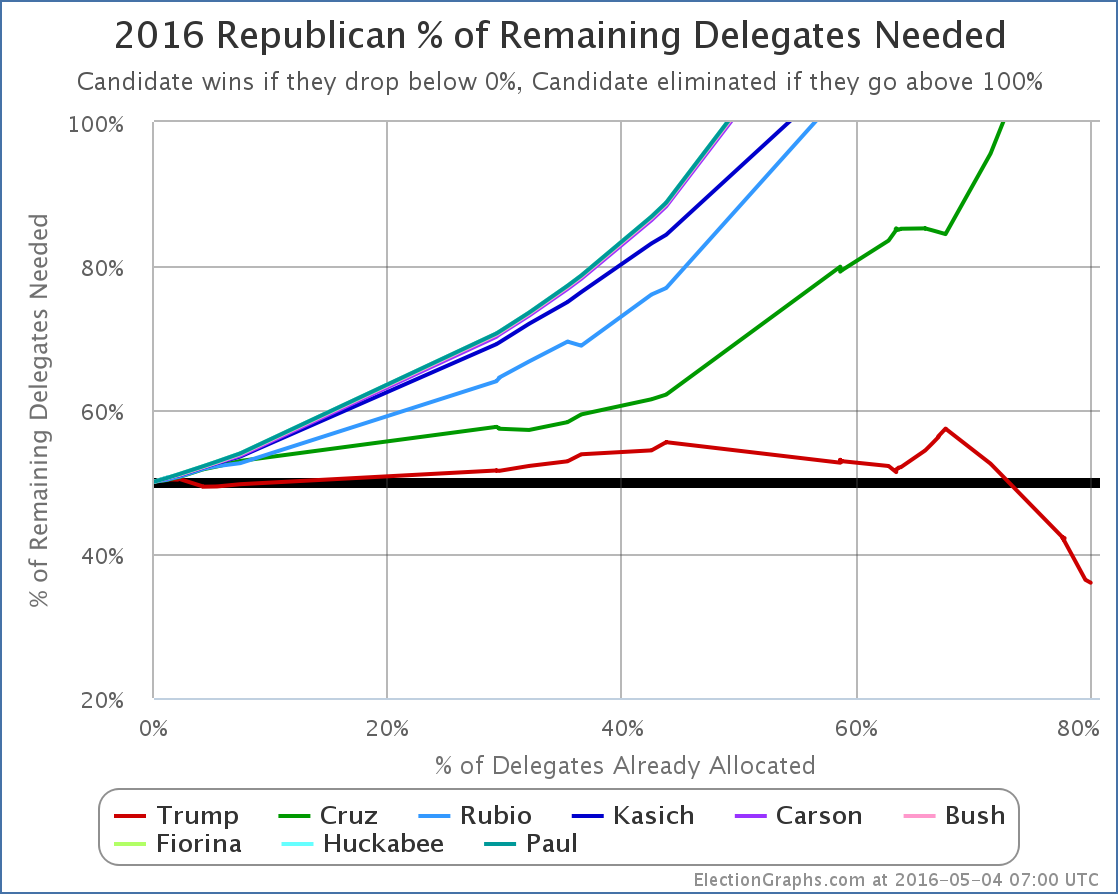
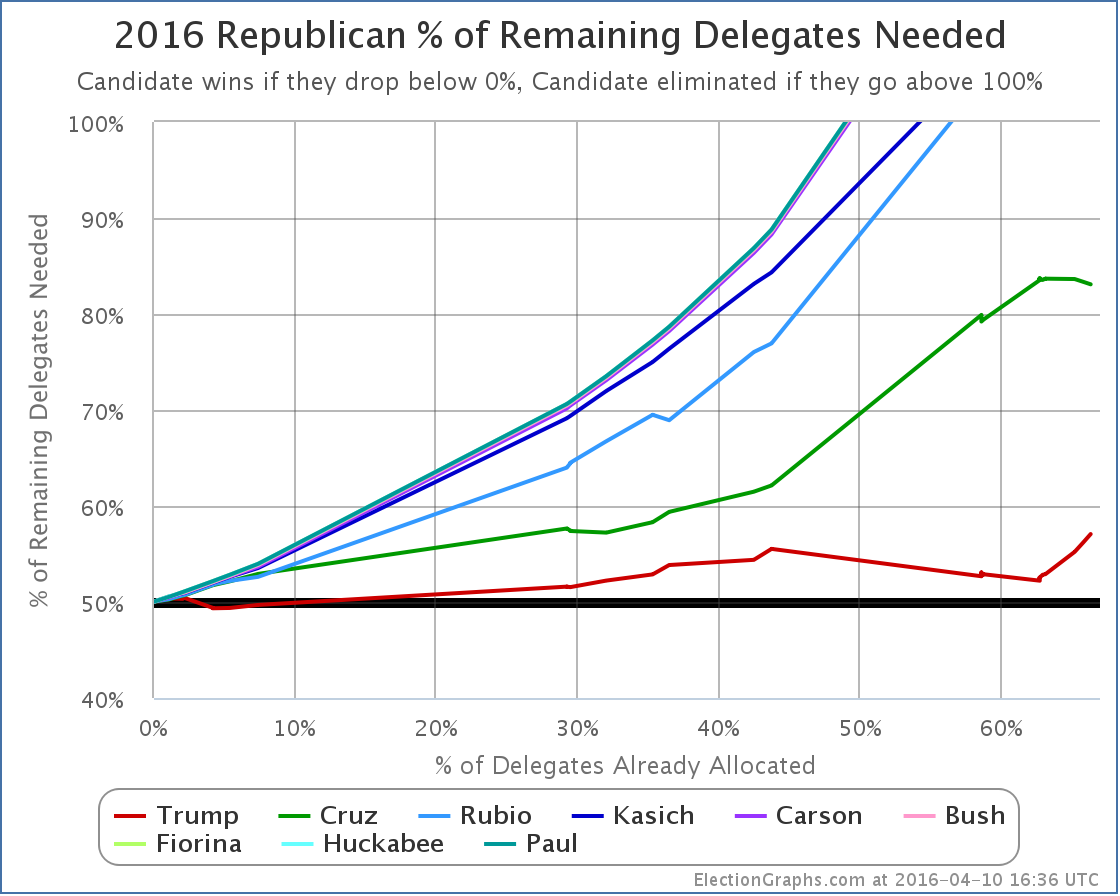
And just for reference, the “% needed to win” in final form.
There isn’t much more to say since this race is over minus any unexpected craziness. If there are any additional developments of note, we’ll update accordingly, but none is expected at the moment.
Time to concentrate on the general election.
Update 2016-06-30 06:00 UTC – Update from Vermont. Net change Kasich -1, Paul +1. (A Kasich delegate who considered themselves free after Kasich dropped out pledged his support to Paul.)
Update 2016-07-20 07:19 UTC: Final Election Graphs estimate was Trump 1541, Cruz 569, Rubio 166, Kasich 163, Carson 7, Bush 4, Paul 2, Fiorina 1, Huckabee 1, TBD 18. We now have the official roll call from the Republican National Convention: Trump 1725, Cruz 484, Kasich 125, Rubio 123, Carson 7, Bush 3, Paul 2, DNV 3. Differences were due to the application of rules in some states requiring all votes to go to candidates that were actually nominated (only Trump was officially nominated at the convention) and movement of additional uncommitted delegates to Trump.
Note: This post is an update based on the data on ElectionGraphs.com. Election Graphs tracks both a poll based estimate of the Electoral College and a numbers based look at the Delegate Races. All of the charts and graphs seen in this post are from that site. Additional graphs, charts and raw data can be found there. Follow @ElectionGraphs on Twitter or like Election Graphs on Facebook to see announcements of updates or to join the conversation. For those interested in individual general election poll updates, follow @ElecCollPolls on Twitter for all the polls as they are added. If you find the information in these posts interesting or useful, please consider visiting the tip jar.
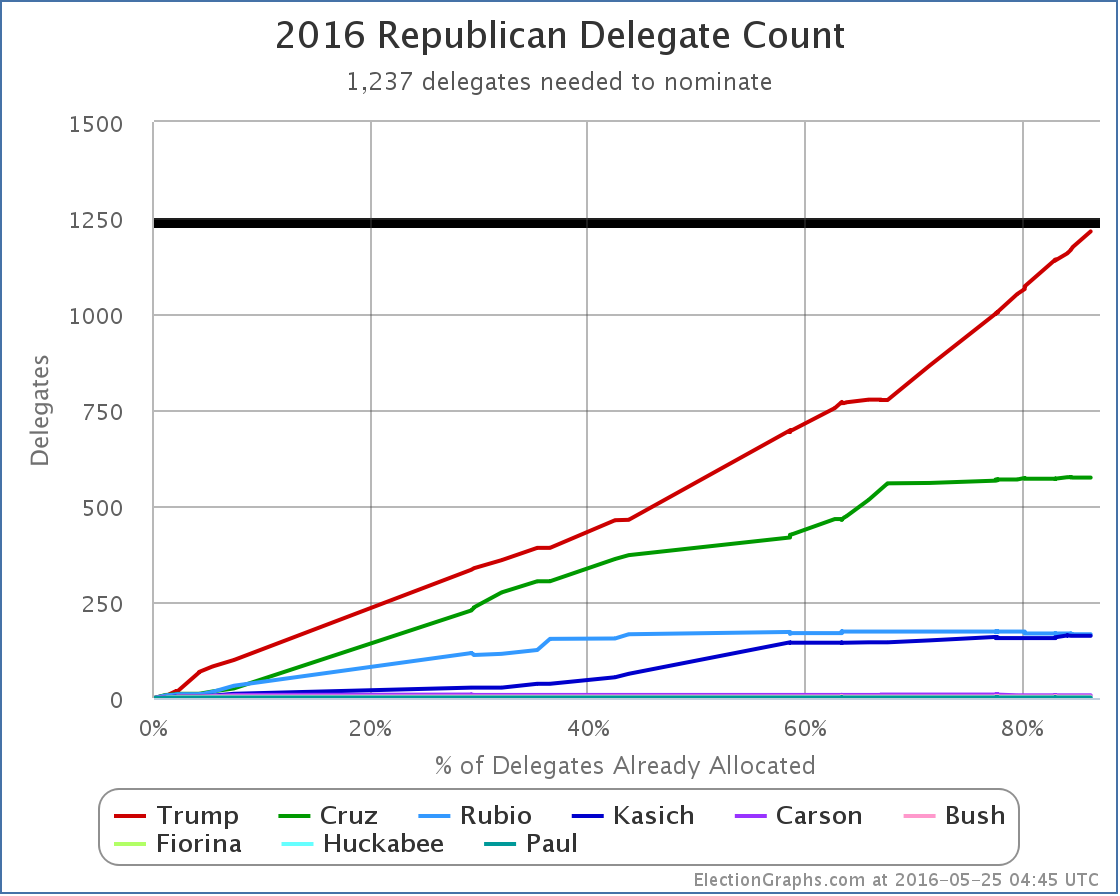
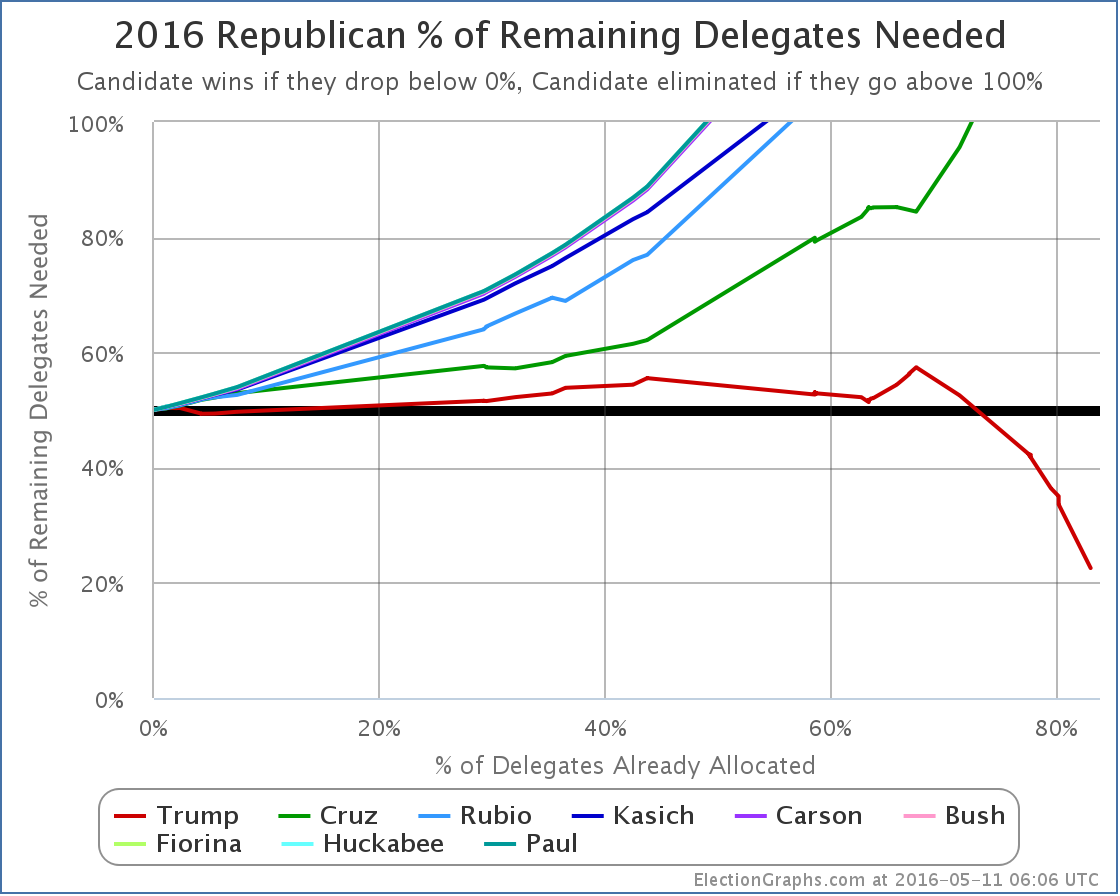
The Election Graphs delegate estimate now has Trump at 1238, one more than he needed to clinch the nomination.
AP announced that Trump had exceeded 1237 by their count on Thursday. They had canvassed the remaining uncommitted delegates who had not expressed a public preference, and found enough of them to put Trump over the top. When AP does this sort of thing, they don’t generally release their full list of delegates though, so it was hard to confirm this independently. But Election Graphs was able to spend a few hours Friday night digging through various sources to look for more specific information on specific uncommitted delegates, and we were also able to get Trump over the top.*
He will of course get even more delegates on June 7th, but he doesn’t need them. Absent a catastrophic unexpected event, Trump will be the Republican nominee for President in 2016.
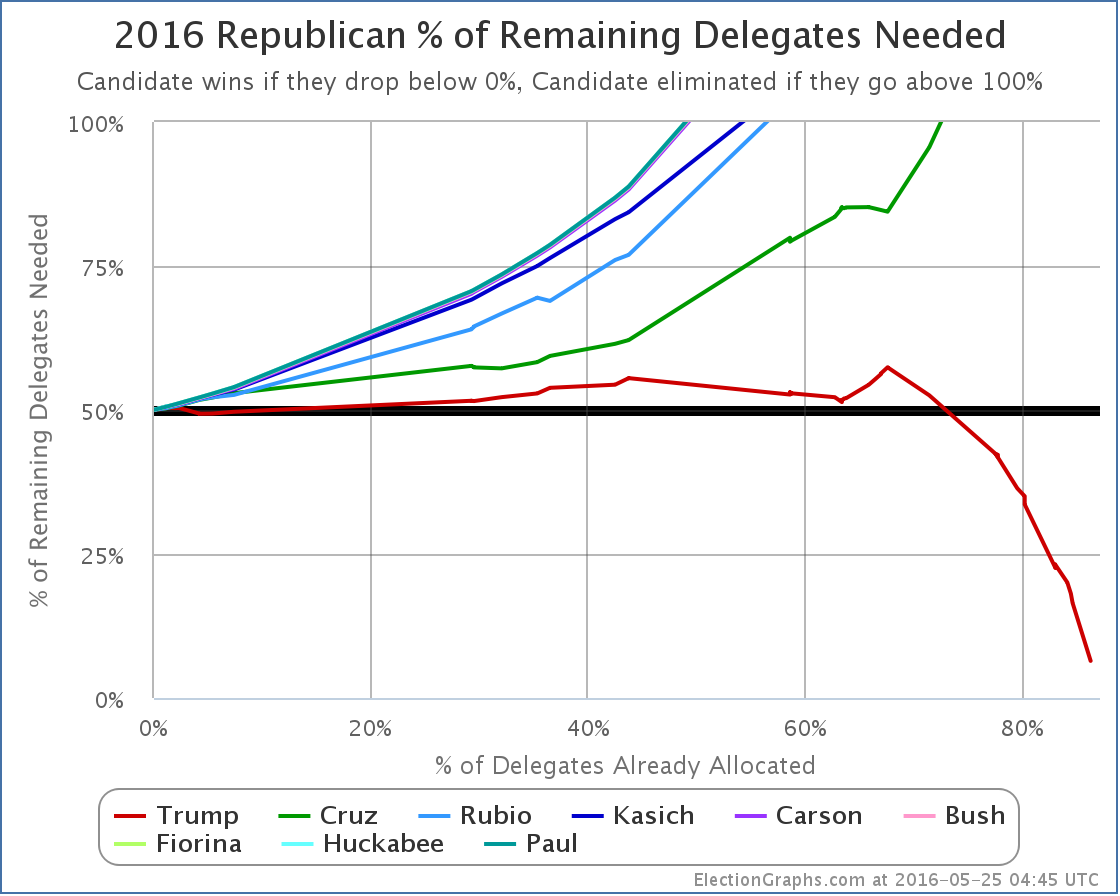
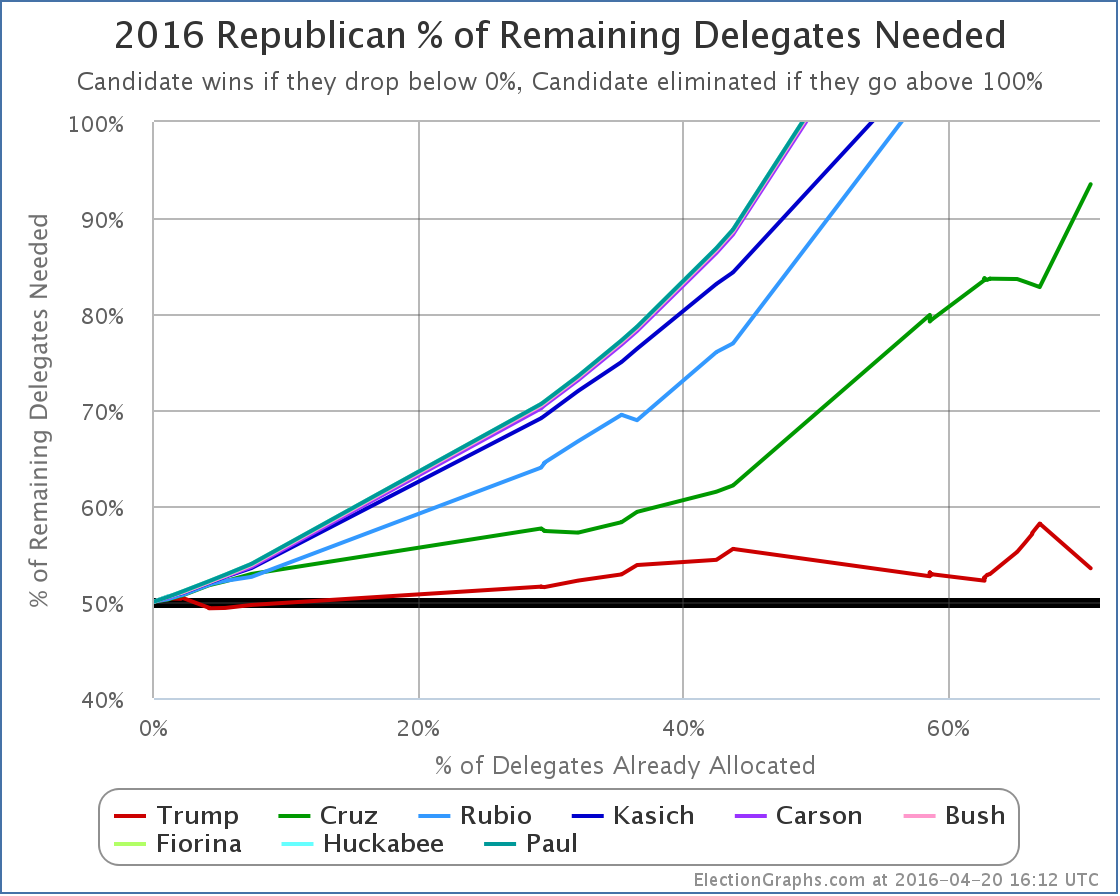
The final “% of remaining delegates needed to win” chart looks like this:
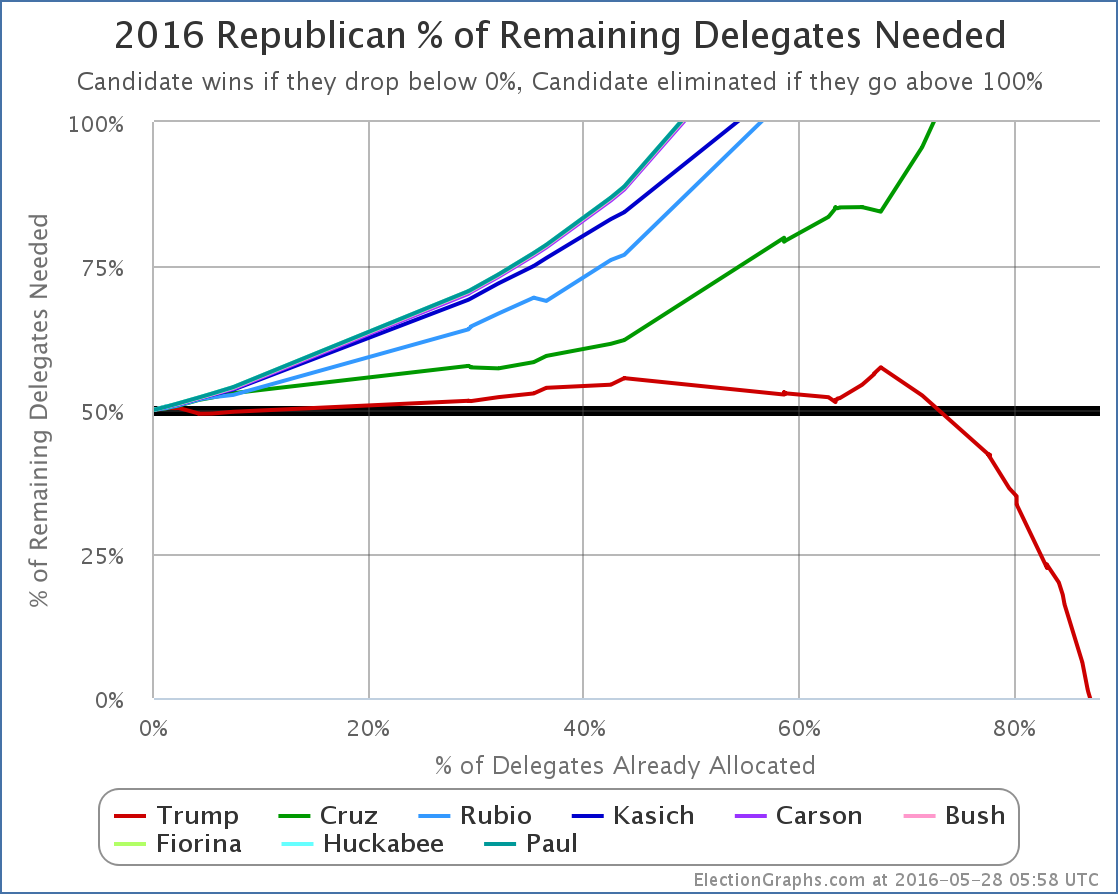
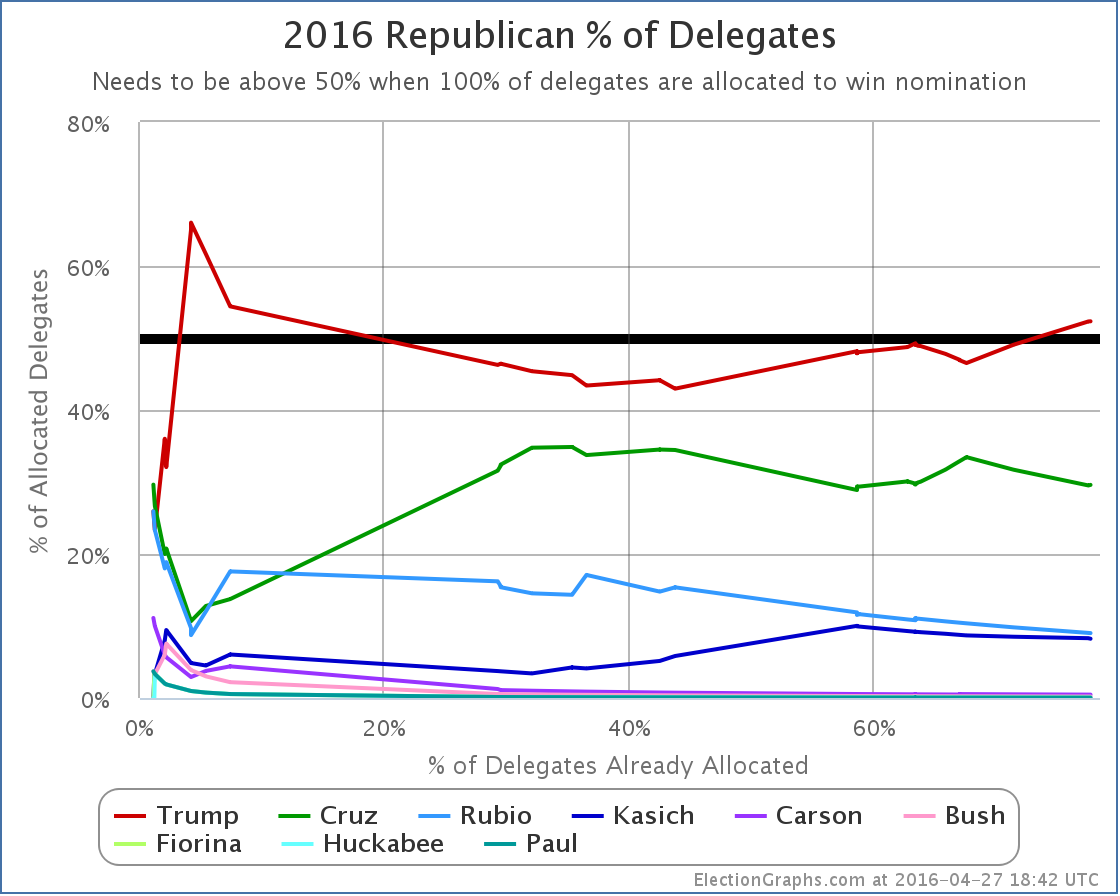
Trump hovered just over 50% for most of the race, but essentially as soon as Cruz was mathematically eliminated, Trump dropped below 50% needed, and rapidly raced to the conclusion. This was of course aided by Cruz and Kasich dropping out, but even if they hadn’t, the writing was on the wall. It would have taken a huge effort with a groundswell of popular support for his opponents to prevent Trump from getting to 1237 at that point, and it was obvious that neither the political will, or the voters for Cruz or Kasich were there. And so it ended.
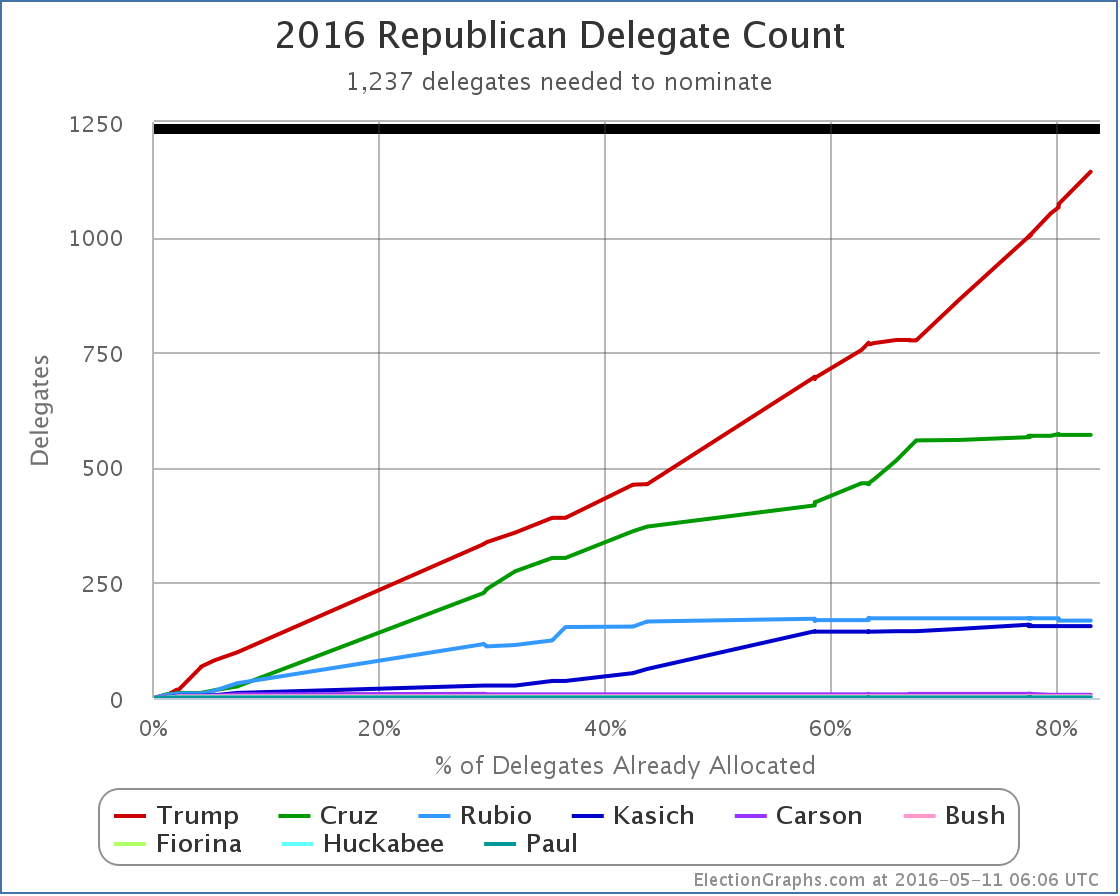
At this point the delegate count is Trump 1238, Cruz 570, Rubio 166, Kasich 163, Carson 7, Bush 4, Fiorina 1, Huckabee 1, Paul 1.
Trump will of course collect more before things are done. There is a chance others may pick up a handful too, but if they do it will be insignificant, and it is quite possible Trump will sweep the remaining delegates.
At this point Trump has 57.55% of the delegates. Cruz was next at 26.50%. Trump’s percentage will increase before we are done with all the delegate allocation.
Election Graphs will continue to monitor the delegate totals from the last few races for completeness, but for all intents and purposes the Republican race is now done. This has been the craziest oddball primary race in many decades. It has been fascinating to watch it play out.
Trump led from New Hampshire onward. From that point forward nobody ever came close. Until we got to the Northeast states though, the others were getting a high enough percentage to keep the possibility of blocking him alive, with the odds of Trump not getting to 1237 as high as 36% as late as April 18th according to the best simulations. (My gut feel had it higher, at 60%, but the numeric simulations were a better guide.) Now, that still meant Trump was probably going to get to 1237, but there was a decent shot at stopping it.
But then the anti-Trump forces essentially collapsed and gave up. It is just too hard to make the case that people should vote for you in order to help stop someone else, even after it is very clear you can’t win yourself. In my Curmudgeon’s Corner 2016 predictions show I essentially predicted exactly that. But in the heated days of March and April, I allowed myself to get a little too excited about the news nerd’s dream of a contested convention, as did a lot of people looking at the race. In the end though, it is really hard to stop someone who has led from beginning to end.
And so we have Trump.
It has been a lot of fun watching this primary process play out. The Democratic side should be winding up very shortly as well.
And then it is full speed ahead to the general election. If you have enjoyed my coverage of the Republican delegate race, I hope you’ll stay around for the Electoral College analysis.
164.7 days until polls start to close on the general election. The next few months will be quite a ride. Stay tuned!
* For those who want the specifics, in the last few days there were updates to the preferences from uncommitted delegates in North Dakota, Oklahoma, Colorado, Pennsylvania, the Virgin Islands, and Louisiana. Added up, the net change was Trump +23, Kasich +1, Cruz -3.
Update 2016-05-30 16:44 UTC – Change from Colorado: Trump +1, Cruz -1.
Update 2016-06-03 14:40 UTC – Change from Oregon: Trump -1, Kasich +1.
Note: This post is an update based on the data on ElectionGraphs.com. Election Graphs tracks both a poll based estimate of the Electoral College and a numbers based look at the Delegate Races. All of the charts and graphs seen in this post are from that site. Additional graphs, charts and raw data can be found there. All charts above are clickable to go to the current version of the detail page the chart is from, which may contain more up to date information than the snapshots on this page, which were current as of the time of this post. Follow @ElectionGraphs on Twitter or like Election Graphs on Facebook to see announcements of updates or to join the conversation. For those interested in individual general election poll updates, follow @ElecCollPolls on Twitter for all the polls as they are added.
Edit 14:00 UTC to add the * with the delegate changes from the last few days.
Edit 2016-06-04 04:04 UTC to fix the title from Electoral College to Republicans. Sigh.
With the final results all but inevitable, these updates will be somewhat mechanical absent something unexpected happening.
After Oregon, Trump needed 18.13% of the remaining delegates to win.
In Washington, Trump got 41 of 44 delegates. Nobody else got those last three, they will be officially uncommitted. No word yet on who those three delegates actually are and who they will support.
Also since the initial post on Oregon, updates there moved one delegate from Kasich to Cruz, plus an update in the Virgin Islands moved all but one uncommitted delegate there to Trump. Between these two places, the net change was Trump +7, Kasich -1, Rubio -2.
So total change since Oregon: Trump +48, Kasich -1, Rubio -2.
So Trump got over 100% of the new delegates since Oregon, since he got all of the actual new delegates, plus stole some from the others.
Updated graphs:
New delegate totals: Trump 1215, Cruz 574, Rubio 166, Kasich 162, Carson 7, Bush 4, Fiorina 1, Huckabee 1, Paul 1.
There are 341 delegates left. Trump only needs 22 of them.
As a note, there are currently 32 uncommitted delegates who have not yet expressed a preference by my count. There doesn’t seem to be an effort going on to push these folks to do so, but we’re now at the point where these uncommitted delegates could push Trump over the edge at any time if a bunch of them were to come out and say they were supporting him.
Trump now needs 6.45% of the remaining delegates to win.
That could be done with the uncommitted delegates sooner, but it is most probable this will come shortly after New Jersey closes their polls on June 7th. It is unlikely we will need to wait for the four Western states whose polls close later that evening.
Update 2016-05-26 14:51 UTC – AP says they have found enough uncommitted delegates to put Trump over 1237. I’ll update totals here as I get information on specific uncommitted delegates and state counts. Depending on how forthcoming AP is with the list of actual delegates that told them they support Trump, I may or may not be able to confirm 22 more uncommitted delegates before June 7th when the pledged delegates should push Trump over the edge anyway.
Update 2016-05-28 05:29 UTC – Uncommitted delegate update: Trump +20, Kasich +1, Cruz -3. I’ve done my best using all my usual sources to match AP’s conclusion. So far I have only been able to get up to Trump 1235… two delegates short… AP called various of these uncommitted delegates to get their count, but only released the totals and a few of the names, not all of the names, so it is impossible to confirm their total delegate by delegate. I’ll keep looking for more info on the remaining 18 uncommitted delegates on my list. If I find the remaining two before the next votes on June 7th, I’ll of course update.
Update 2016-05-28 05:54 UTC – I kept searching, and eventually found 3 more Trump delegates. That puts Trump at 1238 and therefore over the top. New blog post from me soon.
Note: This post is an update based on the data on ElectionGraphs.com. Election Graphs tracks both a poll based estimate of the Electoral College and a numbers based look at the Delegate Races. All of the charts and graphs seen in this post are from that site. Additional graphs, charts and raw data can be found there. All charts above are clickable to go to the current version of the detail page the chart is from, which may contain more up to date information than the snapshots on this page, which were current as of the time of this post. Follow @ElectionGraphs on Twitter or like Election Graphs on Facebook to see announcements of updates or to join the conversation. For those interested in individual general election poll updates, follow @ElecCollPolls on Twitter for all the polls as they are added.
Edit 15:21 to not imply the Virgin Islands are a state.
Edit 2016-05-28 13:57: Corrected the Trump delegate update not he first 2016-05-28 update to be Trump +20. The 1235 at that point was correct. I’d missed counting two Louisiana delegates in the delta.
With the final results all but inevitable, these updates will be somewhat mechanical absent something unexpected happening.
After Nebraska and West Virginia, Trump needed 22.57% of the remaining delegates to win.
In Oregon, Trump got 19 delegates, while Kasich picked up 5 and Cruz picked up 4, even though neither of them are actively running any more.
In other changes since Nebraska and West Virginia due to uncommitted delegate preference changes in Guam, finalization of the West Virginia results taking into account geographic restrictions, and an update from New York, there was a net change of Trump +6, Kasich +2, Cruz -1
So total change since Nebraska and West Virginia: Trump +25, Kasich +7, Cruz +3
So Trump actually got 71.43% of the delegates since Nebraska and West Virginia.
So while he didn’t completely sweep the delegates this week, he is still far ahead of the target pace he needs to get to 1237.
Updated graphs:
New delegate totals: Trump 1167, Cruz 574, Rubio 168, Kasich 163, Carson 7, Bush 4, Fiorina 1, Huckabee 1, Paul 1.
There are 386 delegates left. Trump needs 70 of them.
Trump now needs 18.13% of the remaining delegates to win.
Update 2016-05-22 16:12 UTC – Oregon update: Cruz +1, Kasich -1.
Update 2016-05-25 14:30 UTC – Virgin Islands update: Trump +7, Cruz -1, Rubio -2.
Note: This post is an update based on the data on ElectionGraphs.com. Election Graphs tracks both a poll based estimate of the Electoral College and a numbers based look at the Delegate Races. All of the charts and graphs seen in this post are from that site. Additional graphs, charts and raw data can be found there. All charts above are clickable to go to the current version of the detail page the chart is from, which may contain more up to date information than the snapshots on this page, which were current as of the time of this post. Follow @ElectionGraphs on Twitter or like Election Graphs on Facebook to see announcements of updates or to join the conversation. For those interested in individual general election poll updates, follow @ElecCollPolls on Twitter for all the polls as they are added.
With the final results all but inevitable, these updates will be somewhat mechanical absent something unexpected happening.
After Indiana, Trump needed 36.02% of the remaining delegates to win.
In Nebraska and West Virginia, Trump seems to have gotten all 70 of the available delegates. (There may end up being some oddness due to West Virginia geographic restrictions on delegate allocation that shifts this slightly.)
In other changes since Indiana due to uncommitted delegate preference changes in American Samoa and Louisiana as well as Louisiana’s Rubio delegates moving to Trump, there were net changes of: Trump +14, Cruz -3, Rubio -5.
So total change since Indiana: Trump +84, Cruz -3, Rubio -5
So Trump actually got 111% of the delegates since Indiana. (Over 100% is possible since he actually took delegates from his opponents as well as collecting “new” delegates.)
So Trump obviously well exceeded the required numbers to be on pace for a win.
Updated graphs:
New delegate totals: Trump 1142, Cruz 571, Rubio 168, Kasich 156, Carson 7, Bush 4, Fiorina 1, Huckabee 1, Paul 1.
There are 421 delegates left. Trump needs 95 of them.
Trump now needs 22.57% of the remaining delegates to win.
Update 2016-05-14 14:31 UTC: Once the geographic restrictions on delegates was finalized and factored in, the final results in West Virginia were officially Trump 30, Kasich 1, Uncommitted 3. Two of the three uncommitted delegates have stated they are for Trump though, so we count this as Trump 32, Kasich 1, TBD 1. Net change from before: Trump -2, Kasich +1.
Update 2016-05-17 17:03 UTC: Update from New York. Net change: Trump -1, Kasich +1.
Update 2016-05-18 17:26 UTC: Update from Guam uncommitted delegates. Net Change Trump +9, Cruz -1.
Note: This post is an update based on the data on ElectionGraphs.com. Election Graphs tracks both a poll based estimate of the Electoral College and a numbers based look at the Delegate Races. All of the charts and graphs seen in this post are from that site. Additional graphs, charts and raw data can be found there. All charts above are clickable to go to the current version of the detail page the chart is from, which may contain more up to date information than the snapshots on this page, which were current as of the time of this post. Follow @ElectionGraphs on Twitter or like Election Graphs on Facebook to see announcements of updates or to join the conversation. For those interested in individual general election poll updates, follow @ElecCollPolls on Twitter for all the polls as they are added.
Trump won all 57 delegates in Indiana.
This was the last stand of the anti-Trumps. Cruz announced he was dropping out shortly after the state was called for Trump. Kasich is still in it, but hasn’t shown any delegate gathering ability that would indicate he could make a difference.
Even with a loss in Indiana, Trump would almost certainly have won in the end. That has been clear for a couple weeks now. But he didn’t lose Indiana, he shut everyone else out completely.
Trump hasn’t wrapped things up quite yet, he still has to collect a few more delegates. But something unexpected and dramatic would have to happen to stop him from getting there.
The Republican race is now in the same state as the Democratic race has been for awhile. The outcome is known, and we’re just watching the winner mop up the last few delegates they need.
So time to look at the graphs:
My best estimates of the delegate totals (including preferences of officially uncommitted delegates) is now:
Trump 1058, Cruz 574, Rubio 173, Kasich 156, Carson 7, Bush 4, Fiorina 1, Huckabee 1, Paul 1.
(In addition to the 57 delegates from Indiana for Trump, this includes adjustments since last week that total: Cruz +6, Kasich -2, Carson -2, Trump -3.)
This means Trump now needs 179 of the remaining 497 delegates to wrap this up.
Which brings us to the % needed chart:
Trump now needs 36.02% of the remaining delegates to get to the magic number of 1237.
The remaining contests are essentially now just Trump vs Kasich. Unless you believe Kasich is suddenly going to start winning delegates in every remaining state by 64% to 36% margins despite getting less than 8% of the delegates so far, Trump will do what he needs to do. He will probably do much better than he needs to do.
So he will win, and he will win outright. No contested convention, just an outright win.
If there had been enough “Shadow anti-Trump” delegates… those that were pledged to Trump, but really supported someone else, then there may have been the ability to change the rules to unbind the delegates, opening up a back door for someone else to win even if Trump had the nominal majority. The fact that Cruz dropped out after Indiana indicates that those numbers just were not there…
And so we’re essentially done.
ElectionGraphs.com will continue to document this process, but now it is just a matter of watching Trump gather up the remaining delegates needed. There is no question any more how this will play out.
Unless a metaphorical meteor (or a literal one I guess) hits Clinton or Trump, we have our nominees. The general election is lined up. We are going to be watching Clinton vs Trump.
Update 2016-05-11 06:32 UTC – Adjustments from American Samoa’s uncommitted delegates, and Louisiana’s uncommitted delegates as well as Louisiana’s now free Rubio delegates. Net result: Trump +14, Cruz -3, Rubio -5.
Note: This post is an update based on the data on ElectionGraphs.com. Election Graphs tracks both a poll based estimate of the Electoral College and a numbers based look at the Delegate Races. All of the charts and graphs seen in this post are from that site. Additional graphs, charts and raw data can be found there. All charts above are clickable to go to the current version of the detail page the chart is from, which may contain more up to date information than the snapshots on this page, which were current as of the time of this post. Follow @ElectionGraphs on Twitter or like Election Graphs on Facebook to see announcements of updates or to join the conversation. For those interested in individual general election poll updates, follow @ElecCollPolls on Twitter for all the polls as they are added.
Trump did very well yesterday in PA/MD/CT/RI/DE.
In pledged delegates the results were Trump 110, Kasich 5, Cruz 3.
That is a crushing win, but that is not why I say everything is falling into place. Trump did a little better than expected in pledged delegates, but a massive Trump win had been expected for awhile. This was not a surprise, and was already baked into people’s projections for the rest of the race.
Even with this built into the expectations, as of my post last week we were looking at odds between about 40% on the low side and 64% on the high side for Trump actually getting to 1237 delegates and having an outright majority before the convention. A week later, several things change that and make an outright Trump win look far more likely, and a multi-ballot convention much less likely. If it isn’t the pledged delegate results from last night, then what is it?
The first thing is the officially uncommitted delegates from Pennsylvania. In past contests Trump has done a horrible job getting his loyalists into the slots that are nominally uncommitted, or for that matter even into the slots that are bound to him on the first ballot. It was plausible to expect that Trump would do similarly poorly with Pennsylvania’s uncommitted delegates which are elected by name on the ballot… without any indication on the ballot of who they support.
But Trump appears to have gotten his act together, making sure delegate slates were available to Trump supporters and such. Between delegates that explicitly said they support Trump, and those who said they would vote the way their district went (and all of them went for Trump), Trump ends up with 45 of the 54 uncommitted delegates by my estimates. There is some ambiguity in the statements made by some of these uncommitted delegates and some other folks have estimated the number of Trump votes slightly lower. But all the estimates have Trump winning most of these delegates.
This was unexpected, and also gives more confidence of Trump’s delegate wrangling abilities going forward. (Although Pennsylvania was the biggest pot of uncommitted delegates.)
Add in the uncommitted delegates that have expressed a preference (45 Trump, 3 Cruz, 3 Kasich, 3 TBD) and 2 additional uncommitted Cruz delegates from North Dakota that I logged in the last week, and the net change since New York ends up as:
Trump +155, Cruz +8, Kasich +8.
The new raw totals look like this:
The finish line is in sight. Trump only needs 233 delegates to win this thing directly. No multi-ballot convention, just a straight up win on the first ballot.
For the first time since Super Tuesday at the beginning of March, Trump also actually has a majority of the delegates so far… 52.32% of the delegates.
But what does it take to keep that? Time for the “% of remaining delegates needed” graph:
First note that with yesterday’s results Cruz has been mathematically eliminated from the possibility of a first ballot victory. Trump is now the ONLY candidate that can win on a first ballot. Everybody else is done unless there is a brokered convention… or I suppose unless Trump drops out or something crazy like that.
Looking directly at Trump’s line… Trump needed 53.52% of the delegates to improve his position. Since New York he actually got 90.64% of the delegates. This obviously means his position improved a lot. He now only needs 42.06% of the remaining delegates to win.
That means he could do 20% worse at delegate gathering in all the remaining contests than he has so far and still win.
If the Republicans allocated delegates proportionately everywhere like the Democrats do, this would clearly be over. It would be Trump’s nomination, and we’d be done.
Because of how so many Republican states tilt the delegate results to the winner though, if the anti-Trump’s were strong, there would still be a path to block Trump.
The anti-Trump scenarios that gave us odds of a multi-ballot convention relied on three things.
The first we mentioned above… Trump’s failure to win delegates when they were selected individually instead of being bound to primary results. Trump dispensed with that in Pennsylvania.
The second was Indiana. Until the last week, Indiana had not been polled. The anti-Trump contested convention scenarios all relied on Trump losing Indiana. Well, last week Indiana was finally polled. Three times. The results? The RCP average has Trump +6.3%. Given Indiana’s delegate rules, a win like that would get Trump most of Indiana’s 57 delegates… possibly all of them. Oops. And Trump now only needs to be getting 42% of the delegates to be on pace to win.
The third was California. Trump has been ahead in the polls in California forever. But the anti-Trump folks were hoping to keep him from winning by too much and to hold down his delegate total. But in the last week of polling, Cruz has been falling and Trump has been rising, so Trump’s margins have just been growing. RCP now has a 17.4% Trump lead in their California average. Assuming Trump wins Indiana and some of the other remaining states, Trump will very likely only need 30% or less of the delegates in California in order to wrap things up. If he is winning by almost 20%, that is going to be very easy to achieve.
The simulator at The Upshot using default assumptions now shows an almost certain Trump win.
The FiveThirtyEight simulator “follow the experts” model shows Trump 27 votes short of the magic number… but they don’t include ANY of the officially uncommitted delegates that have said they support Trump. Add those in… there are just under 50 of them now depending how you count… and you are easily over 1237.
Finally, Sam Wang’s numerical simulations of the rest of the race have moved from a 64% chance of a Trump win a little over a week ago to a 94% chance today.
I see no reason to disagree with this estimate.
We are no longer on a knife’s edge between a contested convention and an outright Trump win.
#NeverTrump is now hanging on by a thread. They maybe aren’t quite as far gone as Sanders is on the Democratic side, but it is getting close. Their last hope is to try to start turning things around with a surprise win in Indiana. Even with that though, Trump’s odds look very good.
Between yesterday’s results, polls in Indiana, and polls in California, this now looks like an almost certain outright Trump win.
This is now Trump’s to lose. Given everything he has done so far that pundits thought would sink him but in fact only strengthened him, it is hard to see how exactly that would happen.
So… time to start paying more attention to Clinton vs Trump. Right now that looks like Clinton 338 to Trump 200, a 138 electoral vote win for Clinton. But things are still early, and that will change…
Update 2016-05-02 17:52 UTC: Uncommitted delegate update plus adjustment in Rhode Island. Net change: Trump +1, Cruz -2.
Update 2016-05-03 03:53 UTC: Uncommitted delegate update checking multiple sources. Net change: Cruz +2, Kasich -2, Trump -4. (See my wiki for my current best estimates of uncommitted delegate preferences.)
Update 2016-05-04 08:11 UTC: Updates (including uncommitted) in Nevada, Wyoming and North Dakota. Net change: Cruz +6, Carson -2.
Note: This post is an update based on the data on ElectionGraphs.com. Election Graphs tracks both a poll based estimate of the Electoral College and a numbers based look at the Delegate Races. All of the charts and graphs seen in this post are from that site. Additional graphs, charts and raw data can be found there. All charts above are clickable to go to the current version of the detail page the chart is from, which may contain more up to date information than the snapshots on this page, which were current as of the time of this post. Follow @ElectionGraphs on Twitter or like Election Graphs on Facebook to see announcements of updates or to join the conversation. For those interested in individual general election poll updates, follow @ElecCollPolls on Twitter for all the polls as they are added.
Trump won New York 90 to 5. Those 5 delegates went to Kasich.
If there was any surprise here, it was that Trump got a few more delegates than expected. I didn’t track it in detail, but my impression was that most people expected a result in the 80’s.
In addition, since Wyoming there was an update to the delegate count in Georgia that moved one delegate from Trump to Cruz. So the net change since Wyoming was Trump +89, Kasich+5, Cruz +1.
So Trump got 93.68% of the delegates since Wyoming. He only needed 58.17% of the delegates. He easily cruised past this bar. So where does this put things?
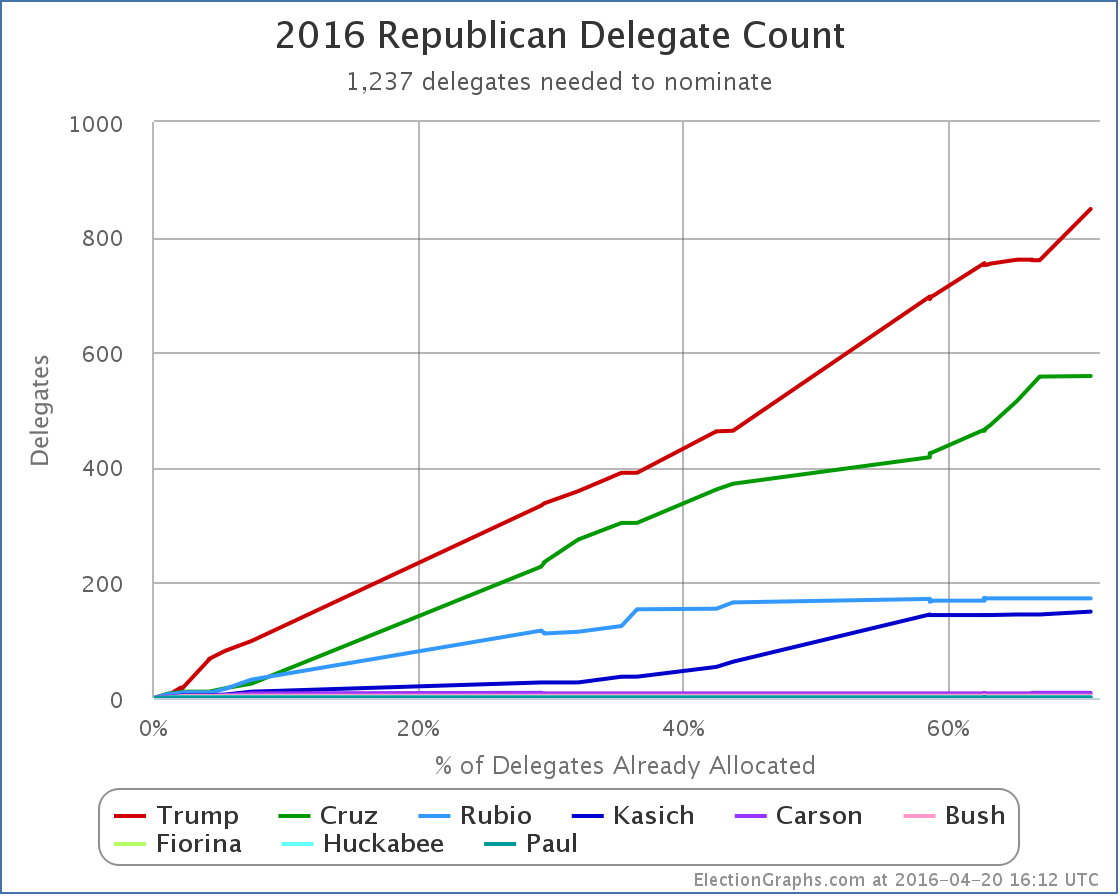
In raw delegates we now have Trump 849, Cruz 559, Rubio 173, Kasich 150, Carson 9, Bush 4, Fiorina 1, Huckabee 1, Paul 1. We have 725 delegates still outstanding or uncommitted. 1237 delegates are needed to win.
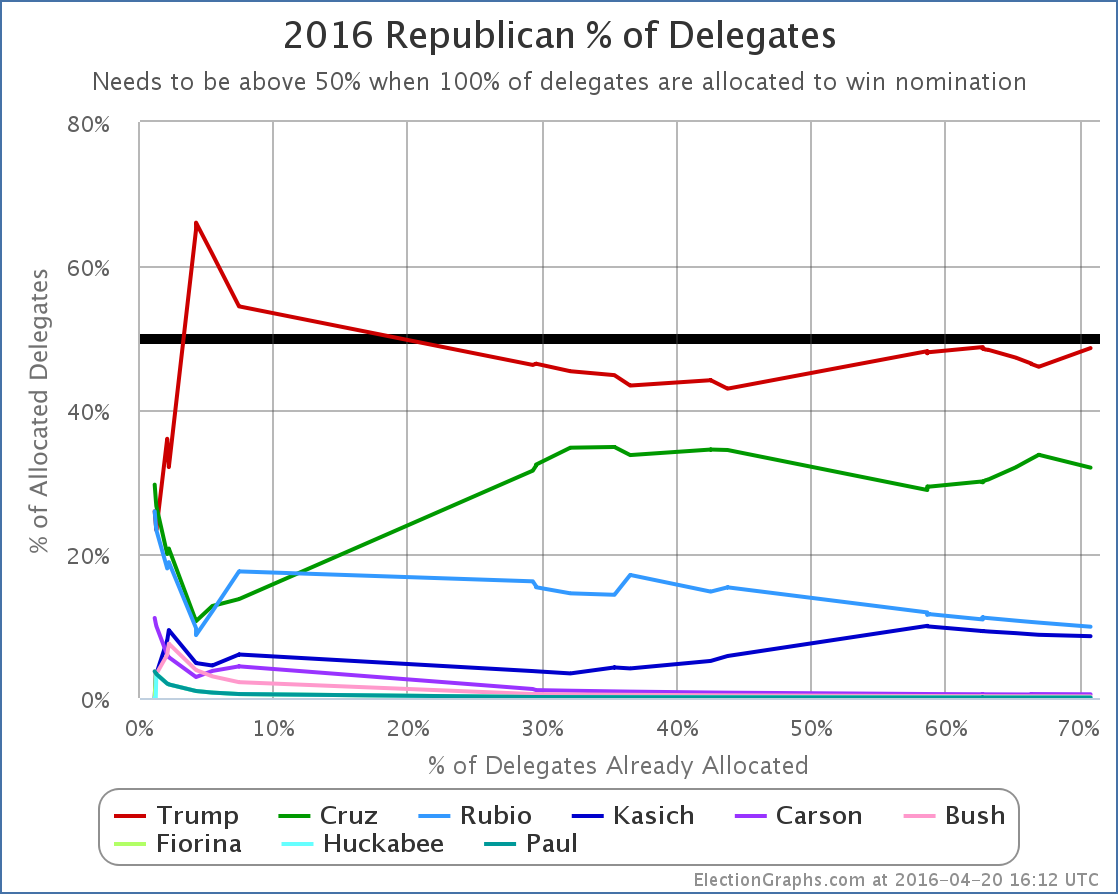
In percentage terms Trump now has 48.60% of the delegates determined so far. He is very very close to the magical 50% mark, but not quite there.
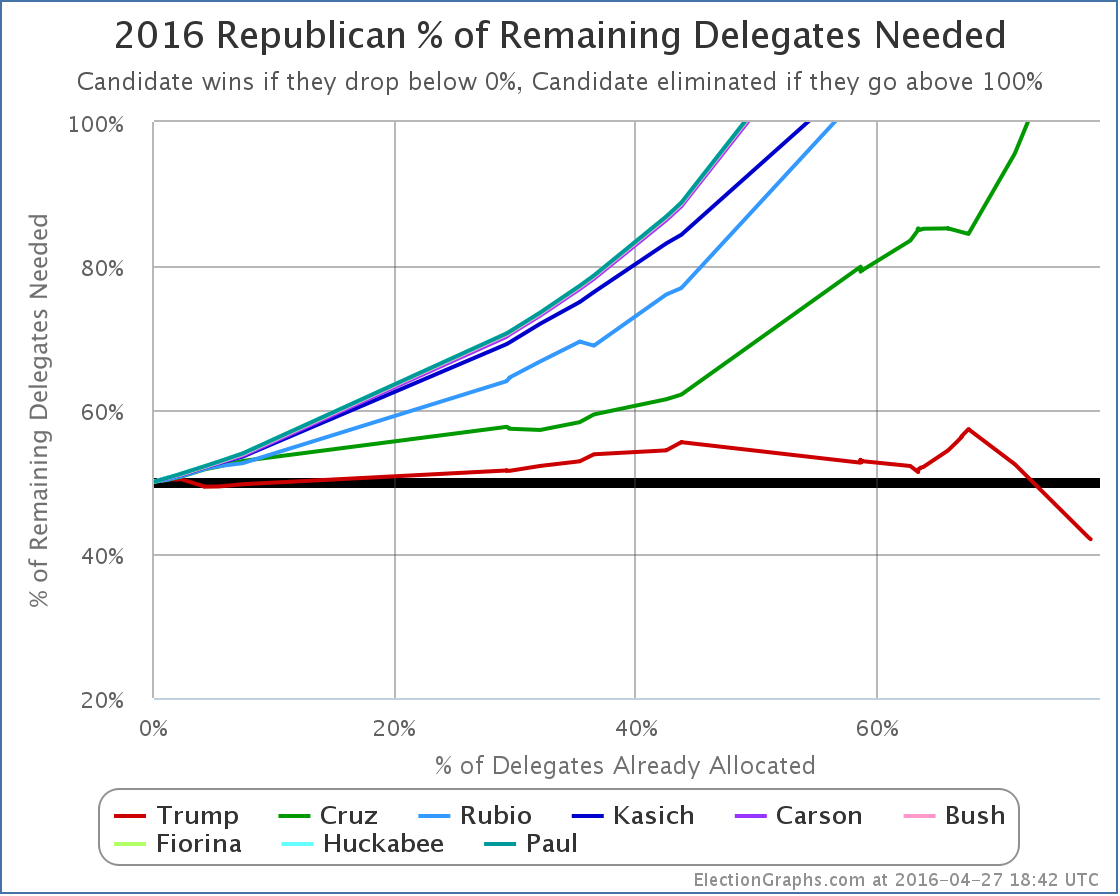
So time to look at the all important “% of remaining delegates needed” graph. As mentioned in the post here about Wyoming: If Trump did as well as was expected, he would undo most, but not all, of the damage done by Cruz’s recent series of wins, and that is exactly what played out.
Trump was down to 52.22% before his series of losses. After those losses he was up to 58.17%. Now he is back down to 53.52%.
Trump needs to get at least 53.52% of the remaining delegates… including officially uncommitted delegates… to get to 1237 and win this thing outright. Even one delegate short of that, and we’re in the multi-ballot convention zone.
The next few states are all very favorable for Trump. Next Tuesday we have Pennsylvania, Maryland, Connecticut, Rhode Island, and Delaware. Trump is expected to win all of them, by significant delegate margins. It is very possible that he will be over 50% of the delegates allocated so far at that point.
But then he has to keep it. Trump will still be right on the edge. He does a little worse, we have a multi-ballot convention, he does a little better, he wins on the first ballot.
So what are Trump’s odds of getting to 1237? This is unclear. But what is clear is that we are not yet at the point where we can say that either the path to an outright Trump win, or the path to a multi-ballot convention is undeniably the likeliest outcome.
Trump can still get an outright majority of delegates. This is very plausible. It is a reasonable possibility, not just a fantasy.
Some people (including me) have characterized this as a narrow path that Trump has to get nearly perfectly. That would seem to imply relatively low odds of this outcome. Maybe 10% or 20%. (Although I gave 40% as my odds in my podcast.)
On the other extreme, you have Sam Wang putting Trump’s odds of getting to 1237 at 64%. (That was before New York, but New York played out as good or better than Wang expected, so if anything that is now low.)
Looking at the simulators at The Upshot and FiveThirtyEight you see that it is still very easy to get Trump to the magic number. You usually have to use uncommitted delegates though. Trump will need to convince some more of them to come his way.
So maybe Trump is at 30% to win outright, or maybe he is at 64%. Either way, these are odds where either outcome would not be surprising. We’re basically still in the tossup zone. We are STILL right on the edge between Trump and a multi-ballot convention. And we might stay right on that edge straight through the end of the primaries and caucuses in June… or even all the way to the convention if the uncommitted delegates don’t start letting us know what their true preferences are.
Unlike the Democratic side, where Clinton has just been slowly but surely grinding out a win, here on the Republican side we have real drama. None of the others running can realistically win outright, but they CAN still stop Trump from winning outright and force a contested convention.
And so it continues…
[Update 2016-04-27 17:28 UTC: Updated uncommitted numbers from North Dakota. Net Cruz +2.]
Note: This post is an update based on the data on ElectionGraphs.com. Election Graphs tracks both a poll based estimate of the Electoral College and a numbers based look at the Delegate Races. All of the charts and graphs seen in this post are from that site. Additional graphs, charts and raw data can be found there. All charts above are clickable to go to the current version of the detail page the chart is from, which may contain more up to date information than the snapshots on this page, which were current as of the time of this post. Follow @ElectionGraphs on Twitter or like Election Graphs on Facebook to see announcements of updates or to join the conversation. For those interested in individual general election poll updates, follow @ElecCollPolls on Twitter for all the polls as they are added.
Wyoming allocated delegates in a two stage process. 12 were determined back on March 12th. At that point the count was Cruz 9, Rubio 1, Trump 1. One uncommitted delegate was elected as well. He appears to still be uncommitted.
On April 16th Wyoming completed their process, allocating their remaining 14 “normal” delegates at their state convention. All 14 delegates went to Cruz. There are three more delegate slots for party leaders. They have not yet expressed their preferences.
This once again appears to be a case of the Trump team not even bothering to “play” in Wyoming and just letting Cruz clean up essentially unopposed. This in a race where Trump needs every delegate.
In addition, since my last post there was an update in North Carolina that resulted in moving one delegate from the Trump column to the Carson column of all places. So the net change in the last week is Cruz +14, Carson +1, Trump -1.
This obviously represents less than the 57.07% of delegates Trump needed to be on pace for a win.
Time to look at some charts:
Looking at the raw delegate count, Cruz looks like he is catching up quickly. And he has been doing extremely well recently. But there is a problem. It is very late in the process.

Cruz’s win streak has succeeded in lowering his % of remaining delegates needed to win, but not by a lot. It has dropped from 83.68% to 82.80%. This is still a number that Cruz can not realistically reach.
So Trump. His 57.07% increased to 58.17%.
New York is next. Trump is expected to do very well in New York. But the specific line to watch is the 58.17% line. Translated into delegates, this means to be on track to get to a delegate majority, he needs at least 56 of the 95 delegates. The expectation seems to be that he will exceed this bar, probably by a significant margin.
Even if Trump got all 95 delegates though, it still wouldn’t completely undo the damage of Cruz’s winning streak. In that case Trump would need 52.69% of the remaining delegates. Trump had been down to 52.22% before his string of losses. So shutting everybody out in New York wouldn’t quite get him back there. Close though.
After New York, there are quite a few more states where Trump is expected to do very well and some of them are winner take all. We’re still right on the edge between an outright Trump win and a contested convention. Anybody who says either of those two outcomes is certain at this point is premature.
We’ll see what happens in New York shortly, and the “narrative” of the race will almost certainly turn again. In the meantime, let me update the comparisons to 2008 and 2012 that I did back on March 13th.
First of all just the % of delegates won:
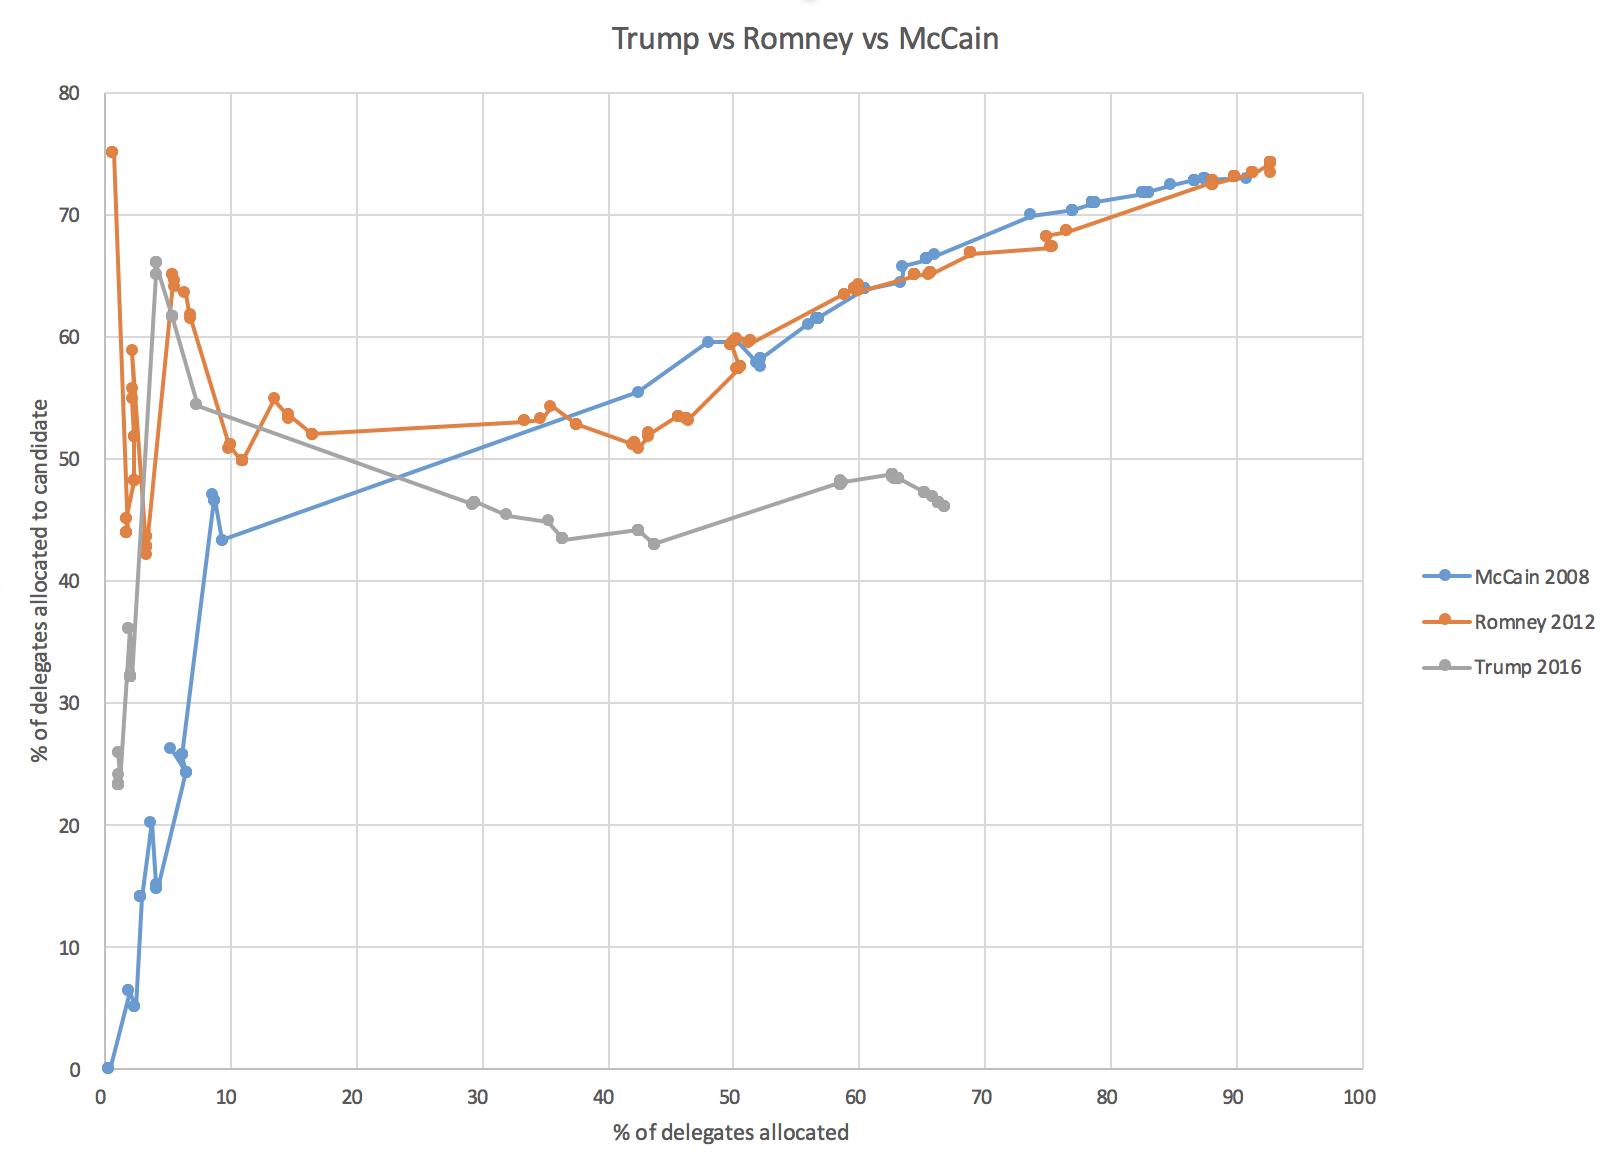
Then the more important “% of remaining delegates needed to win”:
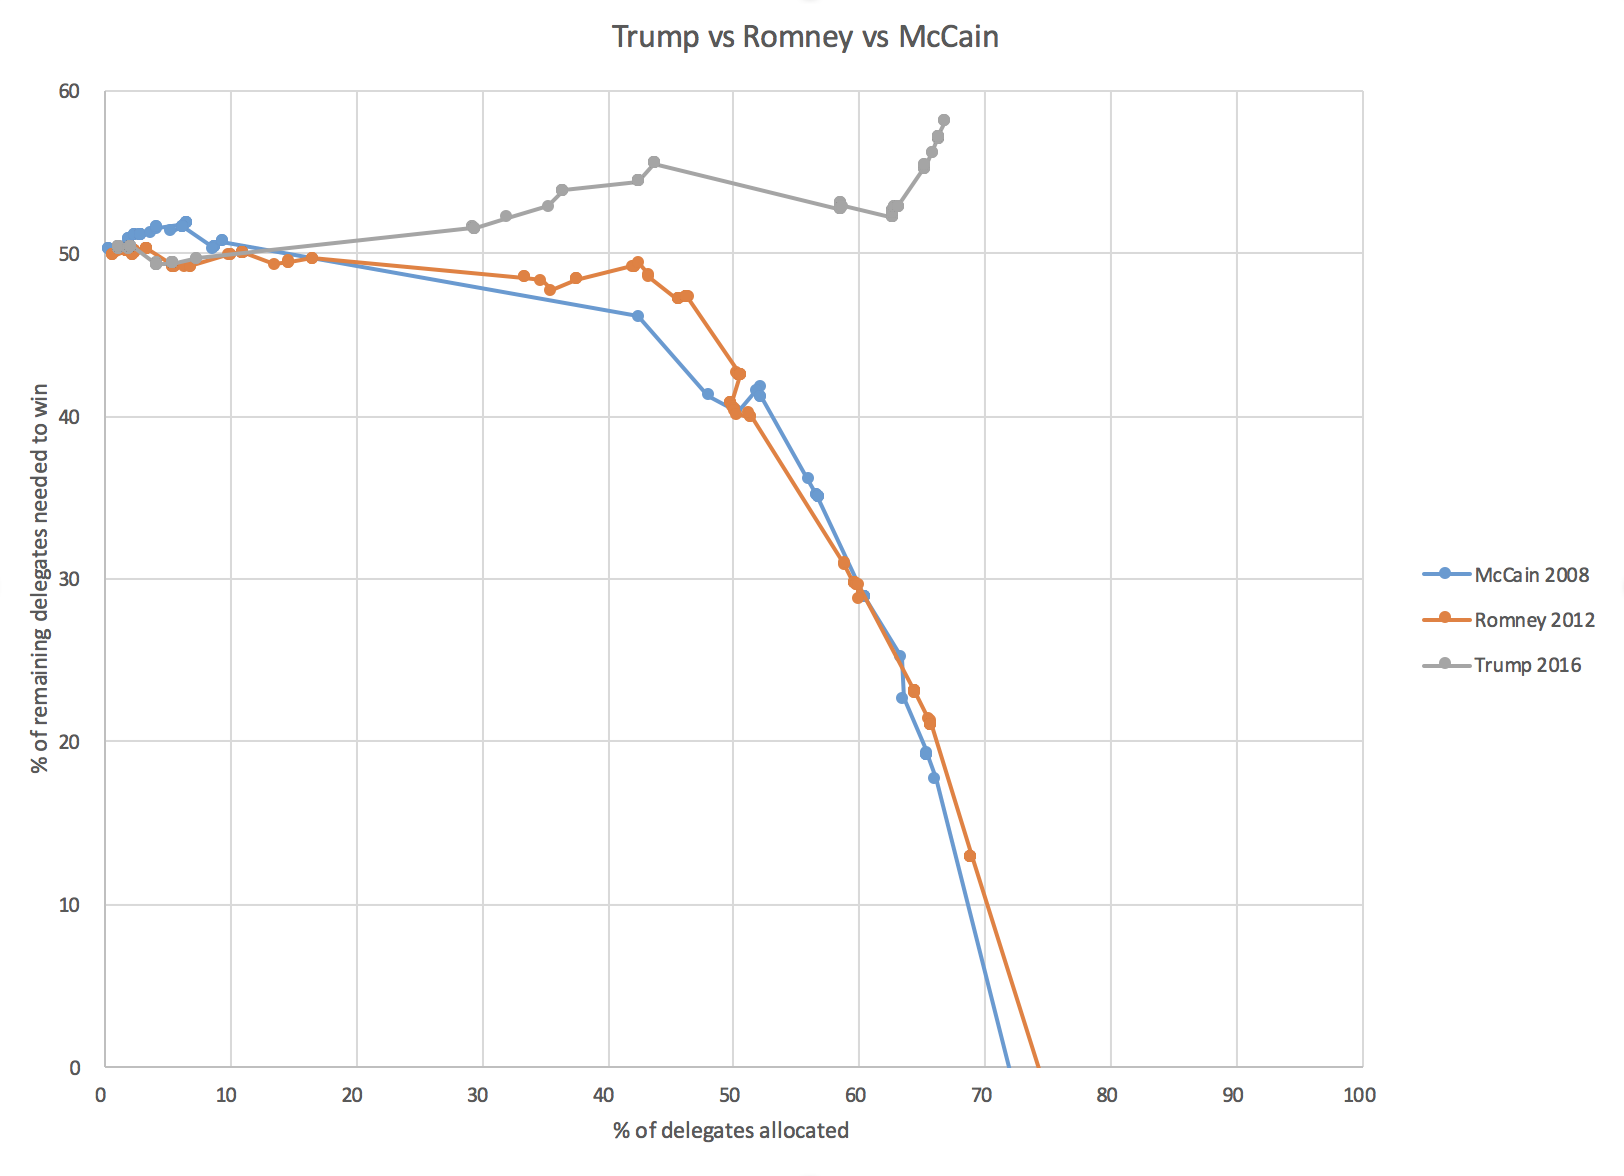
It is still possible for Trump to win outright. Barely. But it is very very clear that his path is dramatically different than the McCain or Romney patterns. In both of those cases, by this point the frontrunners were clearly the presumptive nominees, even though they hadn’t quite wrapped it up mathematically yet.
This year Trump still has a minority of the delegates, and he hadn’t even been trending in the right direction. We’re not in the “wrapping things up” stage, instead, we clearly still have a fight going on.
Which of course makes this all much more fun to watch than 2008 or 2012 were. :-)
[Update 2016-04-20 01:27 UTC: New delegate estimate from Georgia nets Cruz +1, Trump -1. This does not change the analysis above.]
Note: This post is an update based on the data on ElectionGraphs.com. Election Graphs tracks both a poll based estimate of the Electoral College and a numbers based look at the Delegate Races. All of the charts and graphs seen in this post are from that site. Additional graphs, charts and raw data can be found there. All charts above are clickable to go to the current version of the detail page the chart is from, which may contain more up to date information than the snapshots on this page, which were current as of the time of this post. Follow @ElectionGraphs on Twitter or like Election Graphs on Facebook to see announcements of updates or to join the conversation. For those interested in individual general election poll updates, follow @ElecCollPolls on Twitter for all the polls as they are added.
Colorado is odd in that it dribbled out delegates over a couple of weeks. The 6 from the 1st and 6th congressional districts were already included when the Michigan results came out. Those 6 were all Cruz. Since then I added notes about the rest of Colorado’s congressional districts to the Michigan post. Cruz won all 15 of those delegates. Then yesterday Cruz won all 13 at large delegates.
There are 3 more delegates from Colorado who are state party leaders and have not yet expressed a preference.
But Cruz has won all 34 of Colorado’s delegates that were available via the caucus process.
Since March 23rd, Trump has gotten bad news in Alaska, American Samoa, Louisiana, North Dakota, Wisconsin and Colorado. Some of those were “new” results in states, others were just updates as more information came in. Either way, none of those updates went Trump’s way.
Lets look at the chart:
After Arizona and Utah Trump needed 52.22% of the remaining delegates to be on a winning pace.
Since then the delegate deltas have been Cruz +78, Trump +6, Rubio +4, Kasich +1. And that Kasich delegate is being generous interpreting one uncommitted delegate’s comments. That might actually be a Cruz delegate in the end.
So Cruz got 78/89 = 87.6% of the delegates.
Trump got 6/89 = 6.7% of the delegates.
Needless to say this is far below the 52.22% Trump needed to improve his position.
Instead, he goes from needing 52.22% of the remaining delegates to needing 57.07%. This is huge change.
Winning 57.07% of the delegates would represent a 23% improvement over the 46.46% of delegates pace he has so far. That is a pretty substantial improvement.
Trump is in the worst position he has been so far. This is not where he wants to be. Everything is going in the wrong direction.
But is it time to assume a contested convention yet? The drum beat about that has certainly begun.
I could do my usual of calculating an estimate for New York from current polling, and then look where that puts us, but other folks have done more in depth projections. I’ll specifically point out two:
Both of these two outline scenarios where Trump can still get to 1237. These are not highly unlikely scenarios like those required to get to a Sanders win on the Democratic side, but rather perfectly reasonable possibilities given current polling data. Trusting current polls completely, Wang actually gets a 92% chance of Trump getting the delegate majority. When he adjusts for the fact Cruz has been over performing his polls, that drops to 70%. This is by no means certain, but it is still more likely than not.
In addition you can run your own simulations at The Upshot or FiveThirtyEight. With either of these it is not that hard to get Trump to 1237. Try it yourself. It is fun.
My own take is that some of Wang’s assumptions about how uncommitted delegates will break is a bit generous to Trump given his performance so far with uncommitted and unbound delegates. So 70% chance of an outright majority seems a bit high.
In the last Curmudgeon’s Corner podcast I said my gut feel was that we have a 60% chance of a multiple-ballot convention at this point. Which would mean a 40% chance that Trump wins outright. (I allowed for some additional chance of convention shenanigans like trying to change the rules to unbind delegates on the first ballot, or that the results of there 1st ballot would be unclear until the actual vote due to uncommitted delegates.)
Trump was EXPECTED to do badly in Colorado and Michigan… perhaps not quite this badly, but still it means that it is easy to get distracted by notions of “momentum” that may or may not be real. The fact that Trump did well in Arizona, but then badly in Colorado does not represent a change in the state of the race. It is just a function of the makeup of those states and the calendar. To see if things have really changed from being “right on the edge between a Trump win and a contested convention” we need to see deviations against how the remaining states are expected to play out.
We haven’t seen that quite yet.
But all the anti-Trump forces are pushing against him hard and Trump has no margin for error in the remaining states. He has to do well in all the places he is expected to do well. He might actually need to exceed expectations by a bit. If he starts dipping, even a little bit, then we are at a contested convention. And given what appears to be Cruz’s skill at collecting “ghost delegates” who are bound to Trump on the first ballot but who really support Cruz, a Trump loss on the first ballot almost certainly means Cruz (or maybe someone else, but probably Cruz) wins on a later ballot.
Keep watching New York and if Trump stays over 50% in the popular vote, which will get him all or almost all of the delegates. That is the next big test. If Trump underperforms expectations in New York, we almost certainly will have a multi-ballot convention. If he matches or exceeds expectations, then the path to an outright Trump win remains open.
[Update 2016-04-13 15:19 UTC: Update from North Carolina. Net Change: Carson +1, Trump -1.]
Note: This post is an update based on the data on ElectionGraphs.com. Election Graphs tracks both a poll based estimate of the Electoral College and a numbers based look at the Delegate Races. All of the charts and graphs seen in this post are from that site. Additional graphs, charts and raw data can be found there. All charts above are clickable to go to the current version of the detail page the chart is from, which may contain more up to date information than the snapshots on this page, which were current as of the time of this post. Follow @ElectionGraphs on Twitter or like Election Graphs on Facebook to see announcements of updates or to join the conversation. For those interested in individual general election poll updates, follow @ElecCollPolls on Twitter for all the polls as they are added.
|
|