This is the website of Abulsme Noibatno Itramne (also known as Sam Minter). Posts here are rare these days. For current stuff, follow me on Mastodon

Categories

Calendar

Electoral College: Trump no longer close to Clinton in Michigan, tipping point hits new lows

While we still have a live possibility of a contested convention, Donald Trump is still the Republican frontrunner and with the latest polls in Michigan, Trump weakens further against Clinton:

chart-63

Those polls look like the long summer of Trump may be over, at least in Michigan. Trump was never leading in Michigan, but for awhile it seemed like he might make it close. The newest poll may be an outlier, no way to tell without more polling. But for now, Michigan seems like it is reverting to being a “Strong Clinton” state.

This takes Michigan out of the list of states that could easily go either way in a Clinton vs Trump general election and lower’s Trump’s best case:

chart-64

Trump’s best case drops from winning by 102 electoral votes to only winning by 70. The “expected” case remains Clinton winning by 50 electoral votes.

Screen Shot 2016-03-06 at 18.57.42385

Looking at the spectrum of states, the “tipping point” has also changed. It used to be Michigan where before the latest poll Clinton had led by 3.6%. It is now Nevada where Clinton leads by 3.9%. This is the worst the tipping point has been for Trump since the beginning of Clinton vs Trump polling:

chart-65

This trend is not one Trump should be happy about, but make no mistake… it is still a close race. A 3.9% lead can disappear in an instant. Just three states (Iowa, Ohio and Nevada) have to flip to make Trump the winner.

247.2 days until polls start to close. Stay tuned.

Note: This post is an update based on the data on ElectionGraphs.com. Election Graphs tracks both a poll based estimate of the Electoral College and a numbers based look at the Delegate Races. All of the charts and graphs seen in this post are from that site. Additional graphs, charts and raw data can be found there. All charts above are clickable to go to the current version of the detail page the chart is from, which may contain more up to date information than the snapshots on this page, which were current as of the time of this post. Follow @ElectionGraphs on Twitter or like Election Graphs on Facebook to see announcements of updates or to join the conversation. For those interested in individual general election poll updates, follow @ElecCollPolls on Twitter for all the polls as they are added.

Republicans: On the narrow road to a contested convention…

The March 5th states have voted. Trump won Kentucky and Louisiana, Cruz won Kansas and Maine. But states don’t matter. Lets look at delegates:

From March 5th: Cruz +68, Trump +53, Rubio +13, Kasich +10 and 11 still TBD.

In addition since my Republican Super Tuesday post was originally published we had Cruz +8, Trump +4, Carson -1, Rubio -5 as vote counting finished and results were finalized.

So since the last post, Cruz +76, Trump +57, Kasich +10, Rubio +8, Carson -1.

Lets look at the all important “% of remaining delegates needed to win” graph:

chart-62

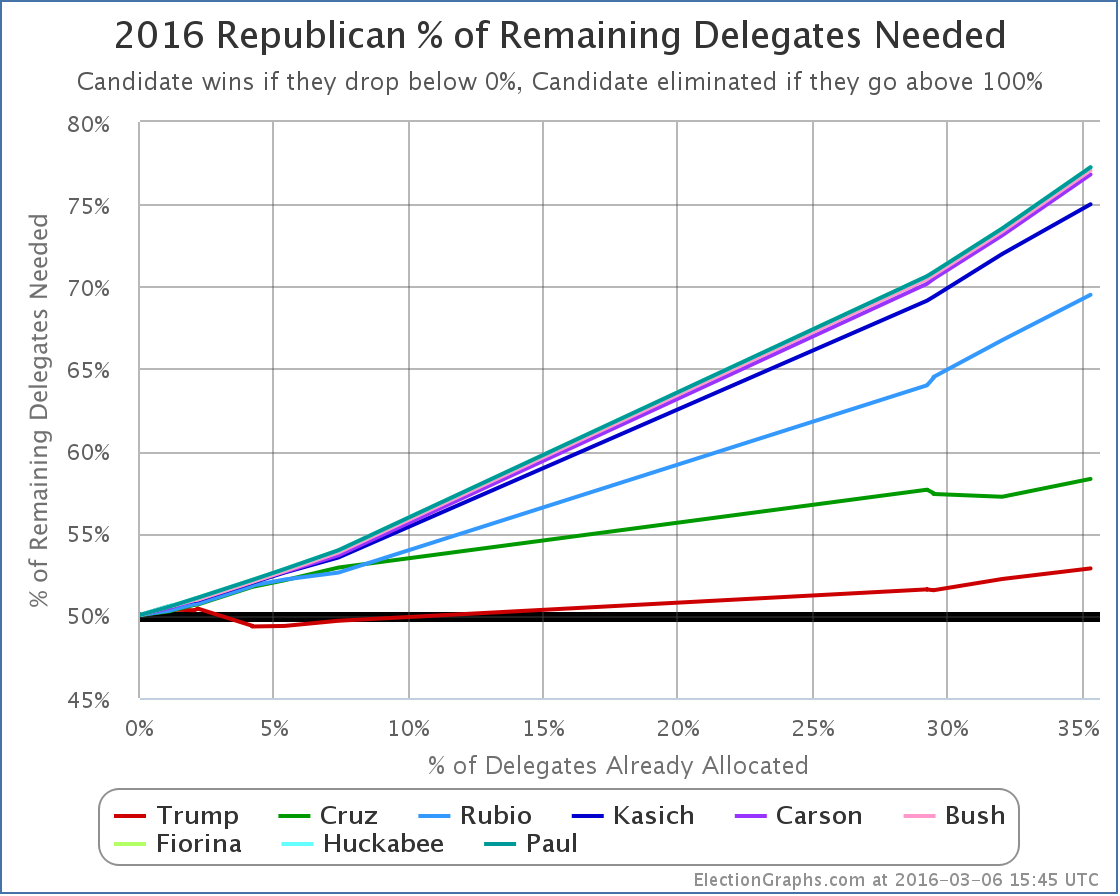
Cruz did the best here, but in order to actually improve his position in terms of winning the nomination outright, he needed to get 57.7% of the delegates since my March 2nd update. Actual result above? 50.67% of the delegates since then. He didn’t get there.

Meanwhile, Trump only needed 51.6% of the delegates, but he only got 38.00%. He didn’t even come close to getting what he needed.

Bottom line, NOBODY is getting the delegate numbers they need for a win. This may change as things progress, but for the moment, we’re still on the narrow road to a contested convention.

All of those lines are above 50%, and all of those lines are headed up. For someone to win outright, one of those lines needs to start heading down and start driving toward zero. Right now it hasn’t happened yet.

Right now Trump needs 52.88% of the remaining delegates to win outright. So the non-Trump’s collectively need to be getting 47.12% of the delegates to force a contested convention.

I stated in the Super Tuesday post that in order to keep on this path, the non-Trump’s not only need to keep Trump above that 50% line until the big winner take all states like Florida and Ohio vote on March 15th, but they need to damage Trump to the extent that he is losing states left and right once we are in the winner take all zone. Very specifically, he probably needs to lose Florida and Ohio.

Trump underperformed his polling in the March 5th states, and Cruz exceeded his. The polling was pretty sparse, but this may indicate that the onslaught of attacks against Trump by Rubio, Cruz, and others in the last two weeks may be starting to take a toll on Trump. Perhaps his own debate performances have hurt as well by signaling a general election pivot a bit too soon… or perhaps he just finally passed some sort of line on the outrageous behavior front. Polling is frustratingly sparse in the upcoming states, so it is hard to tell what the situation is, let alone if it changed due to attacks, debates, or pivots.

The big question is: “Has Trump been damaged enough that the non-Trumps can force this to the convention?”.

Right now, we are on track for that!

Don’t get too excited about that possibility quite yet though… Current polling has Trump still ahead in a number of upcoming states, including the critical races in Florida and Ohio. If he maintains those leads, this may get pushed back into territory where Trump can win outright after March 15th. All it takes is a couple of Trump wins in big winner take all states, and dreams of a contested convention will go up in smoke.

But… but… if the damage to Trump is real and sustained, we may start seeing Trump weakness elsewhere soon, including in Florida and Ohio. If so, the chances of a contested convention will go up very quickly. (The odds of one of the non-Trumps winning outright are still very small.)

Next up, in just a few hours: Puerto Rico. As far as I can tell, there has been no polling in Puerto Rico at all. We’ll see how it goes…

[Update 17:31 UTC – Unrelated to March 5th, but looks like one Georgia delegate flipped from Cruz to Rubio as results there were finalized. This doesn’t substantively change the analysis above.]

Note: This post is an update based on the data on ElectionGraphs.com. Election Graphs tracks both a poll based estimate of the Electoral College and a numbers based look at the Delegate Races. All of the charts and graphs seen in this post are from that site. Additional graphs, charts and raw data can be found there. All charts above are clickable to go to the current version of the detail page the chart is from, which may contain more up to date information than the snapshots on this page, which were current as of the time of this post. Follow @ElectionGraphs on Twitter or like Election Graphs on Facebook to see announcements of updates or to join the conversation. For those interested in individual general election poll updates, follow @ElecCollPolls on Twitter for all the polls as they are added.

Democrats: Clinton wins March 5th by 59 to 50

Absent something really surprising happening… which you never know… could happen… the posts on the Democratic side at this point are essentially just going to be documenting Clinton’s slow but sure march to the Democratic nomination.

On March 5th if you go by states, you would see Sanders winning Kansas and Nebraska, while Clinton only won Louisiana.

Of course, states don’t matter. Delegates do. For the night, Clinton got 59 delegates and Sanders got 50.

In addition, since the post about Super Tuesday there were adjustments for finalized Super Tuesday results and new superdelegate counts. The net result was that Clinton gained an additional 22 delegates while Sanders added 13.

So total since then… Clinton +81, Sanders +63.

At the time of that last post, Clinton needed 40.52% of the remaining delegates to be on track to win. Sanders needed 59.54%.

Actual percentages since then? Clinton 56.25%, Sanders 43.75%. Clearly Clinton easily exceeded her targets, while Sanders… did not.

Actual delegate counts right now: Clinton 1127, Sanders 482, O’Malley 1.

You need 2382 delegates to win. 1610 have already been counted. There are 3153 left to be determined.

Where does that put things now?

chart-61

Clinton now needs only 39.80% of the remaining delegates to win.

To catch up and win, Sanders would need 60.26% of the remaining delegates.

Next up is Maine. I haven’t found any polling on Maine. It seems like it might be a good state for Sanders. But is it 60.26% good? In delegate terms that would be 16 of the 25 pledged delegates. Guess we’ll find out.

[Update 15:56 UTC: Overnight updates gave Sanders 1 additional delegate in Louisiana and Clinton 1 less. So if I’d waited until morning to post this the title would have said Clinton won 58 to 51 rather than 59 to 50. But the substance of the post remains the same.]

[Update 2016-03-07 03:07 UTC: Another update gives Sanders yet another delegate in Louisiana and Clinton yet another less. So Louisiana now Clinton 37 to Sanders 14, and March 5th contests overall Clinton 57 to Sanders 52.]

Note: This post is an update based on the data on ElectionGraphs.com. Election Graphs tracks both a poll based estimate of the Electoral College and a numbers based look at the Delegate Races. All of the charts and graphs seen in this post are from that site. Additional graphs, charts and raw data can be found there. All charts above are clickable to go to the current version of the detail page the chart is from, which may contain more up to date information than the snapshots on this page, which were current as of the time of this post. Follow @ElectionGraphs on Twitter or like Election Graphs on Facebook to see announcements of updates or to join the conversation. For those interested in individual general election poll updates, follow @ElecCollPolls on Twitter for all the polls as they are added.

Update 08:40 to add actual delegate counts, how many are left, etc.

@ElectionGraphs tweets from 2016-03-05 (UTC)

@ElecCollPolls tweets from 2016-03-05 (UTC)

@abulsme tweets from 2016-03-05 (UTC)