Cruz won Wisconsin decisively with 36 delegates to Trump’s 6. That’s 85.71% of the delegates.
Adding in other updates and delegate adjustments in Alaska, Colorado, American Samoa, Louisiana, and North Dakota that happened since my last post and you end up with a net change of Cruz +50, Trump +6, Rubio+4, Kasich +1. That’s 81.97% of the delegates for Cruz, which is pretty overwhelming.
But Cruz needed 83% and change to actually be on pace to win the nomination outright. He did that in Wisconsin, but when you factor in all of the other things since Arizona and Utah he falls a little bit short. The net result is he holds steady. Cruz now needs 83.64% of the remaining delegates to actually win outright.
Nobody expects Cruz to win delegates at that pace. The scenario where Cruz actually gets to 1,237 delegates before the convention is outrageously unlikely.
So lets look at the more relevant question. Does this stop Trump from getting to 1,237?
Well, it certainly makes it harder:
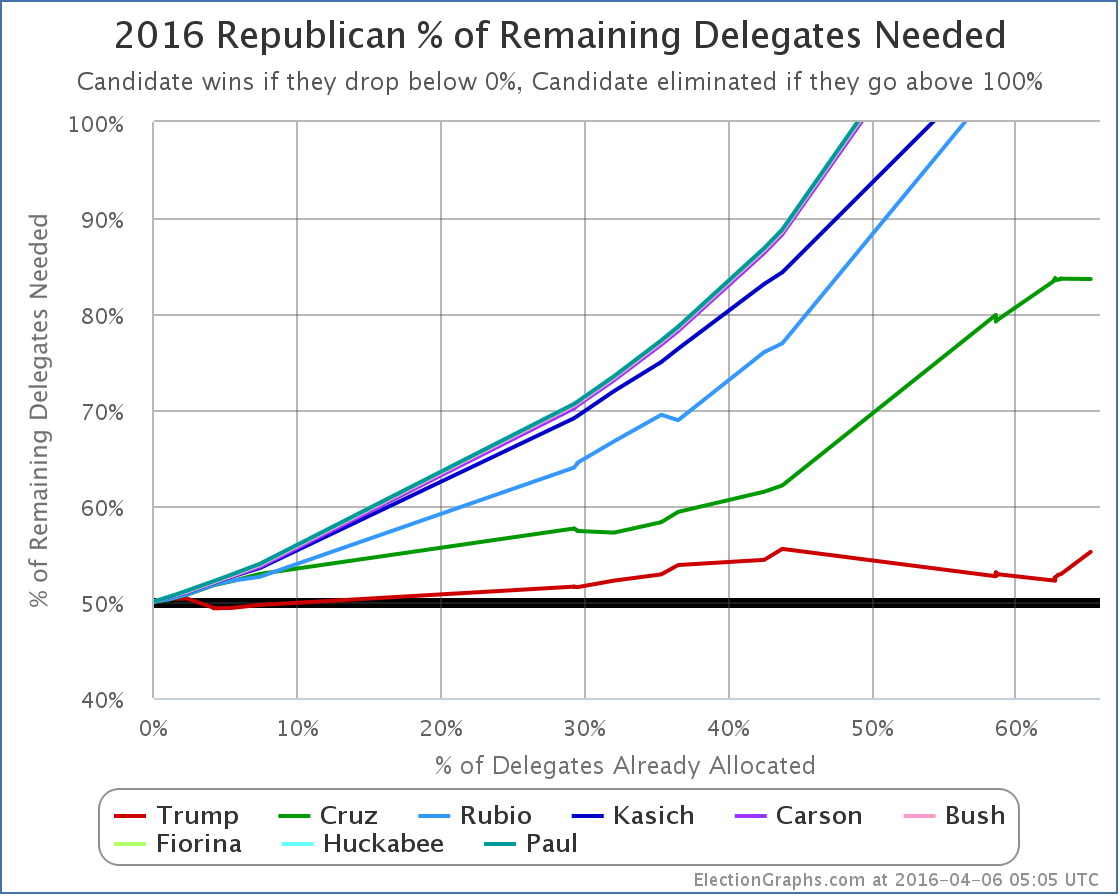
Between all of the things happening recently mentioned above, Trump goes from needing 52.22% of the remaining delegates to win outright, to needing 55.22%. Given that so far he has only managed 47.27%, this will clearly be a bit of a lift. If we had all proportional contests from here on out, it would probably be time to say it just wasn’t going to happen and buckle up for the contested convention.
Because of the craziness of winner take all and winner take most states though, we’re probably not quite there yet. But we’re a lot closer than we were before Wisconsin. But even that is complicated.
Taking Wisconsin into account, if you use 528’s “Can you get Trump to 1,237” calculator and follow the expert consensus projections, Trump falls about 55 delegates short. Now, they are giving Trump none of the uncommitted delegates. I agree that Trump won’t do well in this group, but zero seems a bit light.
The general picture though remains, which is that if all the remaining states go “as expected” Trump will fall slightly short of a majority of the delegates, and we’ll have a multi-ballot Republican convention for the first time since 1948. (The last time for the Democrats was 1952.)
To avoid this, Trump has to not just meet expectations in all of the coming states, but exceed them by just a little bit. With the drumbeat of perceived problems and missteps Trump has had in the last few weeks, this may seem unlikely. It may seem that Trump coming in below the current expectations is more likely. There has even been some talk that Trump has peaked and the long anticipated Trump collapse has now started.
A few weeks ago FiveThirtyEight projected Trump to get 25 of the 42 delegates in Wisconsin. The six Trump actually got is a long way from 25. That certainly seems to indicate we might be seeing a Trump collapse.
But wait… in the New York Times Nate Cohn gave Trump’s “expected” popular vote result in Wisconsin based on demographics and previous history as 35%. What was the actual result? 35.1%. That means that compared to where he was before, Trump’s performance didn’t actually constitute any sort of collapse. Trump is not in freefall. Instead, Trump came in pretty much where he was expected to in the popular vote.
So why the shellacking in delegates? It seems like this is due more to Cruz doing better than expected than to Trump doing worse than expected. The way this lined up in Wisconsin, it gave Cruz the overwhelming delegate win.
But this may or may not translate into other states. New York is not Wisconsin.
We will have some more information from Colorado this weekend and Wyoming next weekend. Trump is not expected to do very well in either, but we can look for clues in terms of if he meets or exceeds the projections there. But the next big bunch of delegates is April 19th in New York where Trump is expected to do very well. Then a lot of East coast states where Trump is also favored. But the question is not just “does Trump win” it is “does Trump win by enough”.
Right now, we are still in the zone where an outright Trump win is possible. But it requires Trump to improve on his performance so far, at a time where it seems like he is holding steady, but not really gaining ground. And despite not really taking aim at him until way later than many people thought they should have, the anti-Trump forces are now in full force, throwing everything they have at Trump. Improving his performance to the 55.22% of delegates average he needs to win outright may be a very tall order.
It may be slightly too soon to say that we are definitely going to have a multi-ballot contested convention… but the odds seem to be getting better by the day. And the chances that we will have some sort of craziness… the result of the first ballot determined by uncommitted delegates… or convention floor fights on rules changes or delegate credentialing that might impact the voting… seems to be very likely indeed.
So if you are a political junkie, go ahead and book July 18th to July 21st as days off from work, because there will almost certainly be fireworks of some sort, and you’ll want to be at home keeping up with the craziness minute by minute.
Right?
Or is that just me? :-)
[Update 2016-04-08 18:09 UTC – Results from Colorado’s 7th Congressional district in. Cruz +3. This doesn’t substantially change the analysis above.]
[Update 2016-04-09 16:24 UTC – Results from Colorado’s 2nd, 3rd, 4th and 5th Congressional districts: Cruz +12. Cruz has completely shut out Trump in Colorado’s 7 congressional districts. The statewide delegates will be determined later today. With the changes so far in Colorado, Trump now needs 56.20% of the remaining delegates to win.]
Note: This post is an update based on the data on ElectionGraphs.com. Election Graphs tracks both a poll based estimate of the Electoral College and a numbers based look at the Delegate Races. All of the charts and graphs seen in this post are from that site. Additional graphs, charts and raw data can be found there. All charts above are clickable to go to the current version of the detail page the chart is from, which may contain more up to date information than the snapshots on this page, which were current as of the time of this post. Follow @ElectionGraphs on Twitter or like Election Graphs on Facebook to see announcements of updates or to join the conversation. For those interested in individual general election poll updates, follow @ElecCollPolls on Twitter for all the polls as they are added.