This is the website of Abulsme Noibatno Itramne (also known as Sam Minter). Posts here are rare these days. For current stuff, follow me on Mastodon

Categories

Calendar

Republicans: New York goes Trump, exactly as expected

Trump won New York 90 to 5. Those 5 delegates went to Kasich.

If there was any surprise here, it was that Trump got a few more delegates than expected. I didn’t track it in detail, but my impression was that most people expected a result in the 80’s.

In addition, since Wyoming there was an update to the delegate count in Georgia that moved one delegate from Trump to Cruz. So the net change since Wyoming was Trump +89, Kasich+5, Cruz +1.

So Trump got 93.68% of the delegates since Wyoming. He only needed 58.17% of the delegates. He easily cruised past this bar. So where does this put things?

chart-112

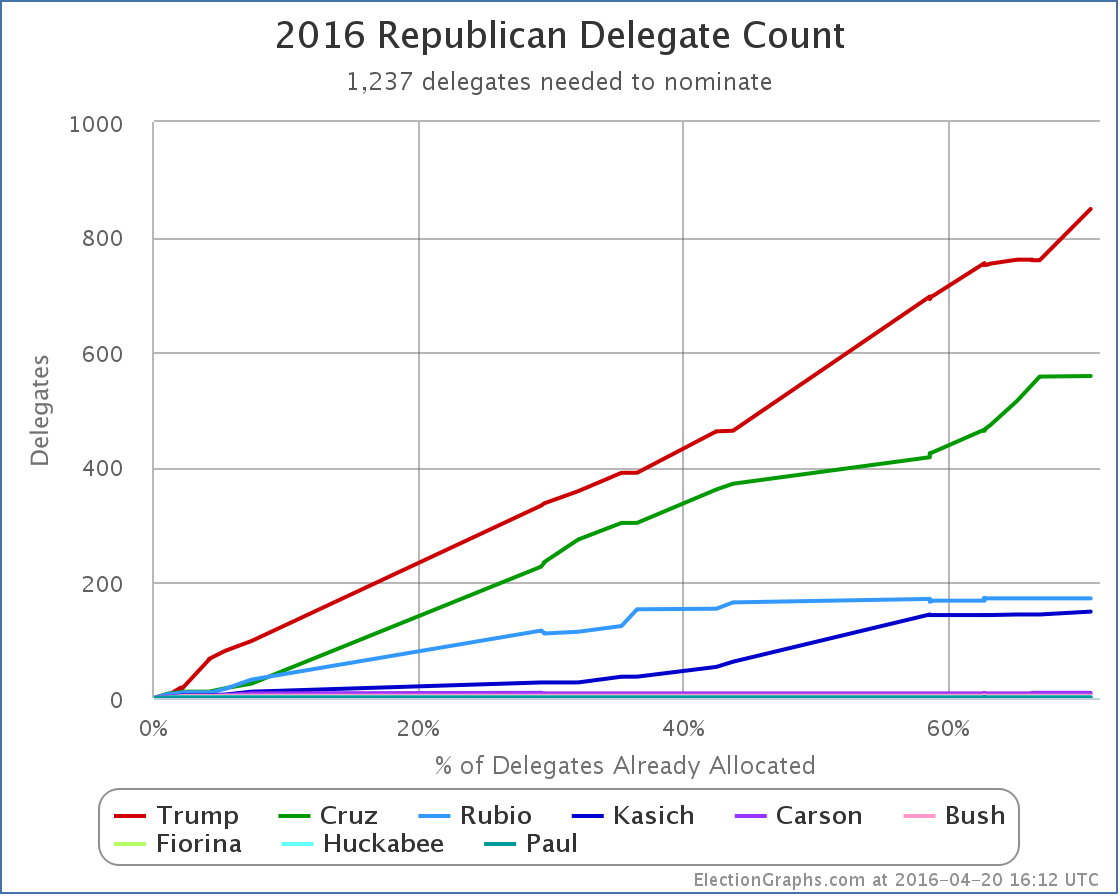
In raw delegates we now have Trump 849, Cruz 559, Rubio 173, Kasich 150, Carson 9, Bush 4, Fiorina 1, Huckabee 1, Paul 1. We have 725 delegates still outstanding or uncommitted. 1237 delegates are needed to win.

chart-113

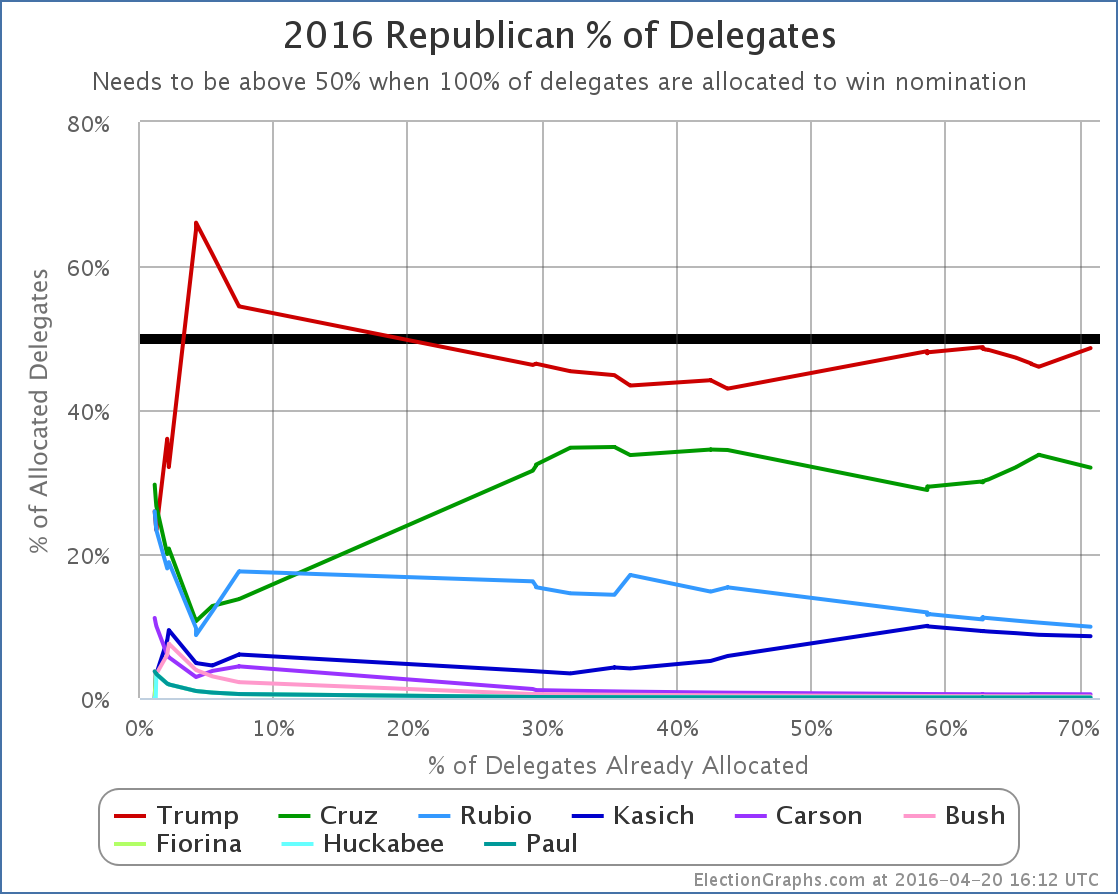
In percentage terms Trump now has 48.60% of the delegates determined so far. He is very very close to the magical 50% mark, but not quite there.

chart-114

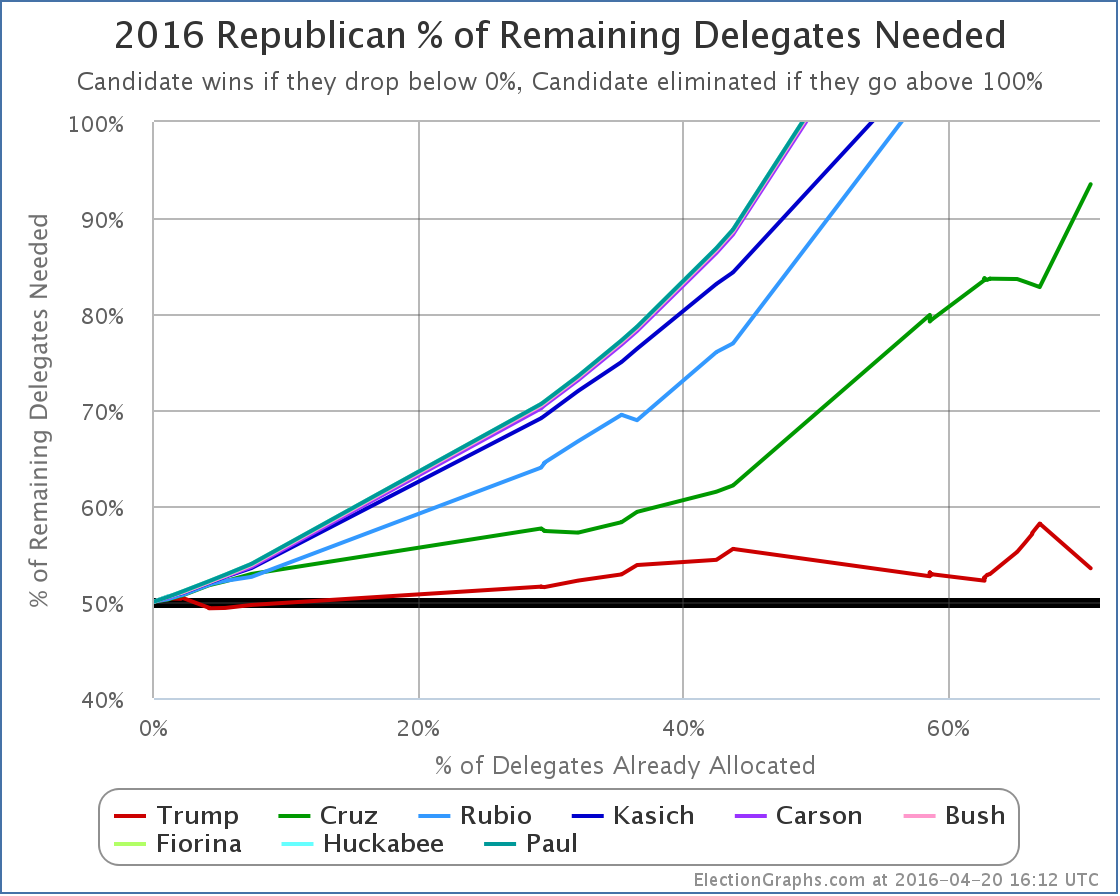
So time to look at the all important “% of remaining delegates needed” graph. As mentioned in the post here about Wyoming: If Trump did as well as was expected, he would undo most, but not all, of the damage done by Cruz’s recent series of wins, and that is exactly what played out.

Trump was down to 52.22% before his series of losses. After those losses he was up to 58.17%. Now he is back down to 53.52%.

Trump needs to get at least 53.52% of the remaining delegates… including officially uncommitted delegates… to get to 1237 and win this thing outright. Even one delegate short of that, and we’re in the multi-ballot convention zone.

The next few states are all very favorable for Trump. Next Tuesday we have Pennsylvania, Maryland, Connecticut, Rhode Island, and Delaware. Trump is expected to win all of them, by significant delegate margins. It is very possible that he will be over 50% of the delegates allocated so far at that point.

But then he has to keep it. Trump will still be right on the edge. He does a little worse, we have a multi-ballot convention, he does a little better, he wins on the first ballot.

So what are Trump’s odds of getting to 1237? This is unclear. But what is clear is that we are not yet at the point where we can say that either the path to an outright Trump win, or the path to a multi-ballot convention is undeniably the likeliest outcome.

Trump can still get an outright majority of delegates. This is very plausible. It is a reasonable possibility, not just a fantasy.

Some people (including me) have characterized this as a narrow path that Trump has to get nearly perfectly. That would seem to imply relatively low odds of this outcome. Maybe 10% or 20%. (Although I gave 40% as my odds in my podcast.)

On the other extreme, you have Sam Wang putting Trump’s odds of getting to 1237 at 64%. (That was before New York, but New York played out as good or better than Wang expected, so if anything that is now low.)

Looking at the simulators at The Upshot and FiveThirtyEight you see that it is still very easy to get Trump to the magic number. You usually have to use uncommitted delegates though. Trump will need to convince some more of them to come his way.

So maybe Trump is at 30% to win outright, or maybe he is at 64%. Either way, these are odds where either outcome would not be surprising. We’re basically still in the tossup zone. We are STILL right on the edge between Trump and a multi-ballot convention. And we might stay right on that edge straight through the end of the primaries and caucuses in June… or even all the way to the convention if the uncommitted delegates don’t start letting us know what their true preferences are.

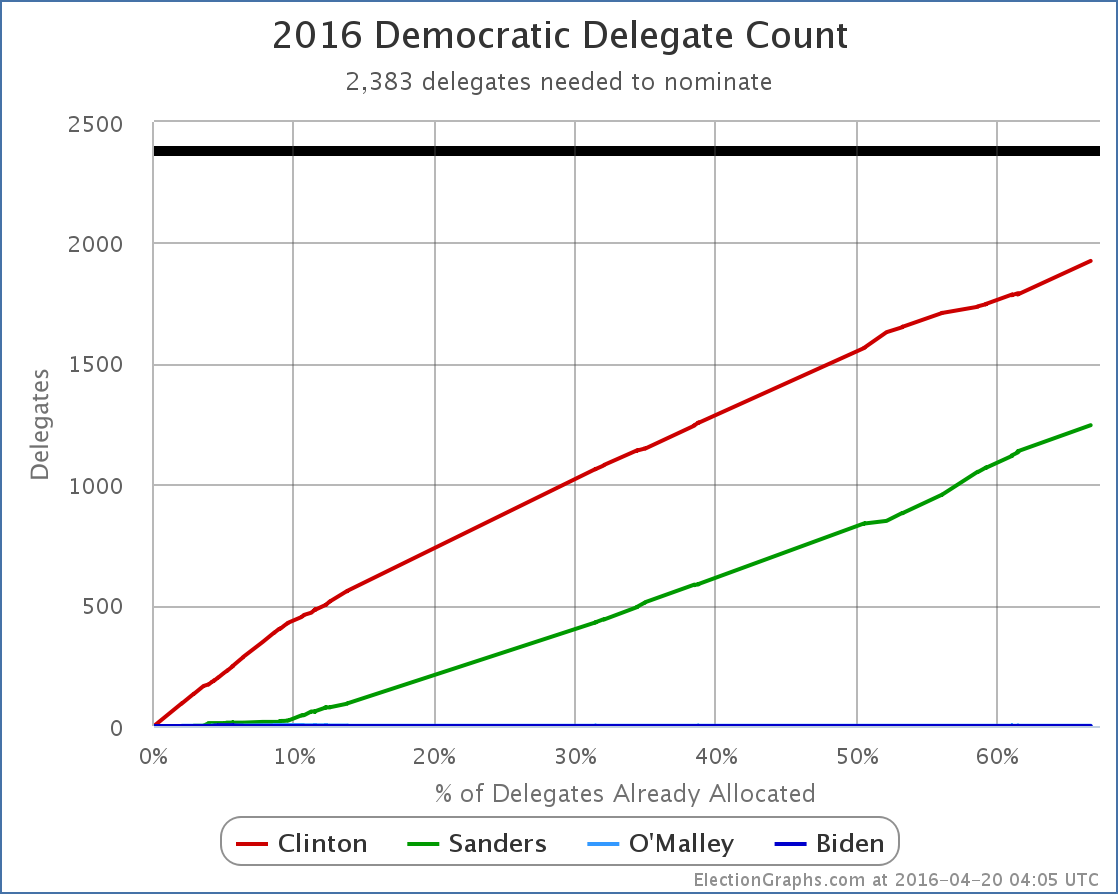
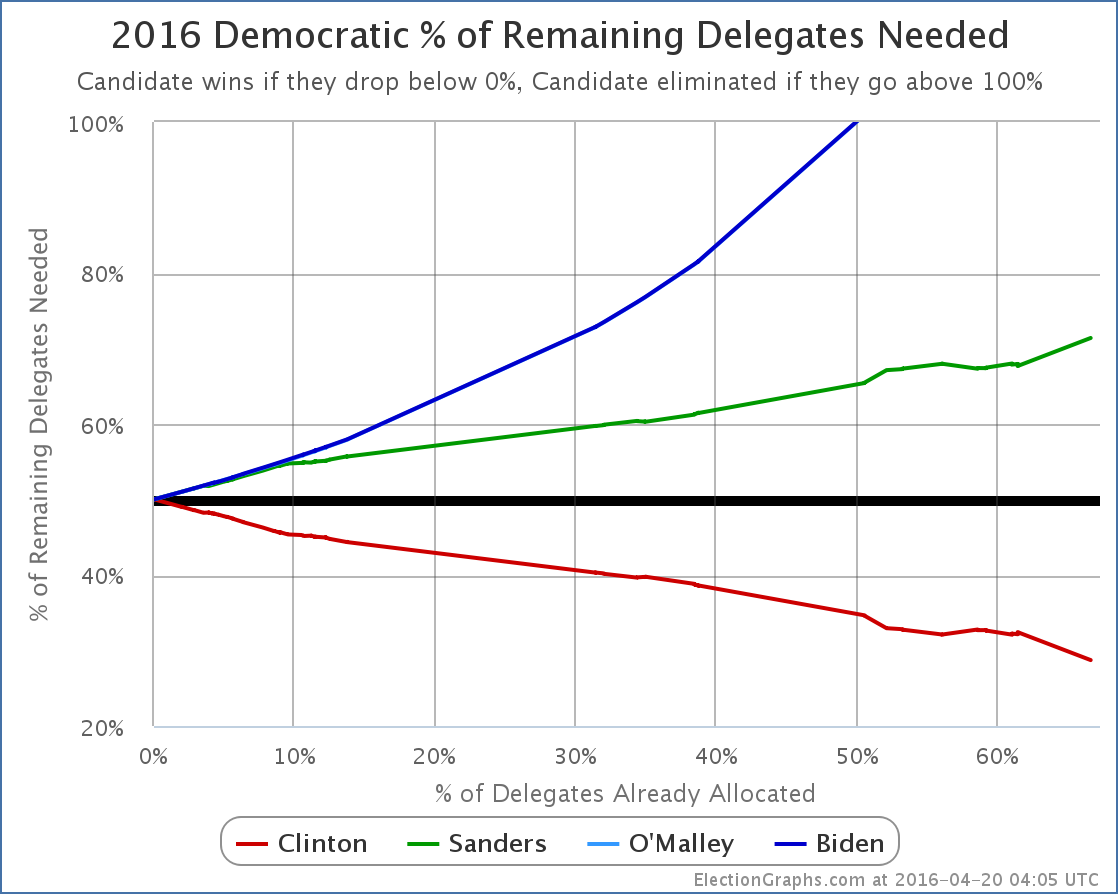
Unlike the Democratic side, where Clinton has just been slowly but surely grinding out a win, here on the Republican side we have real drama. None of the others running can realistically win outright, but they CAN still stop Trump from winning outright and force a contested convention.

And so it continues…

[Update 2016-04-27 17:28 UTC: Updated uncommitted numbers from North Dakota. Net Cruz +2.]

Note: This post is an update based on the data on ElectionGraphs.com. Election Graphs tracks both a poll based estimate of the Electoral College and a numbers based look at the Delegate Races. All of the charts and graphs seen in this post are from that site. Additional graphs, charts and raw data can be found there. All charts above are clickable to go to the current version of the detail page the chart is from, which may contain more up to date information than the snapshots on this page, which were current as of the time of this post. Follow @ElectionGraphs on Twitter or like Election Graphs on Facebook to see announcements of updates or to join the conversation. For those interested in individual general election poll updates, follow @ElecCollPolls on Twitter for all the polls as they are added.

Democrats: New York goes Clinton, exactly as expected

Clinton won New York 139 to 108.

This is only a surprise to Sanders supporters who were in deep denial. This is exactly as has been expected for many many weeks. The series of Sanders wins prior to this were also mostly predicted. The one exception (Michigan, where Sanders did outperform expectations) wasn’t enough of a win to actually help Sanders. The Clinton vs Sanders wins and losses have for the most part played out very close to expectations. The variations from that have only been a few delegates here or there.

The breathless talk of momentum and talk of a Sanders path to victory has mostly been due to the Sanders camp desperately trying to spin whatever narrative they have, the general public not understanding how the process works (yes, superdelegates count), the public not understanding the math (even massive Sanders wins at this point aren’t enough to catch up and win), and the media hopelessly biased toward a race being more fun to cover than just monitoring progress toward an almost inevitable result.

It has been clear since around March 6th… at the LATEST… probably earlier to be honest… that absent a major Clinton implosion, Clinton would be the nominee and Sanders wasn’t going to catch her.

And yes, yes, even today… for that matter even up until the actual votes are cast at the convention… there is still that chance of a Clinton implosion. There could be some new scandal, some new health event, or something else, that causes even Clinton supporters to abandon her. That would potentially change everything, even if Clinton already has things wrapped up mathematically.

Absent that though, this result has been clear for a long time, and we are just watching the steps to get there.

In addition to New York, since the last democratic contest in Wyoming there have been a variety of superdelegate changes, plus revised results from Colorado. The net result of all of those was Sanders +5, Clinton -2. Those are good numbers for Sanders, but small.

Add in New York and the results since Wyoming are Clinton +137, Sanders +113.

That means Clinton got 54.80% of the delegates. She only needed 32.23%.

Sanders got 45.20% of the delegates. He needed 67.84%.

So the already nearly impossible Sanders path gets even more remote.

chart-111

I don’t usually post the raw delegate count graph, but we are now in sight of the finish line.

We now have Clinton 1925, Sanders 1245, O’Malley 1. With 1594 delegates still to be determined, and 2383 needed to win the nomination.

You can see that since primaries and caucuses began (around the 9% mark), with only a few exceptions here and there, the pace at which both candidates have collected delegates has been pretty steady. (If you look at this with a date axis it looks much more jagged, but this is all just distortion caused by the way the states happened to be scheduled, looking at % allocated removes this distortion and allows you to look more cleanly at the actual trends.)

Clinton has been consistently ahead, and except for a few short exceptions has been gradually increasing her lead.

It is clear even from this chart that to catch up before we get to 100% there would need to be a dramatic change, not just a small improvement on the Sanders side.

But lets look at the more telling “% of remaining delegates needed” graph:

chart-110

Sanders now needs 71.39% of the remaining delegates (including the remaining superdelegates) to catch up and win the nomination.

Meanwhile, Clinton only needs 28.73% of the remaining delegates.

Or, as always, this changes if a massive wave of Clinton superdelegates start changing their minds and going over to Sanders. That hasn’t happened so far, and absent the Clinton implosion discussed earlier, is very unlikely to happen now.

We will probably still keep hearing about it not being over until the vote at the convention because the superdelegates might change their minds though. Because they CAN change their minds. But they tend not to. It is over. It has been for a long time.

Absent the Clinton implosion of course.

[Edit 16:42 UTC to add the raw delegate totals.]

[Update 2016-04-24 00:13 UTC – Superdelegate scan: Clinton +2]

[Update 2016-04-26 16:18 UTC – Superdelegate scan and updates in Illinois and Ohio. Net change: Clinton +3, Sanders +1.]

[Update 2016-04-27 16:55 UTC – Superdelegate scan: Clinton +4]

Note: This post is an update based on the data on ElectionGraphs.com. Election Graphs tracks both a poll based estimate of the Electoral College and a numbers based look at the Delegate Races. All of the charts and graphs seen in this post are from that site. Additional graphs, charts and raw data can be found there. All charts above are clickable to go to the current version of the detail page the chart is from, which may contain more up to date information than the snapshots on this page, which were current as of the time of this post. Follow @ElectionGraphs on Twitter or like Election Graphs on Facebook to see announcements of updates or to join the conversation. For those interested in individual general election poll updates, follow @ElecCollPolls on Twitter for all the polls as they are added.

@ElectionGraphs tweets from 2016-04-19 (UTC)

@ElecCollPolls tweets from 2016-04-19 (UTC)

@abulsme tweets from 2016-04-19 (UTC)