A couple of days ago, Utah moved from Strong Trump to Weak Trump in my classifications, so I speculated that Trump’s post-clinching bump might be over. But with the most recent batch of polls (from Pennsylvania, Florida and Connecticut) there is already another move in Trump’s direction. Remember that the picture given by trailing state poll averages will always “lag” the underlying situation a bit, but for the moment, the trend I track here still looks like it is moving in Trump’s direction.
Lets look at the details. The state that changes status is Pennsylvania:
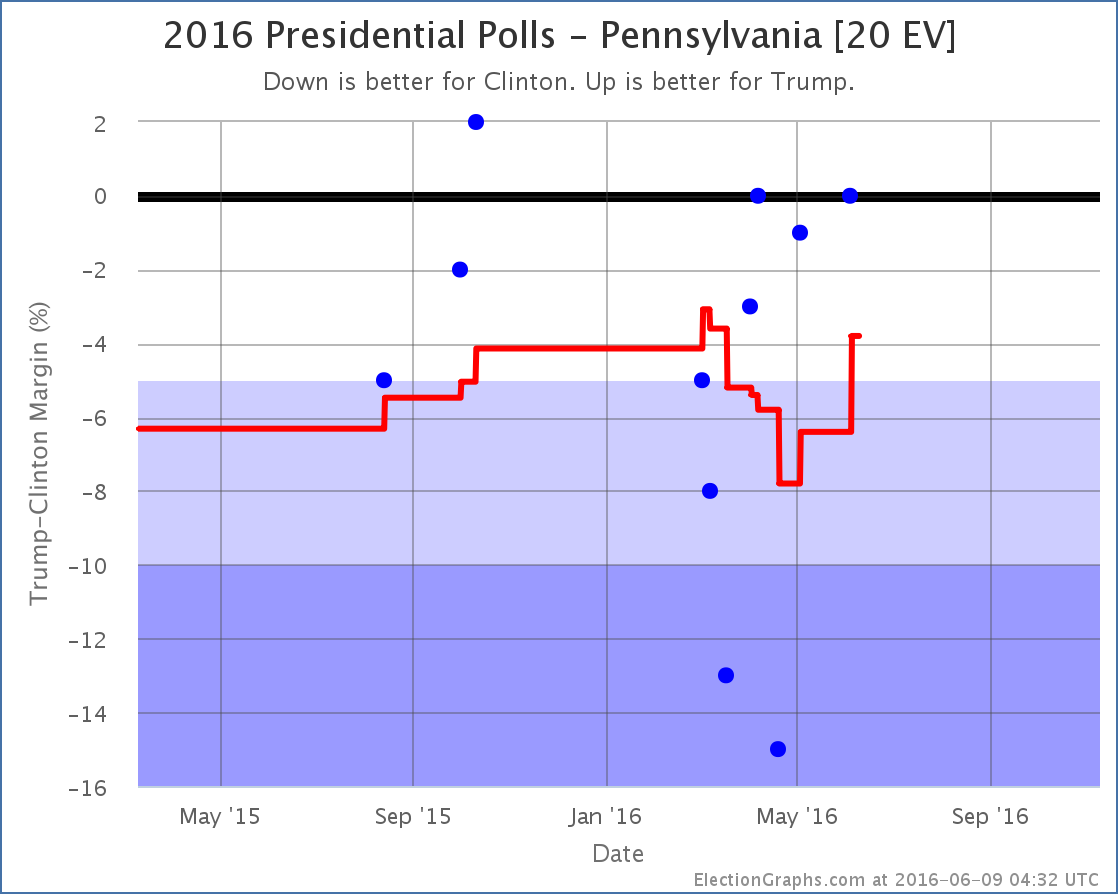
The range of poll results in Pennsylvania has been huge. From a 15% Clinton lead to a 2% Trump lead. With the addition of the latest poll, one of the two polls that showed Clinton up by more than 10% fall off the average, and therefore the average pops in Trump’s direction.This brings the average in Pennsylvania to a 3.8% Clinton lead. Clinton is still ahead, but it is once again close enough that I allow for the possibility of Trump pulling the state into his column.
If Trump actually is able to get Pennsylvania, it is a big get. Pennsylvania has the sixth largest number of electoral votes. Adding Pennsylvania into Trump’s best case, the national trend now looks like this:
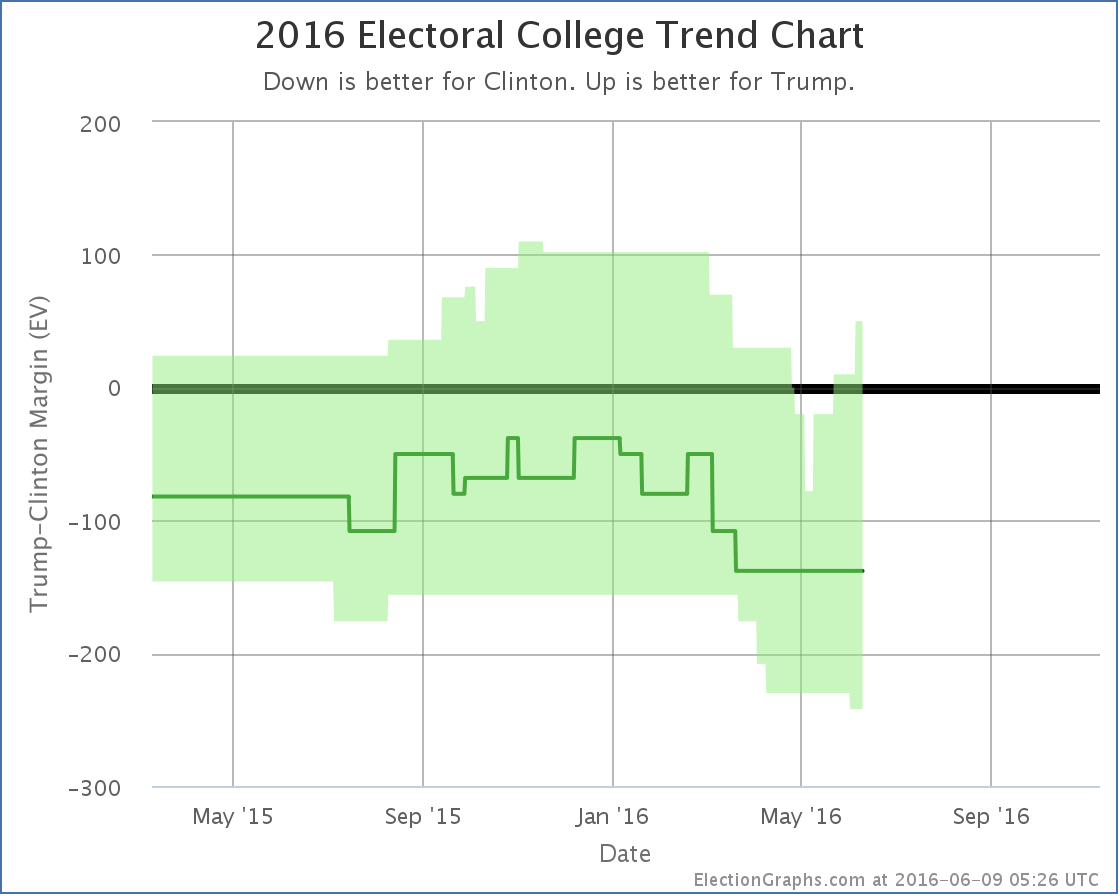
That spike in the upper right is Pennsylvania. In both electoral votes and the potential to make a difference in the race, Pennsylvania is more significant than Utah. If Clinton were to win Utah, it would be a surprise extra on top of an already large win, but a competitive Pennsylvania would potentially be very important to a winning path for Trump.
With Pennsylvania in the mix, if Trump won all the states where he leads, plus all the states where Clinton’s lead is less than 5%, Trump wins by a 50 electoral vote margin. This is his best “best case” since March.
Overall, despite Utah, and despite the fact the center “expected” line hasn’t moved, it looks like the overall trend here is still toward Trump.
The tipping point also moves with this change, and further boosts that impression:
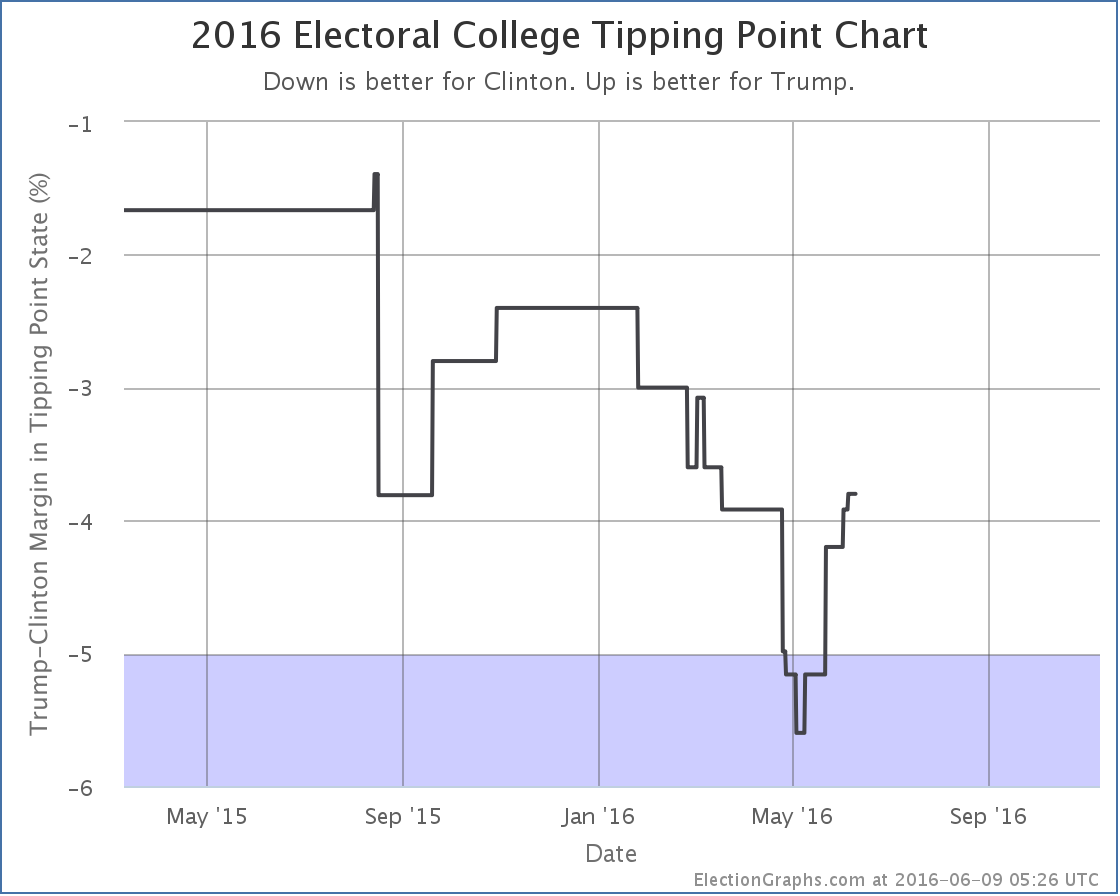
The tipping point moves from a Clinton lead of 3.9% in Nevada to a Clinton lead of 3.8% in Pennsylvania.
Given Clinton clinching the Democratic nomination and the national polls already showing Clinton pulling ahead, an end to the Trump bounce and a beginning of a Clinton bounce is to be expected. But it isn’t showing up here yet…
152.7 days until polls start to close on election night.
Note: This post is an update based on the data on ElectionGraphs.com. Election Graphs tracks both a poll based estimate of the Electoral College and a numbers based look at the Delegate Races. All of the charts and graphs seen in this post are from that site. Additional graphs, charts and raw data can be found there. Follow @ElectionGraphs on Twitter or like Election Graphs on Facebook to see announcements of updates or to join the conversation. For those interested in individual general election poll updates, follow @ElecCollPolls on Twitter for all the polls as they are added. If you find the information in these posts interesting or useful, please consider visiting the tip jar.