Since the last update, which was only a day ago, new poll data was added for Florida, Colorado, Wisconsin, North Carolina, Maine (at large and each congressional district), and Arkansas. The Colorado poll was much needed as it has been under polled. Arkansas and Maine as well. But only the Florida poll made a difference. Specifically, the polls in question actually covered a timeframe from earlier in the month, so the last couple weeks of the charts are modified.
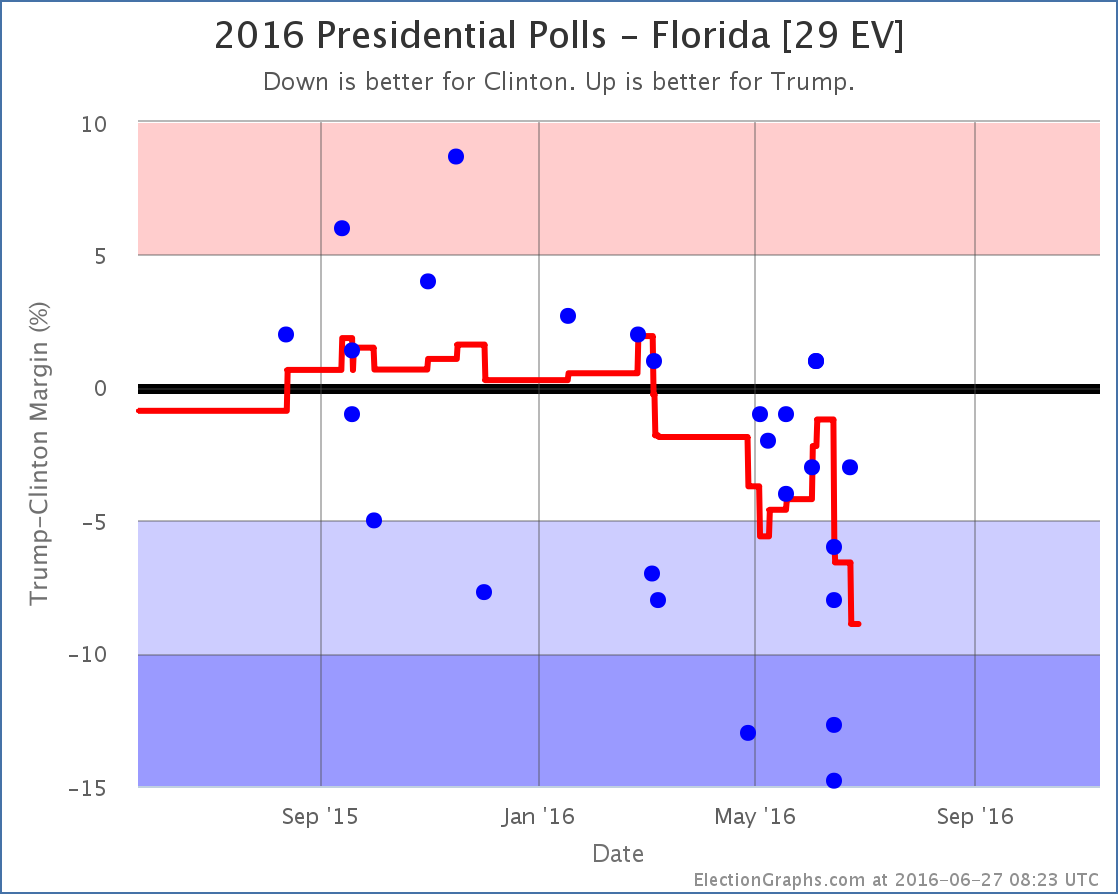
The poll average in Florida now only covers two weeks of polling. We are definitely in the general election season.
The last two weeks of polls have not been kind to Trump in Florida. With this update earlier polls showing Florida close fall off the calculation and so the average drops rapidly. The two worst results for Trump in the current average were the ones added in this update. They are from Saint Leo University (one including Johnson as an option and one without). These are the 1st and 3rd worst numbers Trump has ever had in Florida. They may prove to be outliers. We’ll see what the next polls bring.
For the moment though, Clinton’s lead in Florida grows to 8.9%. This is a rapid drop and takes Florida from “Weak Clinton” to “Strong Clinton”. So we take Florida out of the list of potential Trump states in his best case.
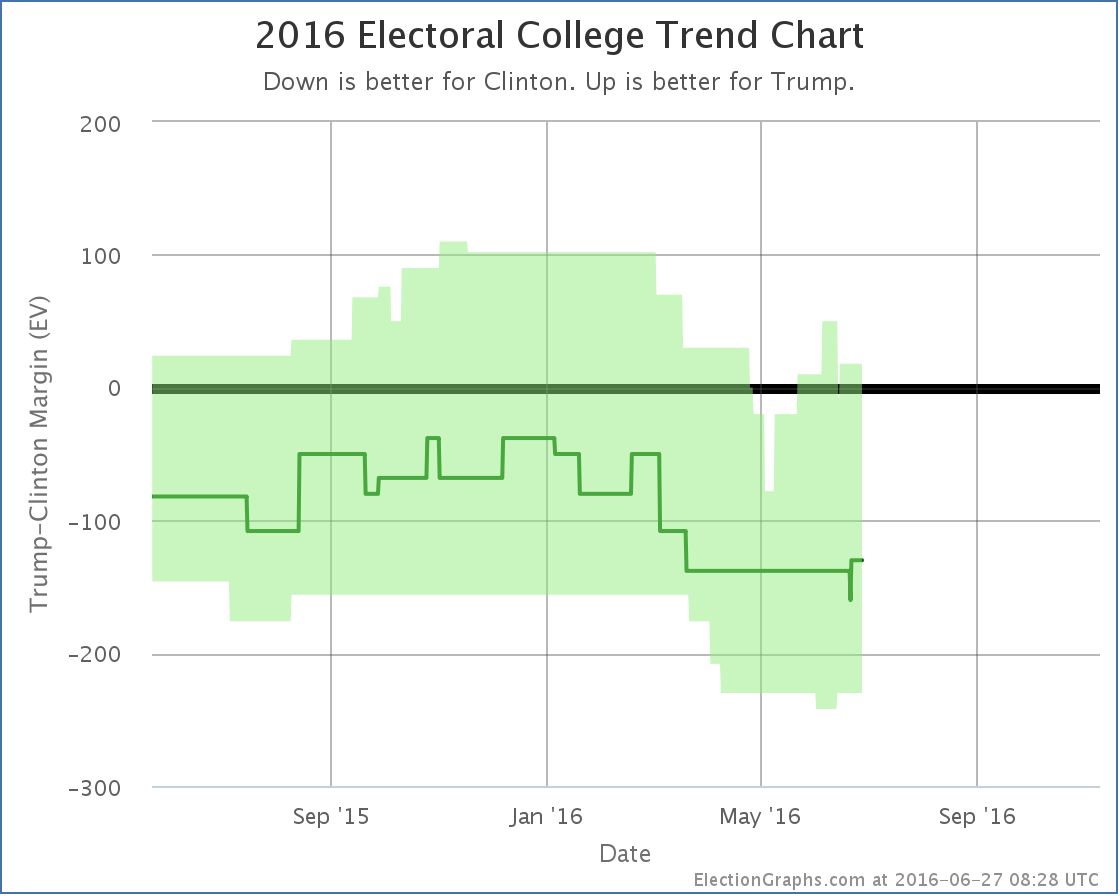
As mentioned, the timeframes covered by the Florida polls that were just added and which caused the change are older… June 10-16.. so the drop in the best case from Florida actually gets inserted before the bump up caused by Trump getting closer in Virginia. So the chart now actually shows a huge drop due to Florida, then a day later the bump up caused by Virginia.
With this update Trump’s best case dropped from a 76 electoral vote win to a 18 electoral vote win, but that 78 vote win is actually wiped off the chart entirely since the Florida change actually happened before the Virginia one.
Since Florida was the tipping point state, the tipping point also moves:
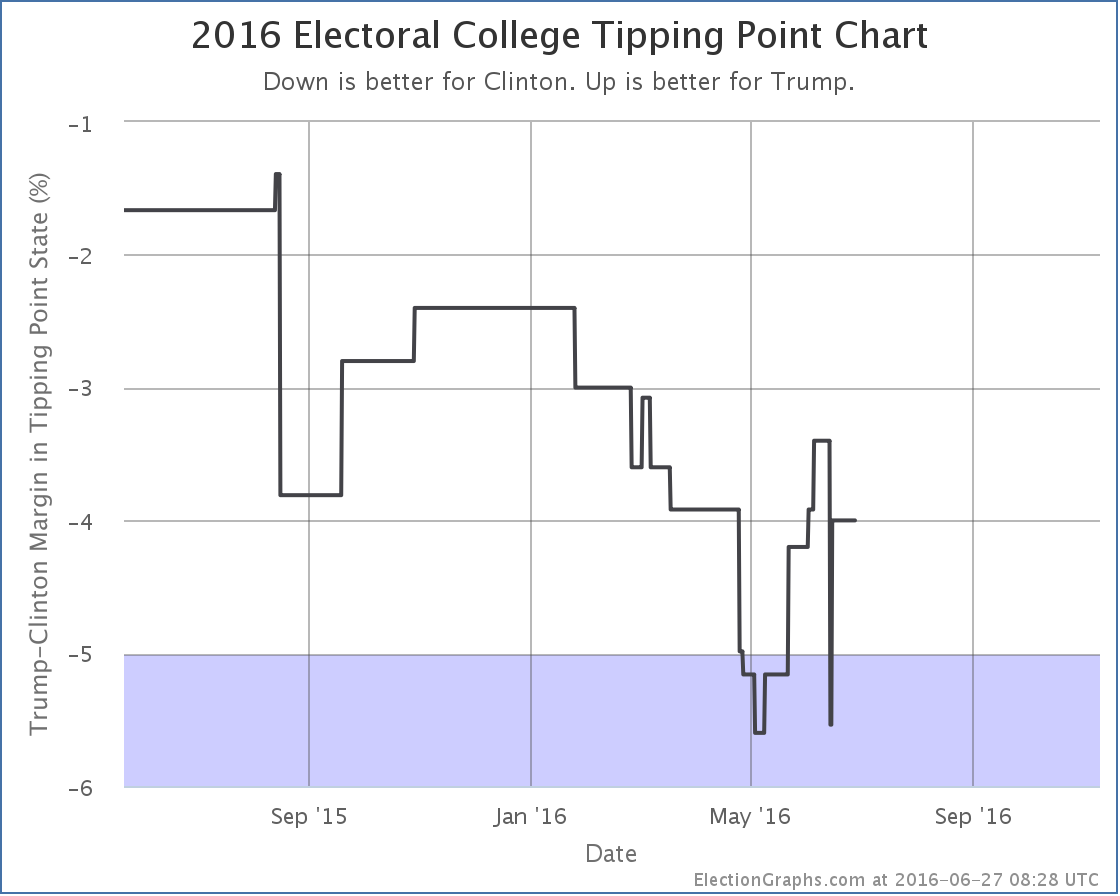
As with Trump’s best case, the tipping point now shows a big drop from Florida, then a gain a day later when Virginia moved in the opposite direction. In the end this update causes the tipping point to move from Clinton by 3.0% in Florida to Clinton by 4.0% in Ohio. And once again that previous peak is just wiped off the chart because the Florida change happened before Virginia.
Just yesterday I noted that when looking over a two month time horizon 3 out of the 4 metrics Election Graphs tracks have moved in Trump’s direction, and the fourth was flat. This is still true today, and it is even true if you only look at a one month time horizon, but without Florida those gains are lessened significantly.
With today’s updates however, you can now start to see some movement away from Trump in the last two to three weeks. We will not know for a while yet though if this is the start of a larger trend toward Clinton, or if Trump will bounce back.
Without Florida in play, to win Trump has to almost sweep the states where Clinton leads by less than 5%… Arizona, Pennsylvania, Iowa, Virginia, Nevada and Ohio… he can afford to lose one of the small 6 EV states (Iowa and Nevada)… as well as holding all the states where he has only a narrow lead. That is a tall order given current polling.
134.3 days until polls start to close on Election 2016.
Note: This post is an update based on the data on ElectionGraphs.com. Election Graphs tracks both a poll based estimate of the Electoral College and a numbers based look at the Delegate Races. All of the charts and graphs seen in this post are from that site. Additional graphs, charts and raw data can be found there. Follow @ElectionGraphs on Twitter or like Election Graphs on Facebook to see announcements of updates or to join the conversation. For those interested in individual general election poll updates, follow @ElecCollPolls on Twitter for all the polls as they are added. If you find the information in these posts interesting or useful, please consider visiting the tip jar.
Edit 17:40 UTC to add “Without Florida in play…” paragraph near the end.
Edit 18:55 UTC to acknowledge that Trump could actually afford to lose one of the 6 EV states.