States with new poll data since the last update: Florida, Michigan, Arizona, North Carolina
In the last update, Clinton’s lead in Florida moved to more than 5% and therefore winning Florida was taken out of Trump’s best case. At the time, I said: “Now, a couple of the data points here look like they might end up being outliers. If so, expect the average to bounce back a bit in Trump’s direction as new polls come out.” That has indeed already happened…
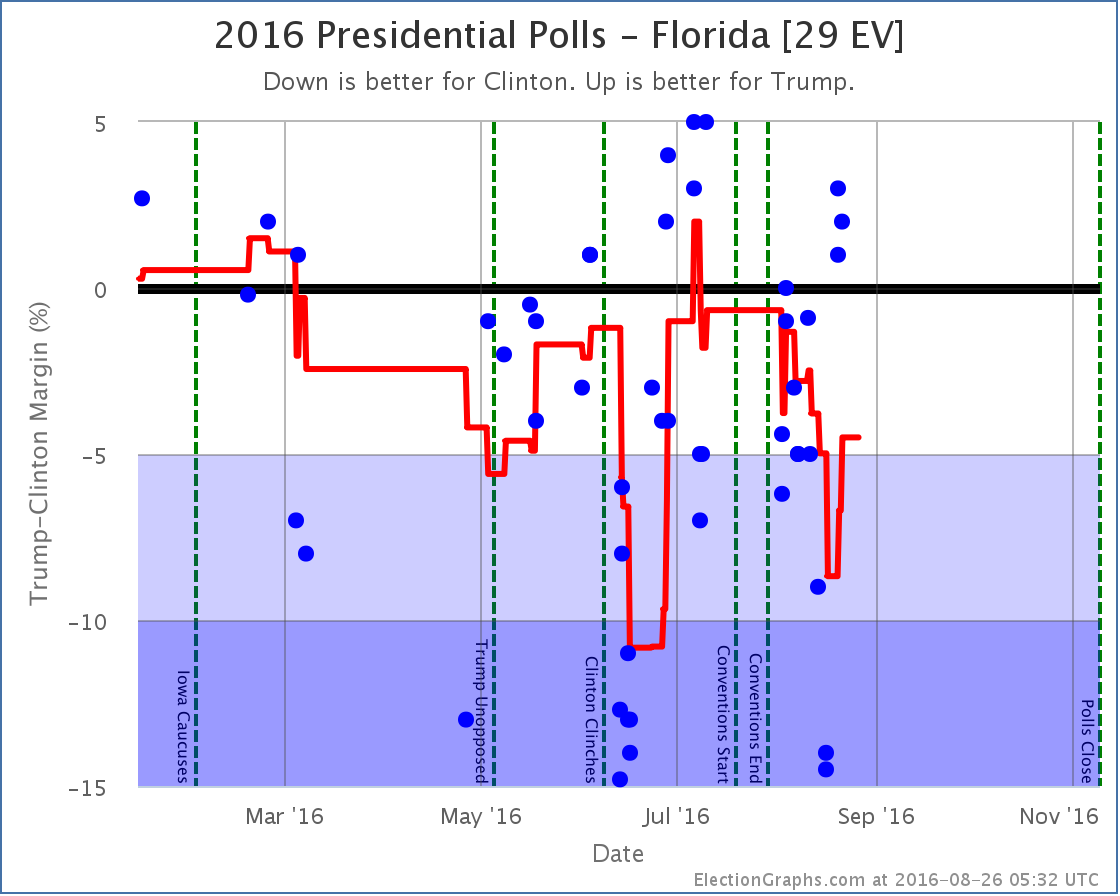
After several polls showing Clinton with a very strong lead, the last few results have shown Trump with a narrow lead. So the average bounces back toward Trump. On balance, Clinton still leads, but now only by 4.5%. Since this is under 5% Florida once again looks like a possible Trump pick up and is included in Trump’s best case:
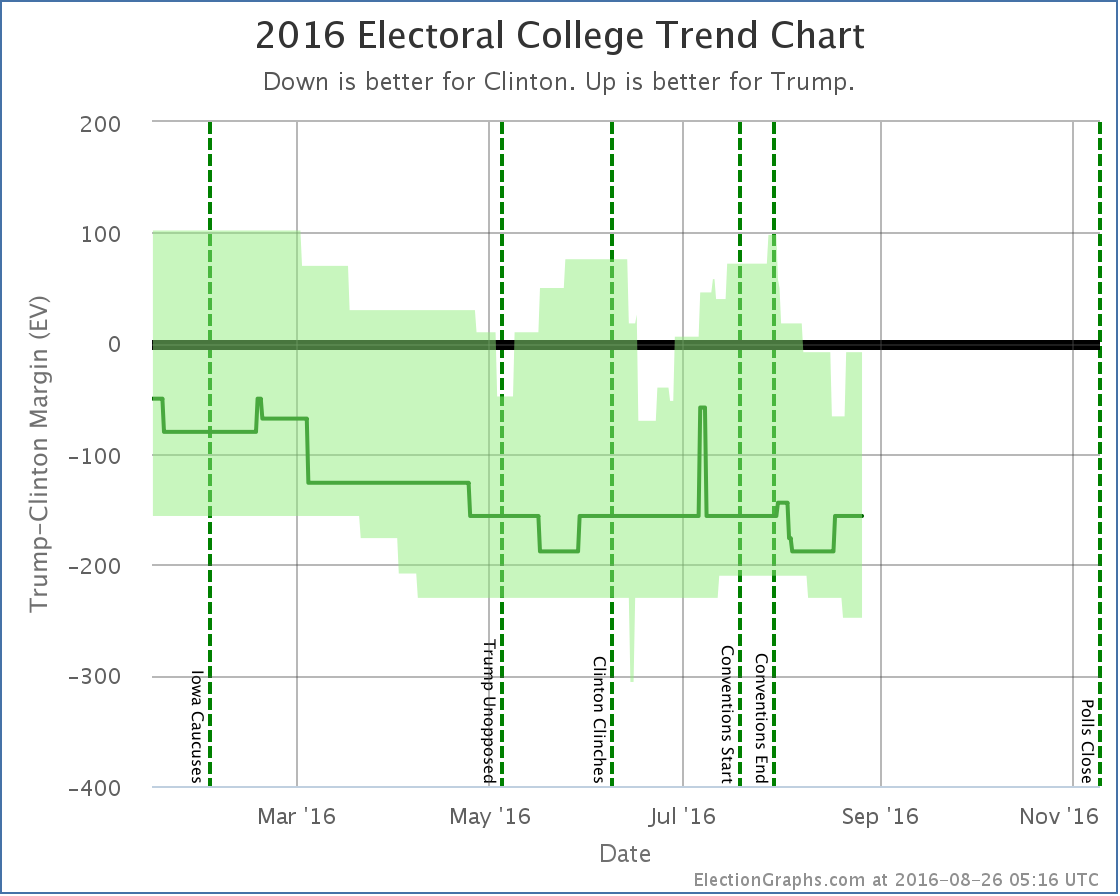
Trump’s best case is still too lose, but with Florida in the mix it is a lot closer. If Trump wins all the states he is ahead in, plus all the states where he is close, he now loses by only 8 electoral votes.
Since Florida was the tipping point, that metric also moves:
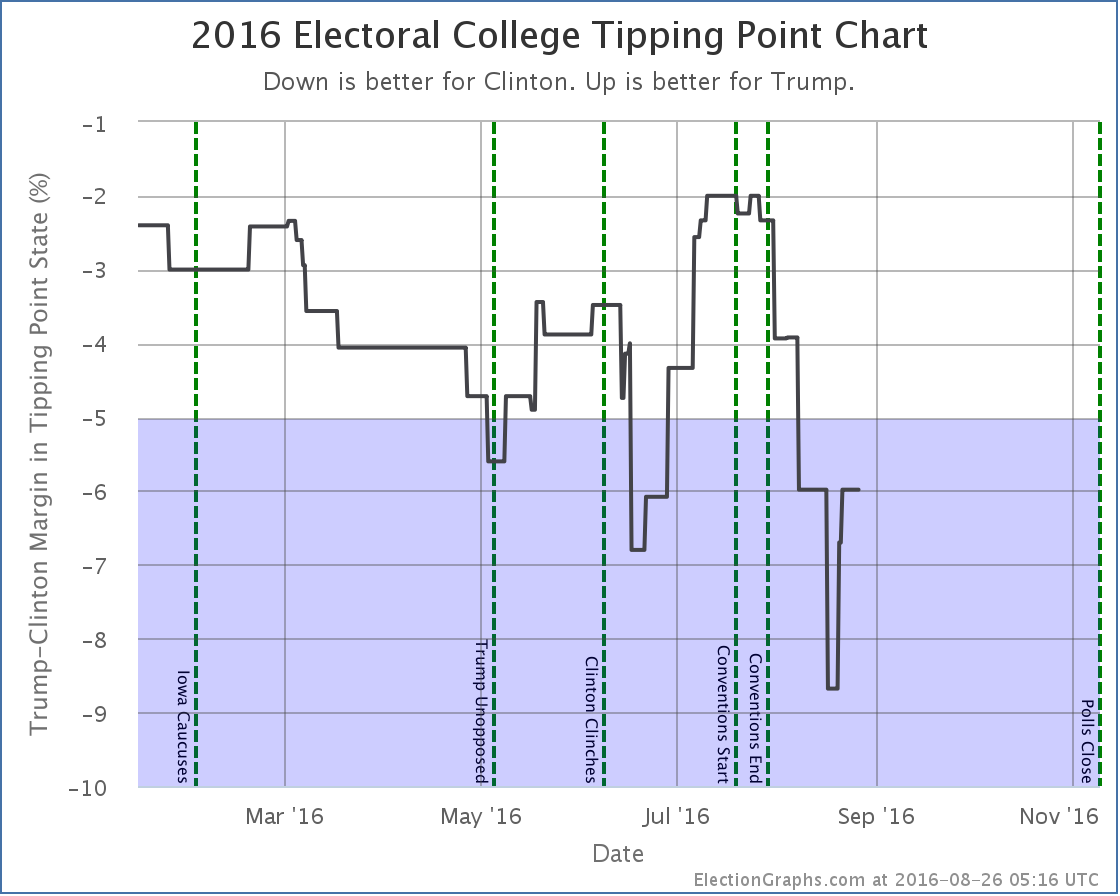
The tipping point is now back at a 6.0% Clinton lead in Connecticut, back where it was a couple weeks ago.
So does this mean Trump is bouncing back? We have had a couple of moves toward Trump in the last couple weeks… but we have had even more moves toward Clinton. It is too early to call a bottom for Trump and say he is on his way back. As usual, we need to keep watching.
74.4 days left until polls start to close.
Notice on Methodology: In my August 13th update I solicited opinions on possibly changing how this site deals with the case when a pollster releases multiple results from a single poll. See the discussion in that comment thread for more details. This weekend I will be working to change the site logic so that if two results are released from a poll, each counts as only half a poll for purposes of the averages here. As an example of the impact that would have: With the current method Florida shows a 4.5% Clinton lead. With the proposed new method Florida would show a 4.8% Clinton lead. Both would be “Weak Clinton”.
Note: This post is an update based on the data on ElectionGraphs.com. Election Graphs tracks both a poll based estimate of the Electoral College and a numbers based look at the Delegate Races. All of the charts and graphs seen in this post are from that site. Additional graphs, charts and raw data can be found there. Follow @ElectionGraphs on Twitter or like Election Graphs on Facebook to see announcements of updates or to join the conversation. For those interested in individual general election poll updates, follow @ElecCollPolls on Twitter for all the polls as they are added. If you find the information in these posts interesting or useful, please consider visiting the tip jar.