States with new poll data since the last update: Ohio, Iowa, South Carolina, North Carolina, Virginia, Utah, Missouri, Florida, New Mexico
More bad news for Trump, this time from Florida and South Carolina:
Florida
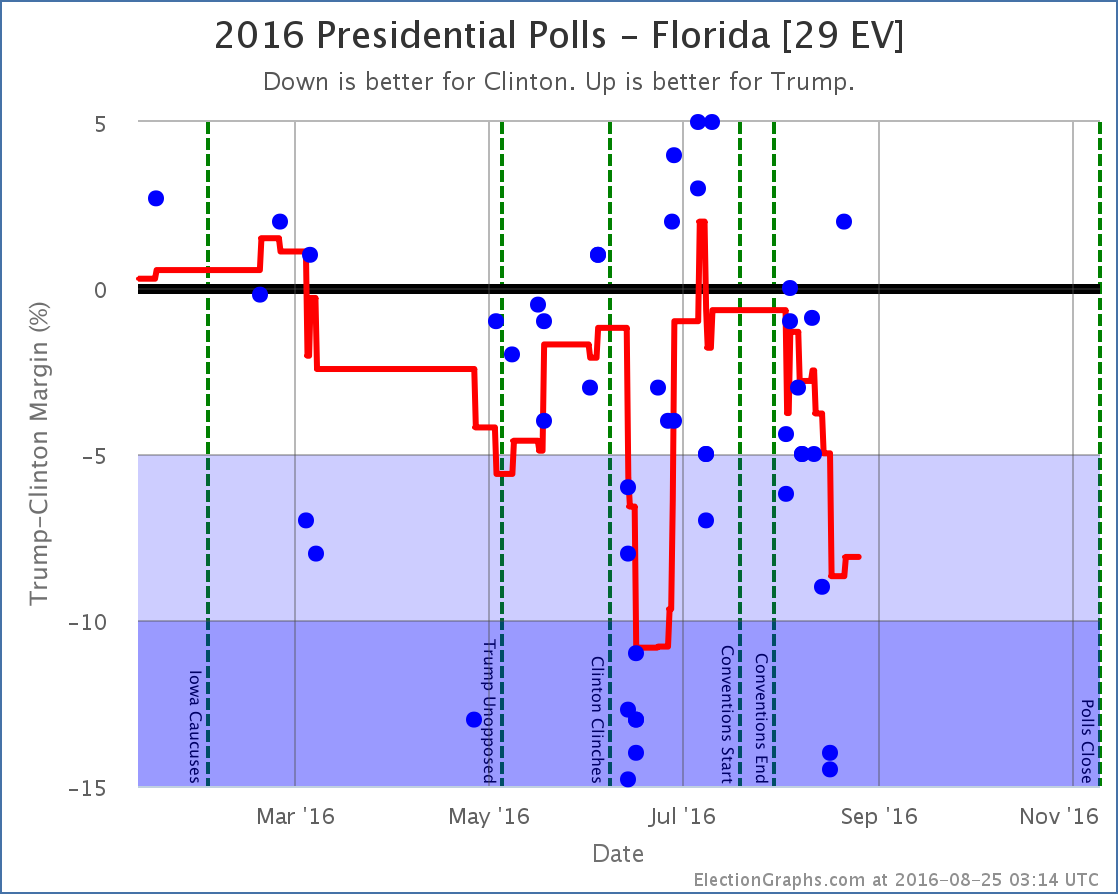
As has been somewhat the normal state of things in Florida, there is a huge range of poll results. At the moment the Election Graphs average includes results from Clinton leading by 14.5% to Trump leading by 2%. But on average, the polls have been trending toward Clinton, and with the latest additions, Clinton’s lead increases to 8.1%. Now, a couple of the data points here look like they might end up being outliers. If so, expect the average to bounce back a bit in Trump’s direction as new polls come out.
For the moment though, Clinton’s lead is big enough that Florida is no longer looking like a possible pickup for Trump. And Florida is part of almost any winning scenario for Trump. Without Florida a path to the White House is almost impossible.
South Carolina
Meanwhile, Trump is also slipping in South Carolina:
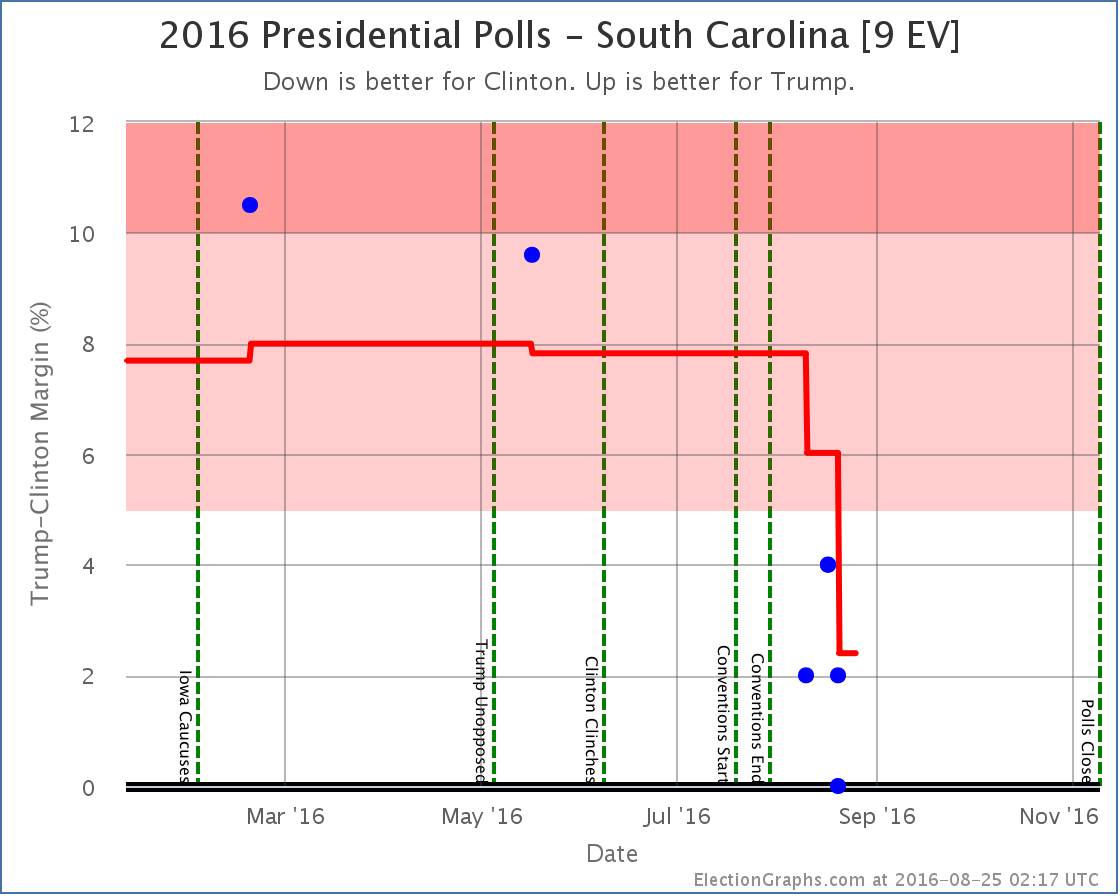
South Carolina hadn’t been polled much, but prior to the conventions the average there was a 7.8% Trump lead. Every poll since the conventions has shown Trump with a much narrower lead though. To be sure, there has not yet been any poll showing Clinton ahead in South Carolina. But the poll average drops to a 2.4% Trump lead. Narrow enough that Clinton stealing it has to be allowed as a possibility.
National View
With Florida no longer in play for Trump, and South Carolina now in play for Clinton, the “bubble” now looks like this:
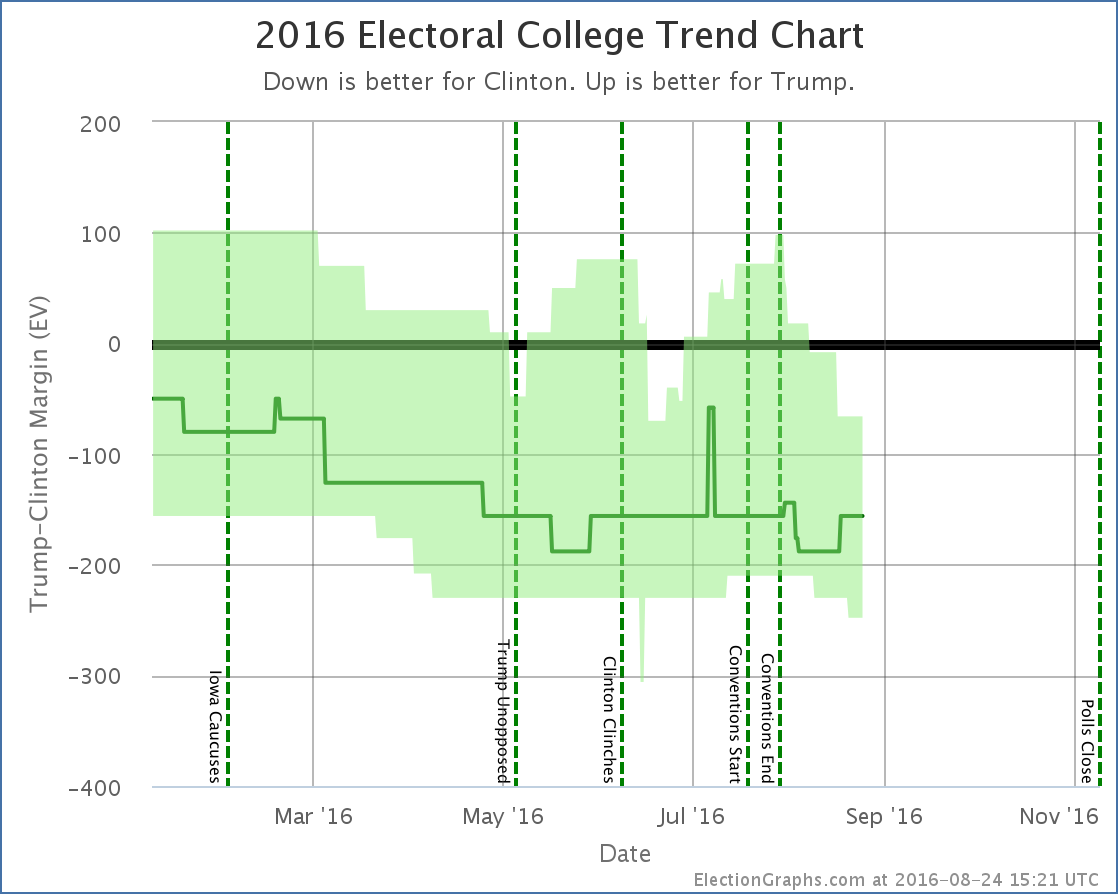
Trump’s best case is now almost as bad as it was back in June. Clinton’s best case is now the best it has been aside from those two days in June when Texas looked close.
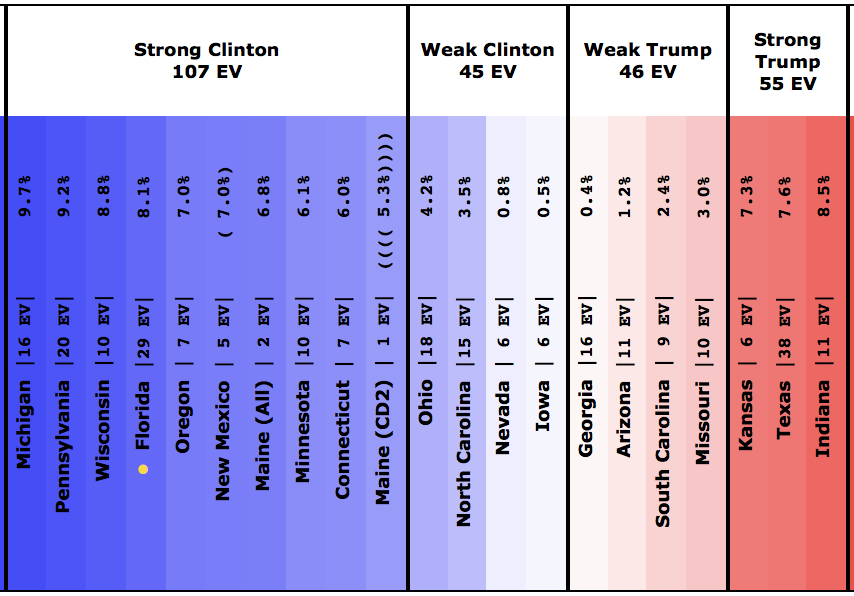
The most dramatic change however has been in the tipping point. With Clinton’s lead in Florida increasing dramatically, the tipping point moved from a 6.0% Clinton lead in Connecticut to an 8.1% Clinton lead in Florida:
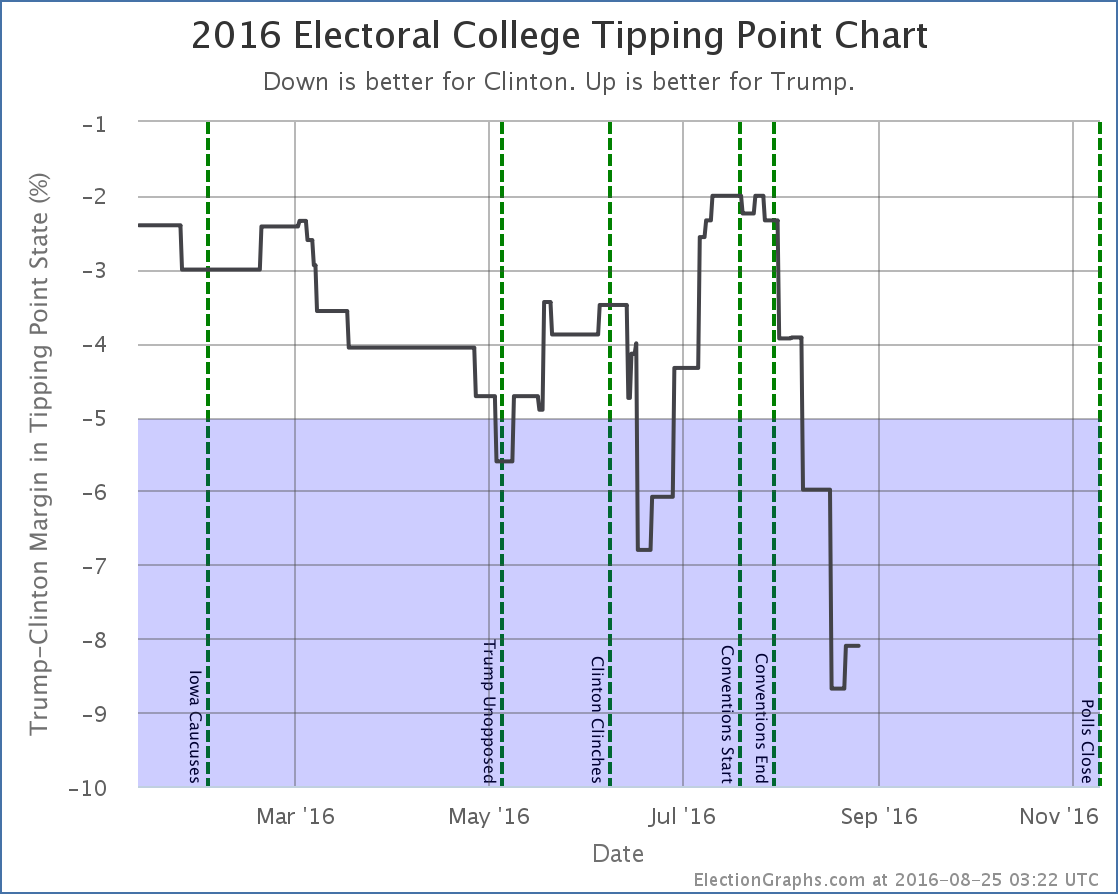
There were actually two Florida polls in today’s update, the second one was more favorable to Trump, so you see above that the tipping point actually dipped down as far as a 8.7% Clinton lead before bouncing back to 8.1%.
The tipping point can be thought of as how much the polls in every state would have to move (if they all moved together) to flip the winner of the race. It is essentially the equivalent of looking at the national popular vote margin, but adjusted to take into account the structure of the electoral college. The downward trend here is brutal for Trump.
The center of the spectrum of states now looks like this:
And the overall summary like this:
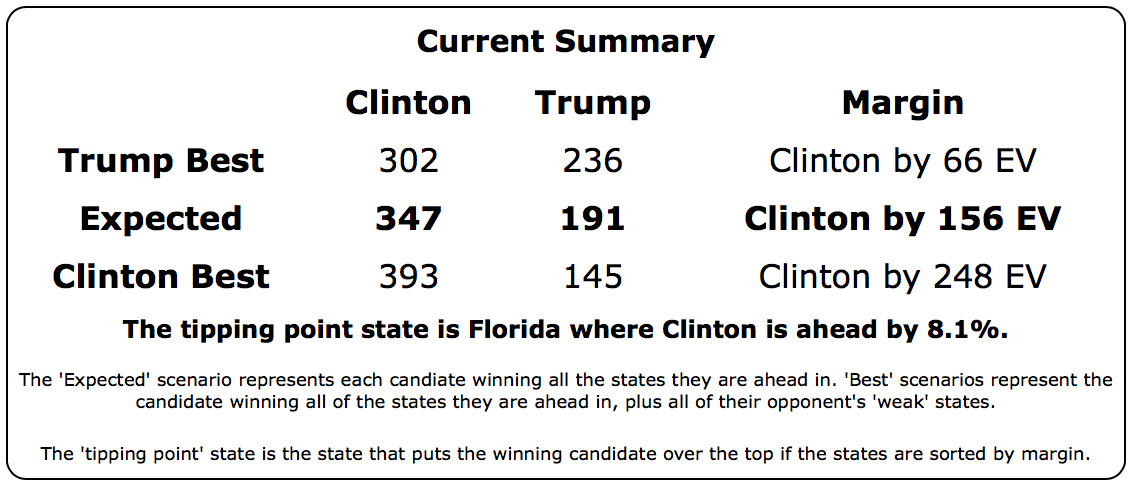
Even if you give Trump all of the close states, he still loses by 66 electoral votes.
Trump is currently losing, and losing badly. Even if he managed movement along the lines of what he saw from mid-June until the conventions, it would only get him back to having a narrow win in his best case scenario. He would still have quite some way to go in order to actually lead.
Things do happen in campaigns, but a comeback from this far behind would take an absolutely seismic change in how this campaign is going… and there are only 75.7 days left.
Notice on Methodology: In my August 13th update I solicited opinions on possibly changing how this site deals with the case when a pollster releases multiple results from a single poll. See the discussion in that comment thread for more details. I’ve concluded that I do want to make a change to re-weight those cases, so that if two results are released from a poll, each counts as only half a poll for purposes of the averages here. I am going to try to adjust the site this coming weekend to make this change. Although the overall picture will remain similar, some states will “jiggle”. For instance, with the current method the average in South Carolina is a 2.4% Trump lead. The drop to that level was one of the items highlighted in today’s post. But the five poll average includes 2 results from a Feldman poll and 2 from a Gravis poll. If the average was calculated in the proposed new way South Carolina would show a 5.4% Trump lead. So it would move back to being “Strong Trump” rather than “Weak Trump” because there would be less weight on the post-convention polls showing a close race, and two additional older polls showing a strong Trump lead would be included in the average. If all goes well, I’ll make a post about the new methodology and any resulting changes to the classifications of the states and such after the surgery on the site is complete. If my changes fail, I’ll roll things back and try again another weekend. :-)
Note: This post is an update based on the data on ElectionGraphs.com. Election Graphs tracks both a poll based estimate of the Electoral College and a numbers based look at the Delegate Races. All of the charts and graphs seen in this post are from that site. Additional graphs, charts and raw data can be found there. Follow @ElectionGraphs on Twitter or like Election Graphs on Facebook to see announcements of updates or to join the conversation. For those interested in individual general election poll updates, follow @ElecCollPolls on Twitter for all the polls as they are added. If you find the information in these posts interesting or useful, please consider visiting the tip jar.
[Blog Post] Electoral College: Florida says goodbye to Trump, Clinton says hello to South Carolina https://t.co/vXhmEgZwRB
RT @ElectionGraphs: [Blog Post] Electoral College: Florida says goodbye to Trump, Clinton says hello to South Carolina https://t.co/vXhmEgZ…
Robert May liked this on Facebook.
Was hoping you’d still make the methodology change this election. Excited to see how it will turn out. :)
William Geach liked this on Facebook.
@DAK: I’m very interested to see exactly what will change as well! I had hoped to start work on the changes Friday night, but an extra big set of poll updates kept me from that. Goal is to start work on the changes Sunday morning after I do the blog post covering the changes from the last set of polls I added. Hoping to finish the surgery on the site in one day, but it is possible it will take me longer to get everything in place. At this point I won’t add any more new polls until after the changes are done. (Unless I utterly fail and have to try again another weekend. :-) )