Yesterday SurveyUSA put out head to head poll results for Obama vs McCain in all 50 states. (They did the same for Clinton vs McCain, but I’ll worry about that when/if she takes the delegate lead.) This means we now have polls for everything… except the District of Columbia, where SurveyUSA didn’t bother. Now, I think we all know that DC is about the safest 3 electoral votes the Democrats have, but I’m going to leave it in the “no polls” category until there is actually a poll.
Anyway, my end results differ somewhat from SurveyUSA’s because there are a number of states where I had previous poll results and I average the last few of those (up to five) into my results as well. In general this hurt Obama. SurveyUSA makes the race out with Obama winning 280 to 258 (they go ahead and give Obama DC’s 3 electoral votes). This includes of course some VERY weak states well within the margin of error.
In any case, my chart comes out a bit different when some of the other polls on some of these states are taken into account. The states where I differ from SurveyUSA are Minnesota, New Mexico, Ohio and Virginia. In all four cases SurveyUSA gives them to Obama, but when the earlier poll results get factored in, they slip over to McCain. That is 48 electoral votes moving from one side to another and so of course makes a huge difference.
I won’t itemize all the results in all the states here, those who are interested can look at the wiki page.
End result after tons of new states and updates to all the states where I already had polls…
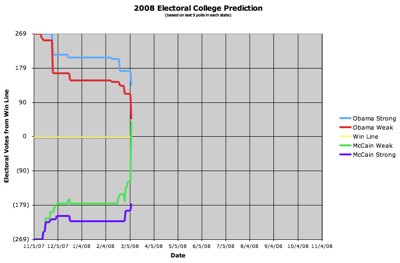
McCain wins 308 to 227. (DC’s 3 votes not included, but would not matter.)
The breakdown:
- Strong McCain: 93 Electoral Votes
- Weak McCain: 215 Electoral Votes
- No Polls: 3 Electoral Votes
- Weak Obama: 88 Electoral Votes
- Strong Obama: 139 Electoral Votes
Note the HUGE number of electoral votes in the “weak” categories for both candidates. For these charts weak means their lead in the state is less than 10% based on my running average of polls. One thing this makes clear to me is the answer to the question I posed in my February 29th update. Namely it would be very helpful to break down this “weak” grouping into the less than 5% lead and the 5% to 10% group.
I still think that given what we’ve seen so far this year, even a 9% lead really is a pretty weak lead and can evaporate in less than a week if the right things happen. However, it will still be useful to map out what the “really weak” states are on both sides, which will probably become the real battlegrounds.
I guess I’ll take a look at doing that breakdown this weekend.
Leave a Reply
You must be logged in to post a comment.