First of all, a little bookkeeping. With the latest batch of polls, the “five best polled candidate combinations” gets shuffled up a bit. Clinton vs Huckabee falls off the top five (bye Huck!), replaced by Clinton vs Walker. Meanwhile, Clinton vs Rubio moves into the “best polled” slot, becoming the default view on the election2016.abulsme.com site. So, for the moment, that means the candidate combinations I’ll talk about in these updates are Clinton vs Rubio, Paul, Bush, Walker and Christie. Huckabee honestly is very close behind in the #6 spot. After that though there is a pretty big gap in polling before we get to the next combinations. There may be lots of talk about Trump lately. Or of Biden or Sanders as Clinton alternatives. Or of the other ELEVEN Republican candidates. But in comparison to the combinations I mentioned earlier, state level polling involving those folks is still pretty sparse. We’ll talk about the rest of the candidates if and when there is good enough polling on them to get them into the top five. Or at least close.
OK, with that out of the way, the main news from the latest polls. Specifically, with a WMUR poll in New Hampshire added in, this happened:
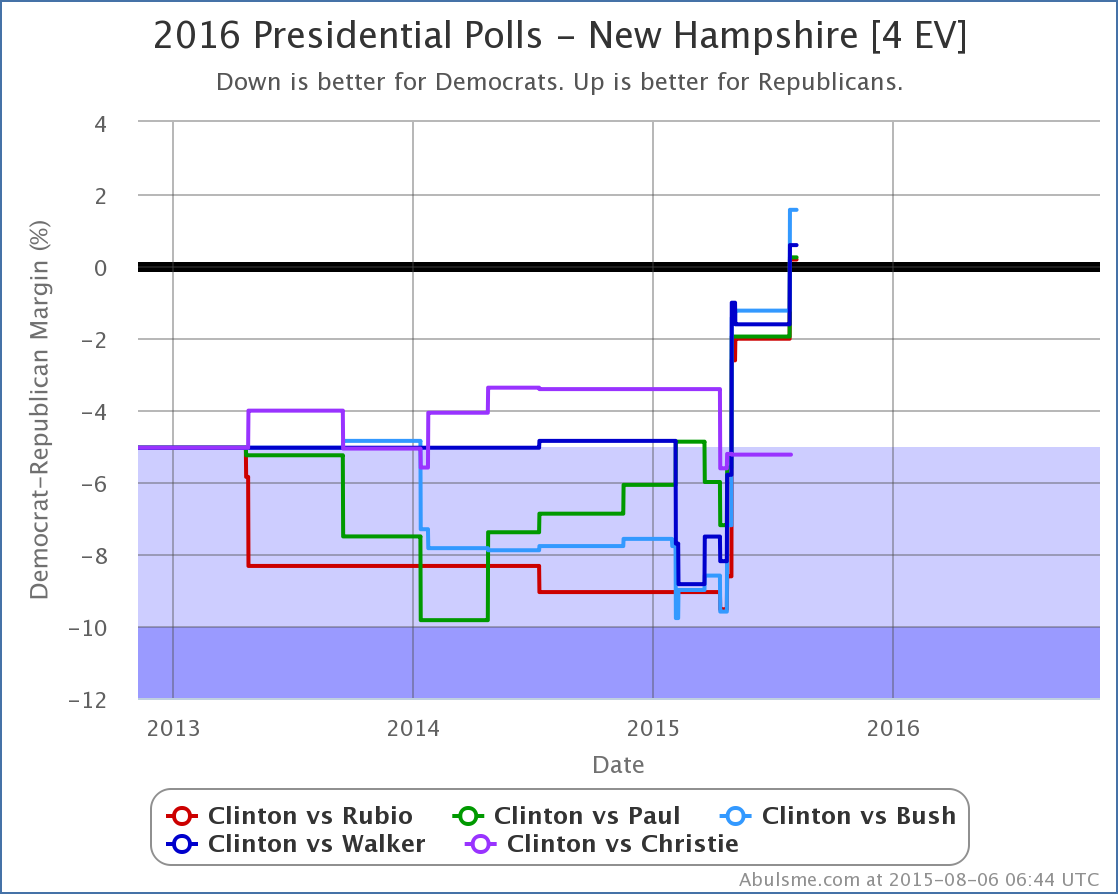
Rubio, Paul, Bush, and Walker all took the lead in New Hampshire as measured by my poll average. Just barely. But still. They are now in the lead. Christie wasn’t polled this time, but was lagging the others quite a bit anyway.
Just a few months ago, New Hampshire was looking like it was pretty reliably “Strong Clinton” against almost all Republican challengers. (The exception being Christie amusingly enough, since he is now the weakest of the bunch.) This is a pretty big move. It seems to be parallel across many candidates, so it is likely this is more a case of Clinton getting weaker than anything any Republican candidate is doing specifically.
So what does New Hampshire flipping do to the “expected” results if the election was held today?
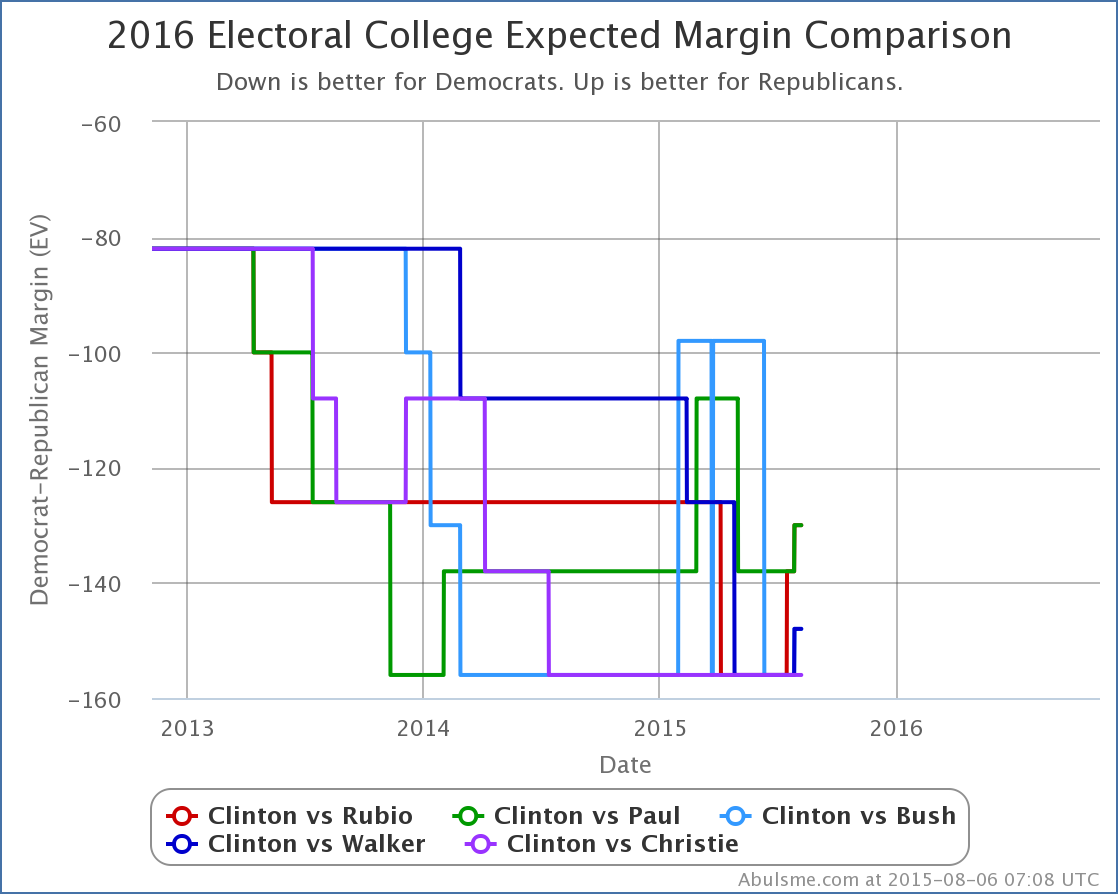
Well, OK, a couple bumps there at the end. Even with this though, this particular chart doesn’t show a clear trend. All the lines are bouncing around, but aren’t clearly trending in one direction or another.
But, looking more generally at my Electoral College updates, the last time I did one that was fully and unreservedly about something moving in Clinton’s direction was in May! From the end of May, through June, through July, and now into August, every update has been about Republican gains. (There were a couple Clinton gains in the mix, but there were always overshadowed by moves toward the Republicans that happened at the same time.)
Despite this, everything points to Clinton still being way ahead overall. As one example of this, even with New Hampshire, none of the five candidates on the chart above even match Romney’s performance in 2012. The best of the bunch in “expected result”, Rubio and Paul, still lose to Clinton by 130 electoral votes.
Clinton can’t be happy with the trend though. Yes, things are expected to tighten. But I’m sure she would prefer if they didn’t anyway!
We still have lots of time until the election. The first Republican debates are coming up later today. Obviously the main thing people will be watching for are how it may impact the standing of the various candidates in the Republican race, but Democrats and Independents are watching too, so don’t be surprised if there are effects on the general election matchup too.
And of course, this is just the beginning of debate season. Many more to come…
460.7 days until the first general election polls close.
Note: This post is an update based on the data on my 2016 Electoral College Analysis Site. All of the charts and graphs seen here are from that site. Graphs, charts and raw data can be found there for the race nationally and in each state for every candidate combination that has been polled at the state level. In addition, comparisons of the best polled candidate combinations both nationally and each in each state are available. All charts above are clickable to go to the current version of the detail page the chart is from, which may contain more up to date information than the snapshots on this page, which were current as of the time of this post. Follow @ElecCollPolls on Twitter for specific poll details as I add them.