This is the website of Abulsme Noibatno Itramne (also known as Sam Minter). Posts here are rare these days. For current stuff, follow me on Mastodon

Categories

Calendar

Republicans: Trump continues his march to 1237

With the final results all but inevitable, these updates will be somewhat mechanical absent something unexpected happening.

After Nebraska and West Virginia, Trump needed 22.57% of the remaining delegates to win.

In Oregon, Trump got 19 delegates, while Kasich picked up 5 and Cruz picked up 4, even though neither of them are actively running any more.

In other changes since Nebraska and West Virginia due to uncommitted delegate preference changes in Guam, finalization of the West Virginia results taking into account geographic restrictions, and an update from New York, there was a net change of Trump +6, Kasich +2, Cruz -1

So total change since Nebraska and West Virginia: Trump +25, Kasich +7, Cruz +3

So Trump actually got 71.43% of the delegates since Nebraska and West Virginia.

So while he didn’t completely sweep the delegates this week, he is still far ahead of the target pace he needs to get to 1237.
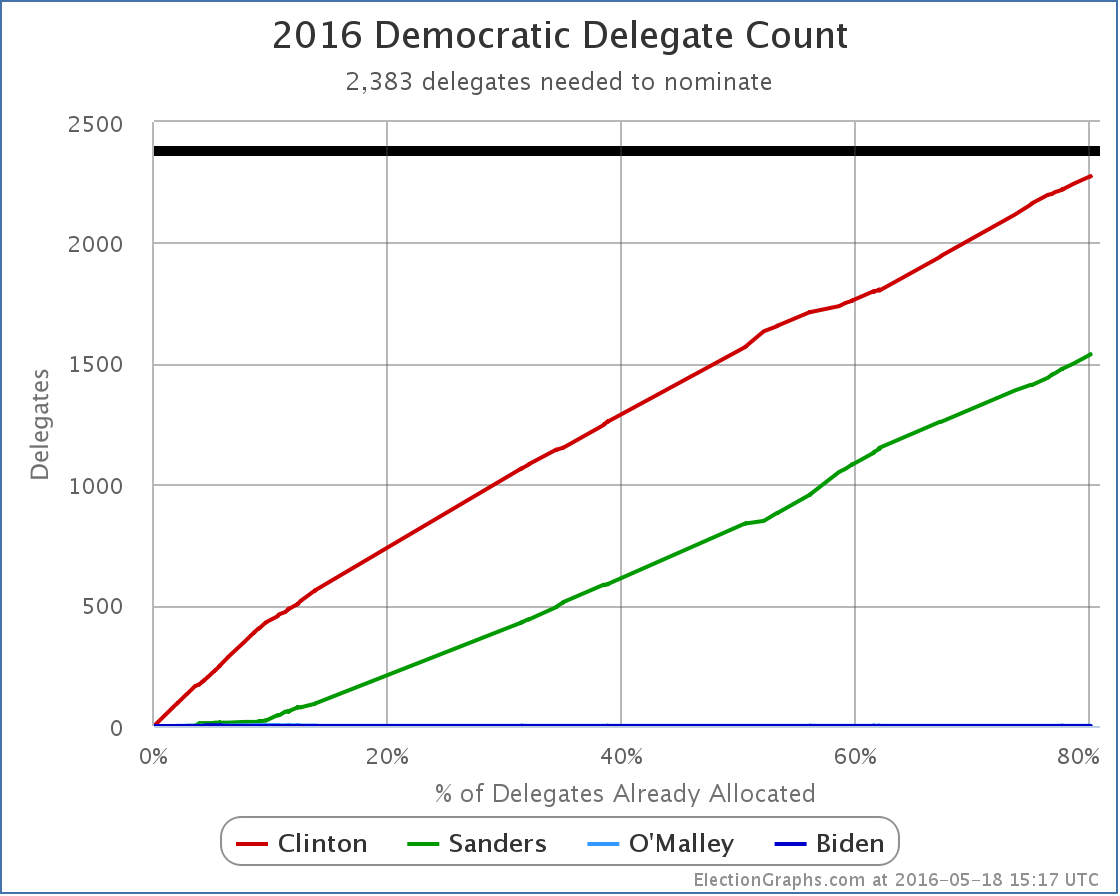
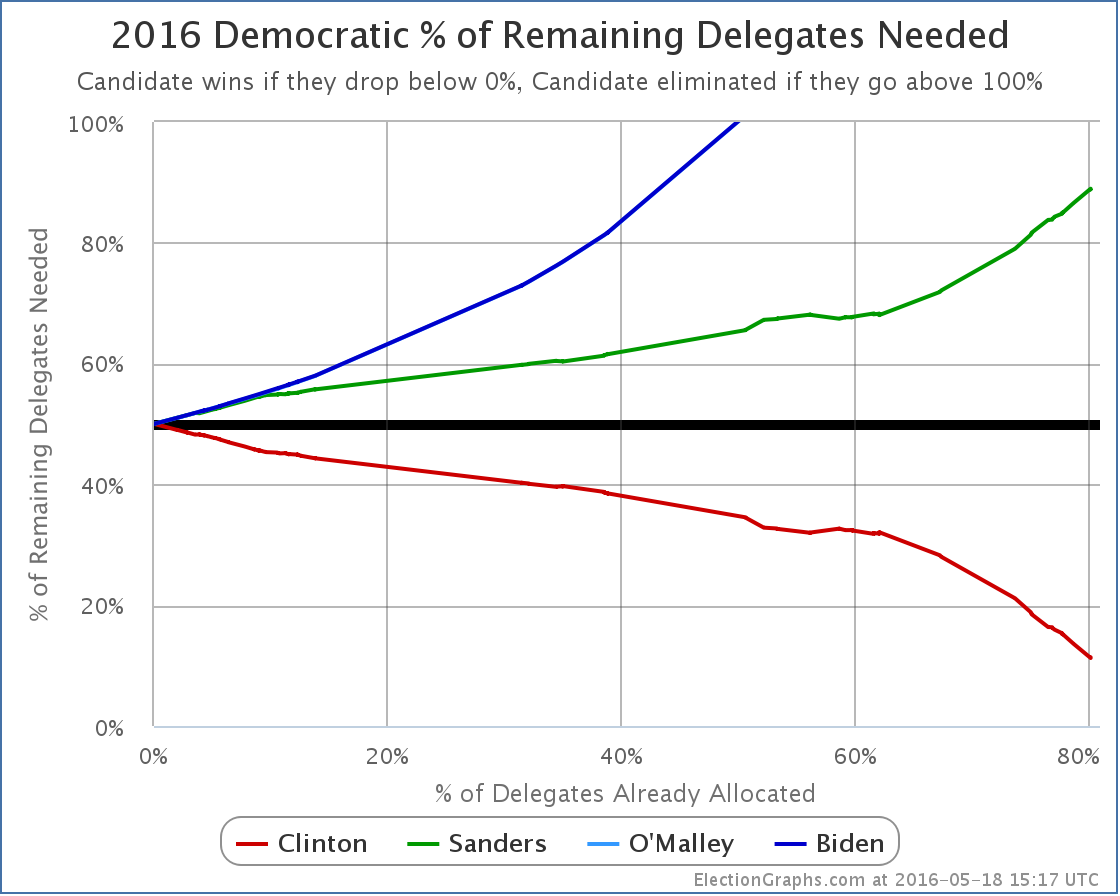
Updated graphs:

chart-143

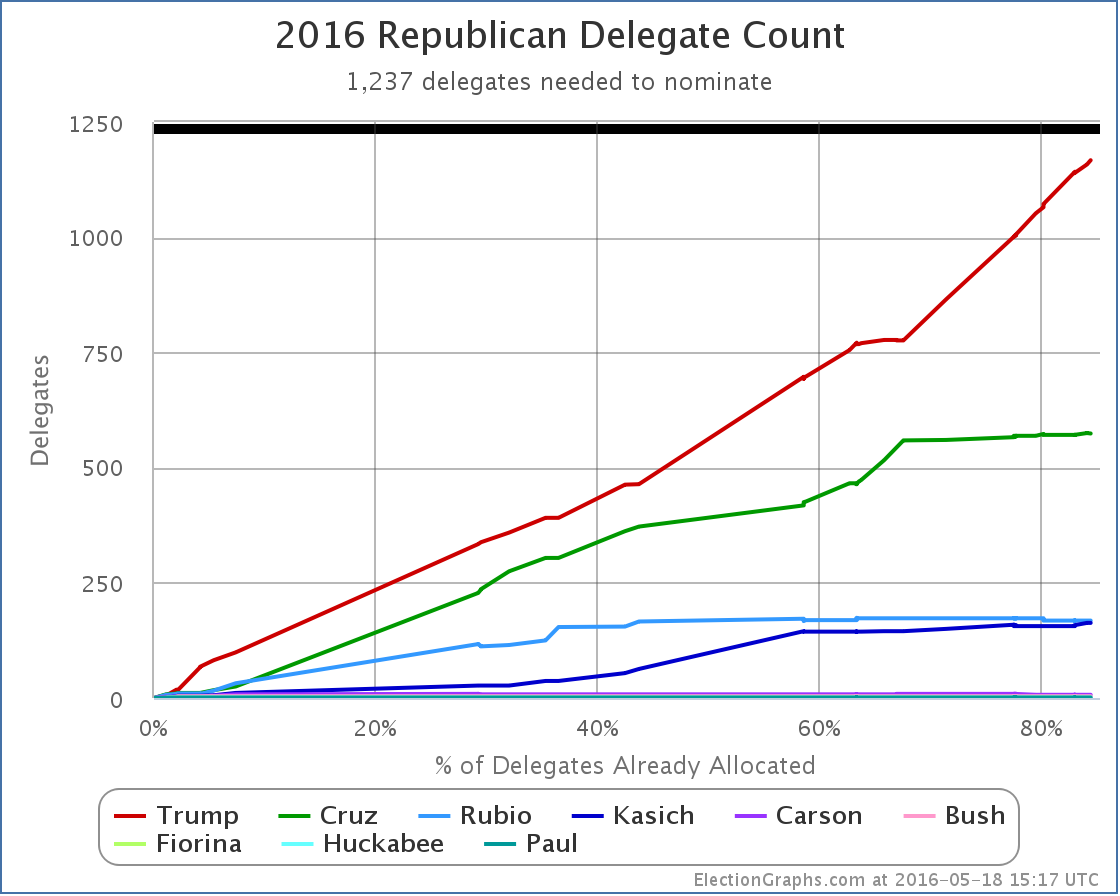
New delegate totals: Trump 1167, Cruz 574, Rubio 168, Kasich 163, Carson 7, Bush 4, Fiorina 1, Huckabee 1, Paul 1.

There are 386 delegates left. Trump needs 70 of them.

chart-144

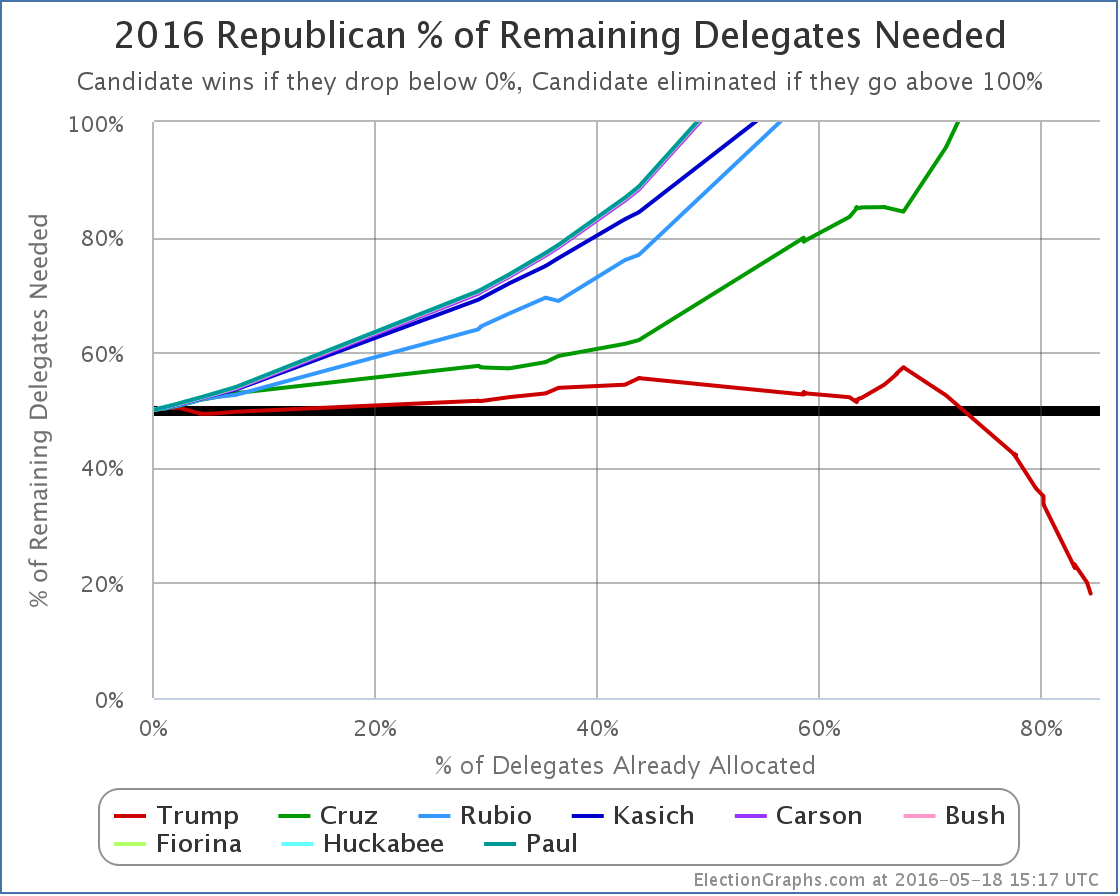
Trump now needs 18.13% of the remaining delegates to win.

Update 2016-05-22 16:12 UTC – Oregon update: Cruz +1, Kasich -1.

Update 2016-05-25 14:30 UTC – Virgin Islands update: Trump +7, Cruz -1, Rubio -2.

Note: This post is an update based on the data on ElectionGraphs.com. Election Graphs tracks both a poll based estimate of the Electoral College and a numbers based look at the Delegate Races. All of the charts and graphs seen in this post are from that site. Additional graphs, charts and raw data can be found there. All charts above are clickable to go to the current version of the detail page the chart is from, which may contain more up to date information than the snapshots on this page, which were current as of the time of this post. Follow @ElectionGraphs on Twitter or like Election Graphs on Facebook to see announcements of updates or to join the conversation. For those interested in individual general election poll updates, follow @ElecCollPolls on Twitter for all the polls as they are added.

Democrats: Sanders wins the 17th, but once again it doesn’t matter

With the final results all but inevitable, these updates will be somewhat mechanical absent something unexpected happening.

After West Virginia, Sanders needed 84.90% of the remaining delegates to win, Clinton only needed 15.29%.

In Oregon and Kentucky, Sanders got 62, Clinton got 54.

In other changes since West Virginia due to superdelegate updates, there was a net change of Clinton +1, Sanders -1.

So total change since West Virginia: Sanders +61, Clinton +55.

That is Sanders 52.59%, Clinton 47.41%.

So Clinton met her target, Sanders did not.

Updated graphs:

chart-141

New delegate totals: Clinton 2275, Sanders 1539, O’Malley 1.

There are 950 delegates left. Clinton needs 108 of them. Sanders needs 844 of them.

chart-142

Clinton now needs 11.37% of the remaining delegates to win. Sanders needs 88.84%.

Update 2016-05-20 16:33 UTC: Superdelegate scan – Clinton +2, Sanders +2.

Update 2016-05-25 02:26 UTC: Superdelegate scan – Clinton +3.

Update 2016-05-25 02:28 UTC: Change from Maryland – Sanders +1, Clinton -1.

Update 2016-05-27 17:05 UTC: Superdelegate scan – Clinton +7, Sanders +1.

Update 2016-05-30 16:06 UTC: Superdelegate scan – Clinton +4, Sanders -1.

Update 2016-06-03 14:20 UTC: Superdelegate scan – Clinton +4, Sanders +3

Update 2016-06-03 14:22 UTC: There was a one delegate adjustment from Clinton to Sanders in Oregon as results were finalized there. I also discovered one Sanders delegate in Michigan I was missing due to a math error on my part which is now fixed. Net change: Sanders +2, Clinton -1.

Update 2016-06-05 03:25 UTC: Superdelegate scan – Clinton -1

Note: This post is an update based on the data on ElectionGraphs.com. Election Graphs tracks both a poll based estimate of the Electoral College and a numbers based look at the Delegate Races. All of the charts and graphs seen in this post are from that site. Additional graphs, charts and raw data can be found there. All charts above are clickable to go to the current version of the detail page the chart is from, which may contain more up to date information than the snapshots on this page, which were current as of the time of this post. Follow @ElectionGraphs on Twitter or like Election Graphs on Facebook to see announcements of updates or to join the conversation. For those interested in individual general election poll updates, follow @ElecCollPolls on Twitter for all the polls as they are added.

Edit 2016-06-05 05:44 UTC: Corrected a couple details of the list of superdelegate updates to match my logs of the changes that were made. I’d missed logging a couple of the updates here on this post. Dated the updates to approximately when I made the changes.

@ElectionGraphs tweets from 2016-05-17 (UTC)

@abulsme tweets from 2016-05-17 (UTC)