This is the website of Abulsme Noibatno Itramne (also known as Sam Minter). Posts here are rare these days. For current stuff, follow me on Mastodon

Categories

Calendar

Republicans: Nothing but Trump

Trump won all 57 delegates in Indiana.

This was the last stand of the anti-Trumps. Cruz announced he was dropping out shortly after the state was called for Trump. Kasich is still in it, but hasn’t shown any delegate gathering ability that would indicate he could make a difference.

Even with a loss in Indiana, Trump would almost certainly have won in the end. That has been clear for a couple weeks now. But he didn’t lose Indiana, he shut everyone else out completely.

Trump hasn’t wrapped things up quite yet, he still has to collect a few more delegates. But something unexpected and dramatic would have to happen to stop him from getting there.

The Republican race is now in the same state as the Democratic race has been for awhile. The outcome is known, and we’re just watching the winner mop up the last few delegates they need.

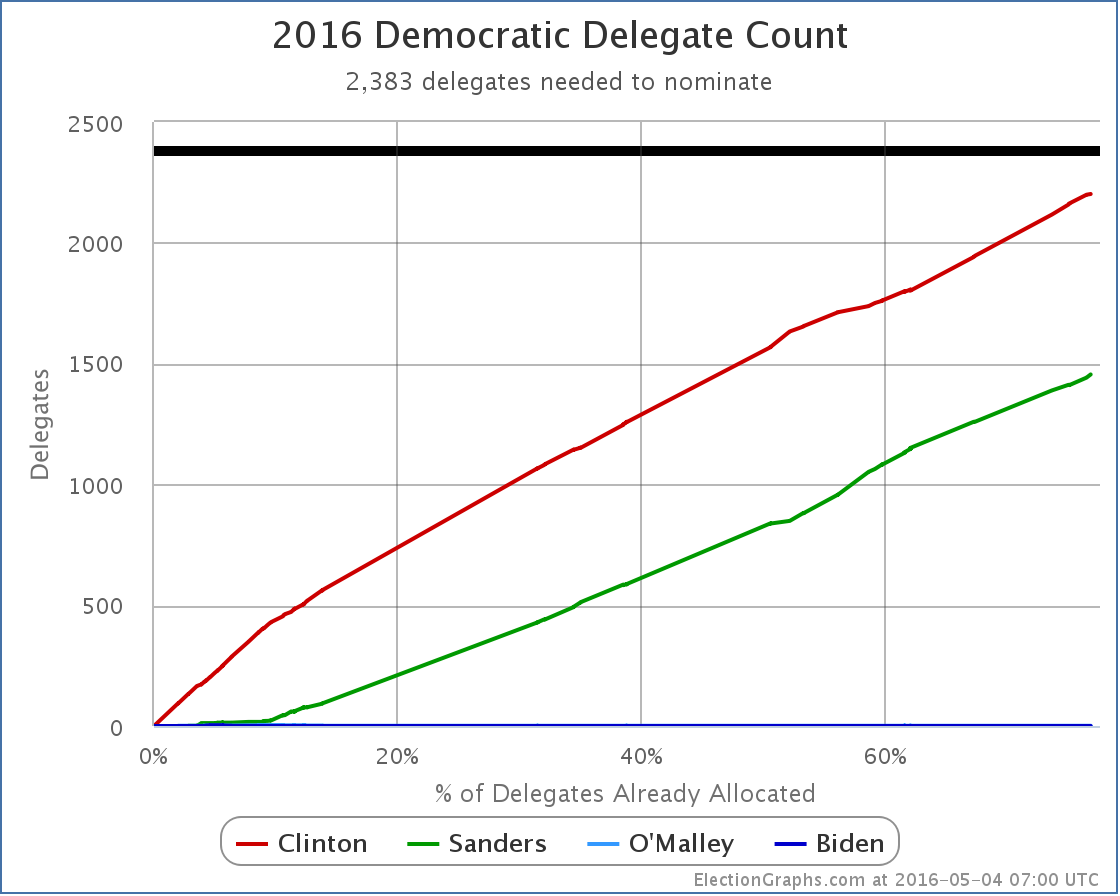
So time to look at the graphs:

chart-133

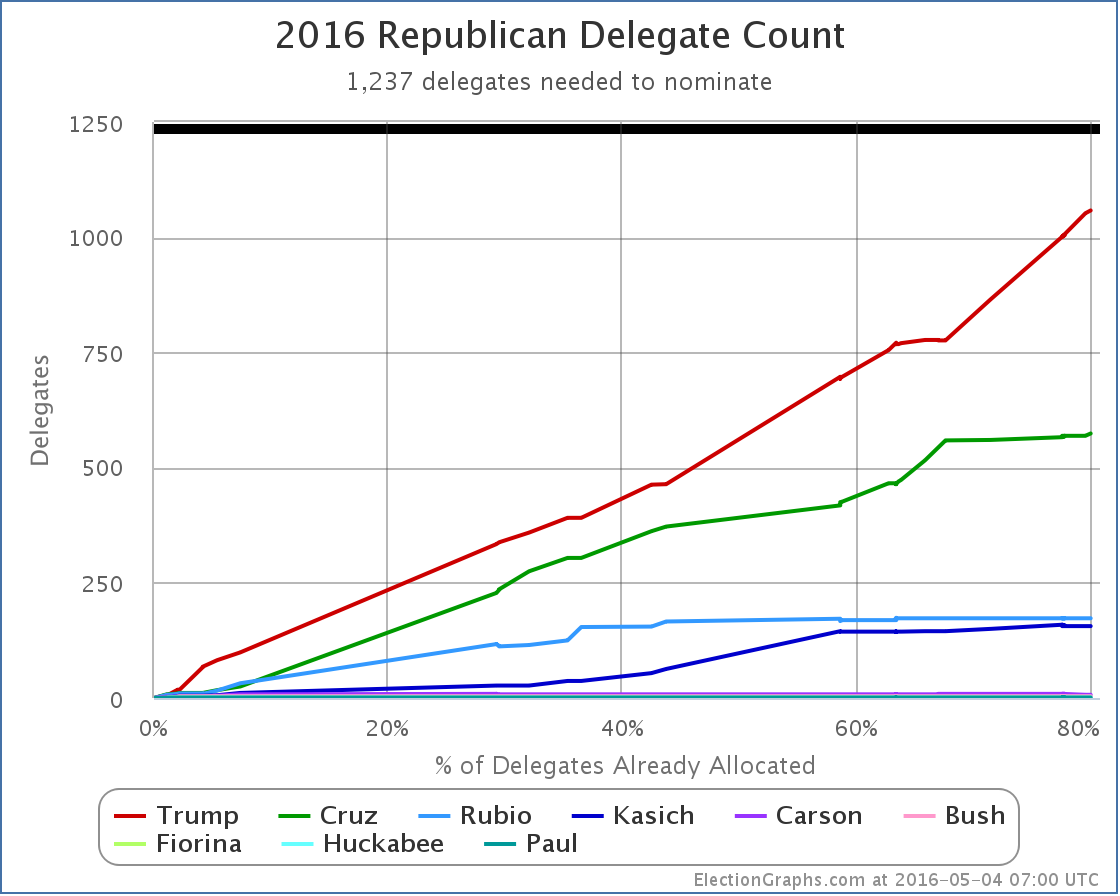
My best estimates of the delegate totals (including preferences of officially uncommitted delegates) is now:

Trump 1058, Cruz 574, Rubio 173, Kasich 156, Carson 7, Bush 4, Fiorina 1, Huckabee 1, Paul 1.

(In addition to the 57 delegates from Indiana for Trump, this includes adjustments since last week that total: Cruz +6, Kasich -2, Carson -2, Trump -3.)

This means Trump now needs 179 of the remaining 497 delegates to wrap this up.

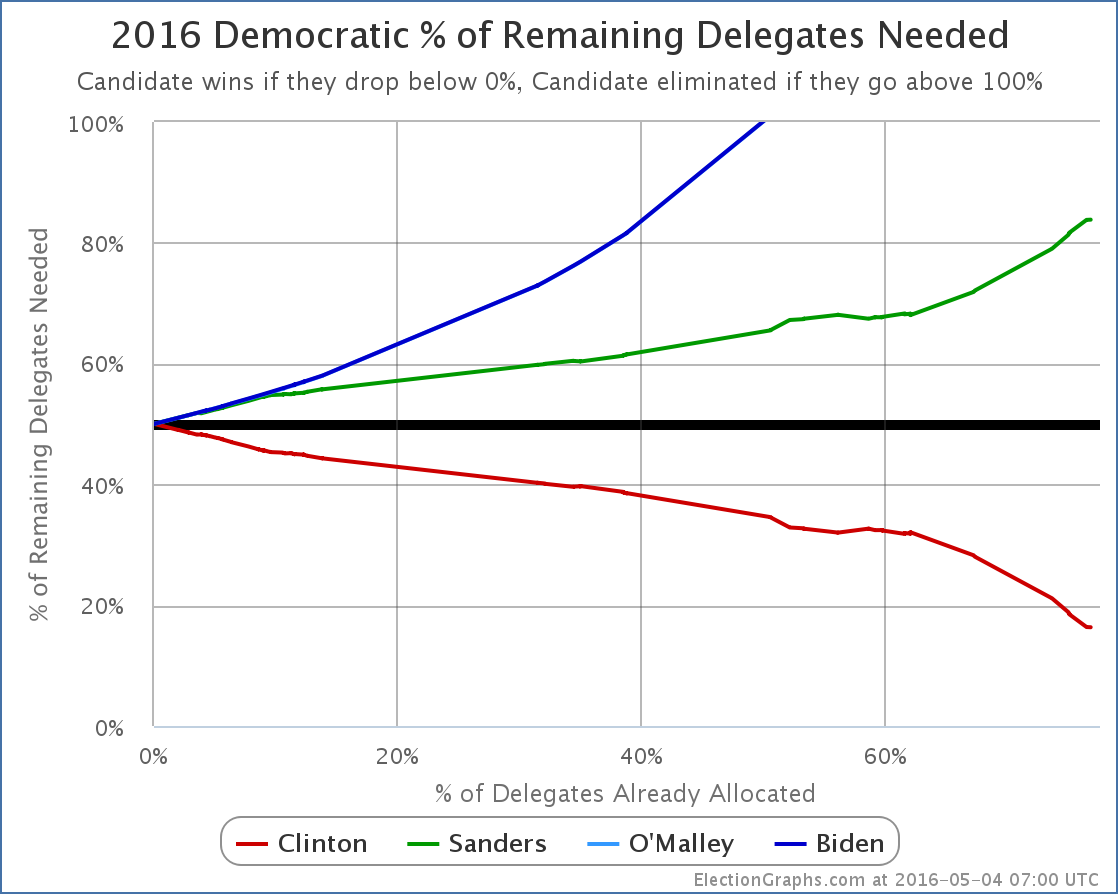
Which brings us to the % needed chart:

chart-134

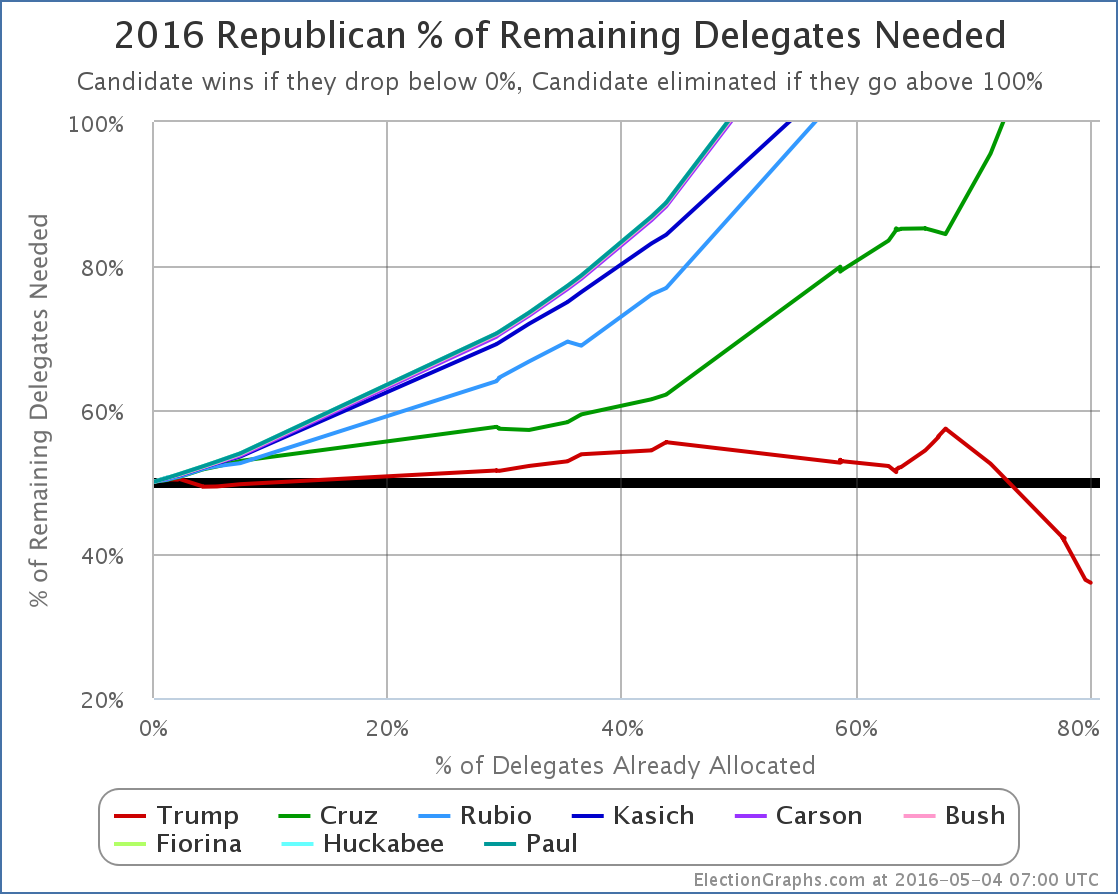
Trump now needs 36.02% of the remaining delegates to get to the magic number of 1237.

The remaining contests are essentially now just Trump vs Kasich. Unless you believe Kasich is suddenly going to start winning delegates in every remaining state by 64% to 36% margins despite getting less than 8% of the delegates so far, Trump will do what he needs to do. He will probably do much better than he needs to do.

So he will win, and he will win outright. No contested convention, just an outright win.

If there had been enough “Shadow anti-Trump” delegates… those that were pledged to Trump, but really supported someone else, then there may have been the ability to change the rules to unbind the delegates, opening up a back door for someone else to win even if Trump had the nominal majority. The fact that Cruz dropped out after Indiana indicates that those numbers just were not there…

And so we’re essentially done.

ElectionGraphs.com will continue to document this process, but now it is just a matter of watching Trump gather up the remaining delegates needed. There is no question any more how this will play out.

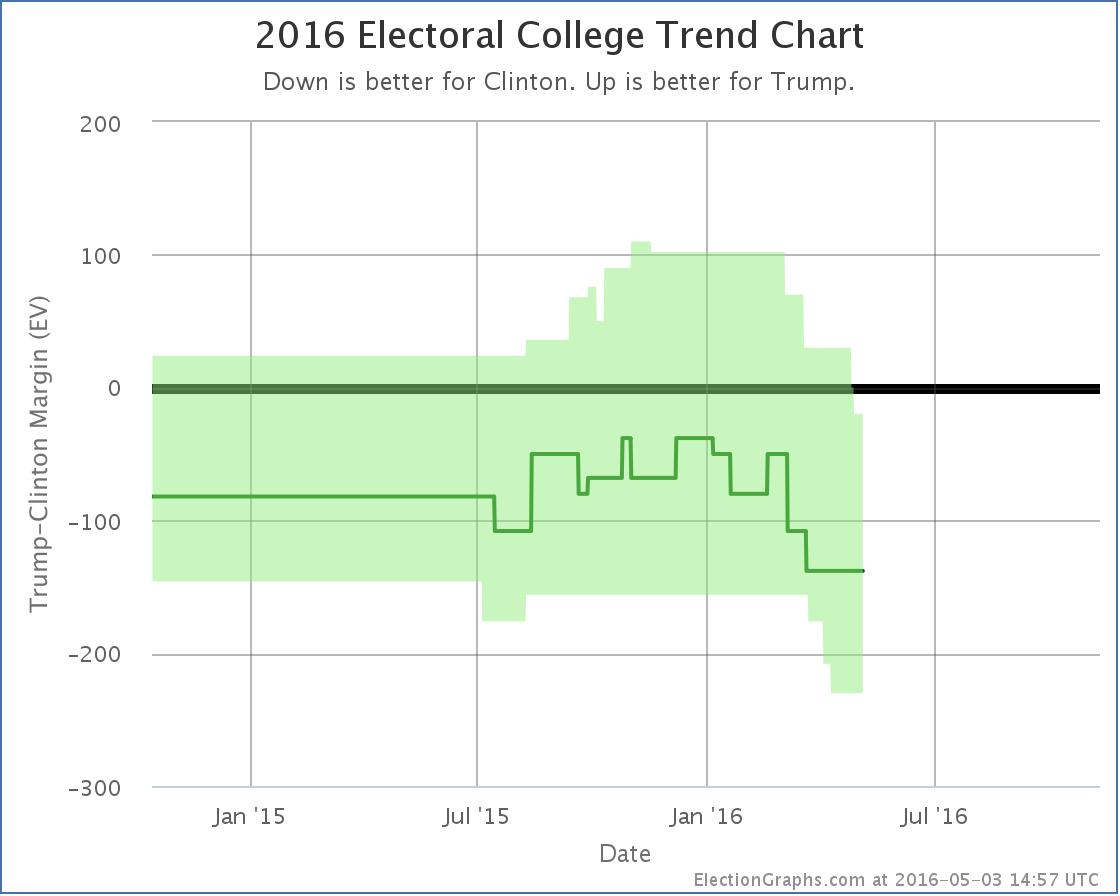
Unless a metaphorical meteor (or a literal one I guess) hits Clinton or Trump, we have our nominees. The general election is lined up. We are going to be watching Clinton vs Trump.

Update 2016-05-11 06:32 UTC – Adjustments from American Samoa’s uncommitted delegates, and Louisiana’s uncommitted delegates as well as Louisiana’s now free Rubio delegates. Net result: Trump +14, Cruz -3, Rubio -5.

Note: This post is an update based on the data on ElectionGraphs.com. Election Graphs tracks both a poll based estimate of the Electoral College and a numbers based look at the Delegate Races. All of the charts and graphs seen in this post are from that site. Additional graphs, charts and raw data can be found there. All charts above are clickable to go to the current version of the detail page the chart is from, which may contain more up to date information than the snapshots on this page, which were current as of the time of this post. Follow @ElectionGraphs on Twitter or like Election Graphs on Facebook to see announcements of updates or to join the conversation. For those interested in individual general election poll updates, follow @ElecCollPolls on Twitter for all the polls as they are added.

Democrats: Sanders wins Indiana 44 to 39, but it doesn’t matter

Sanders won Indiana’s pledged delegates 44 to 39.

So he got 53.01% of the delegates. He needed 80.92% to be on a pace to catch up with Clinton.

But it is actually worse. That 80.92% was as of the results from the Northeast last week. Since then between superdelegate announcements and a revision to the Ohio results, there was a net change of Clinton +11, Sanders -1. If you add that in, you get Clinton +50, Sanders +43 since last week. So actually Sanders only got 46.24% of the recent delegates.

Which means, of course, that Clinton just continued her march to the nomination and improved her position despite Sanders’ win.

Here come the graphs:

chart-131

The totals are now Clinton 2202, Sanders 1455, O’Malley 1. Clinton only needs 181 of the 1107 remaining delegates to wrap this up.

Which brings us to…

chart-132

Clinton now only needs 16.35% of the remaining delegates to win. Sanders needs 83.83%.

Massive superdelegate defections could alter this, but there have never been any signs of such movement, and there are none now.

For a long time now the result has been clear absent a catastrophic change. As we have fewer and fewer delegates left, the curves above will move more quickly toward the final result, and it will be more and more difficult to get a result that would even slow it down.

ElectionGraphs.com will continue to document this process, but there is little to no drama left, it is just a matter of watching Clinton gather up the remaining delegates needed.

Update 2016-05-08 01:57 – Superdelegate update, net change Clinton +3. Update from Mississippi, net change Clinton -1, Sanders +1.

Note: This post is an update based on the data on ElectionGraphs.com. Election Graphs tracks both a poll based estimate of the Electoral College and a numbers based look at the Delegate Races. All of the charts and graphs seen in this post are from that site. Additional graphs, charts and raw data can be found there. All charts above are clickable to go to the current version of the detail page the chart is from, which may contain more up to date information than the snapshots on this page, which were current as of the time of this post. Follow @ElectionGraphs on Twitter or like Election Graphs on Facebook to see announcements of updates or to join the conversation. For those interested in individual general election poll updates, follow @ElecCollPolls on Twitter for all the polls as they are added.

Electoral College: Trump now losing even if he wins all Clinton’s close states

It has only been a few days since the last Electoral College update but there have already been polls added for Ohio, Indiana, California, Florida and Minnesota. A couple of these made differences to the ElectionGraphs.com models, so lets take a look…

Clinton vs Trump

chart-127

Minnesota has been lightly polled. The average still is padded with the 2012 election results. But with this addition, Clinton’s lead is now 5.5%, which puts the state out of the “Weak Clinton” category and into “Strong Clinton”. For the ElectionGraphs.com model that means for now we now assume that even in a very favorable case, Trump will not win Minnesota.

In the last update Trump’s best case was already an electoral college tie. So, with Minnesota out of the picture…

chart-128

Screen Shot 2016-05-03 at 22.25.29939

Screen Shot 2016-05-03 at 22.26.18088

So yes. Trump’s best case… winning all the states where he leads in the polls, plus all the states where Clinton leads by less than 5%, is now to lose to Clinton by 20 electoral votes.

Now, it is important to mention that even though I call this Trump’s “best case”, it is the best case as of right now, with the polls we have today. It is May. We have months to go before the general election. A lot can change. So this doesn’t mean Trump can’t win. It just means that if today’s polling averages held, he couldn’t win.

The tipping point (the percentage you would have to move all the state polls to flip the winner) also moved toward Clinton:

chart-129

All this together means that Trump is now very far behind Clinton. She has the clear advantage. A big advantage. Trump has a lot of work to do if he wants to catch up and be in a winning position by November. It is not impossible, but it will require changing a lot of minds.

Clinton vs Cruz

Oh yeah, Cruz is still in it too Cruz was still in it when this last batch of polls was taken, and he did badly as well. The latest poll in Florida didn’t change the categorization of Florida, but since Florida was the tipping point state it moved the tipping point:

chart-130

Given the state of the nomination races though any combination other than Clinton vs Trump appears to be completely academic now, absent some catastrophic unexpected event.

188.8 days until polls close on election day 2016.

Note: This post is an update based on the data on ElectionGraphs.com. Election Graphs tracks both a poll based estimate of the Electoral College and a numbers based look at the Delegate Races. All of the charts and graphs seen in this post are from that site. Additional graphs, charts and raw data can be found there. All charts above are clickable to go to the current version of the detail page the chart is from, which may contain more up to date information than the snapshots on this page, which were current as of the time of this post. Follow @ElectionGraphs on Twitter or like Election Graphs on Facebook to see announcements of updates or to join the conversation. For those interested in individual general election poll updates, follow @ElecCollPolls on Twitter for all the polls as they are added.

@ElectionGraphs tweets from 2016-05-03 (UTC)

@ElecCollPolls tweets from 2016-05-03 (UTC)

@abulsme tweets from 2016-05-03 (UTC)