States with new poll data added since the last update: All 50 states, DC, the Maine congressional districts, and the 2nd congressional district in Nebraska.
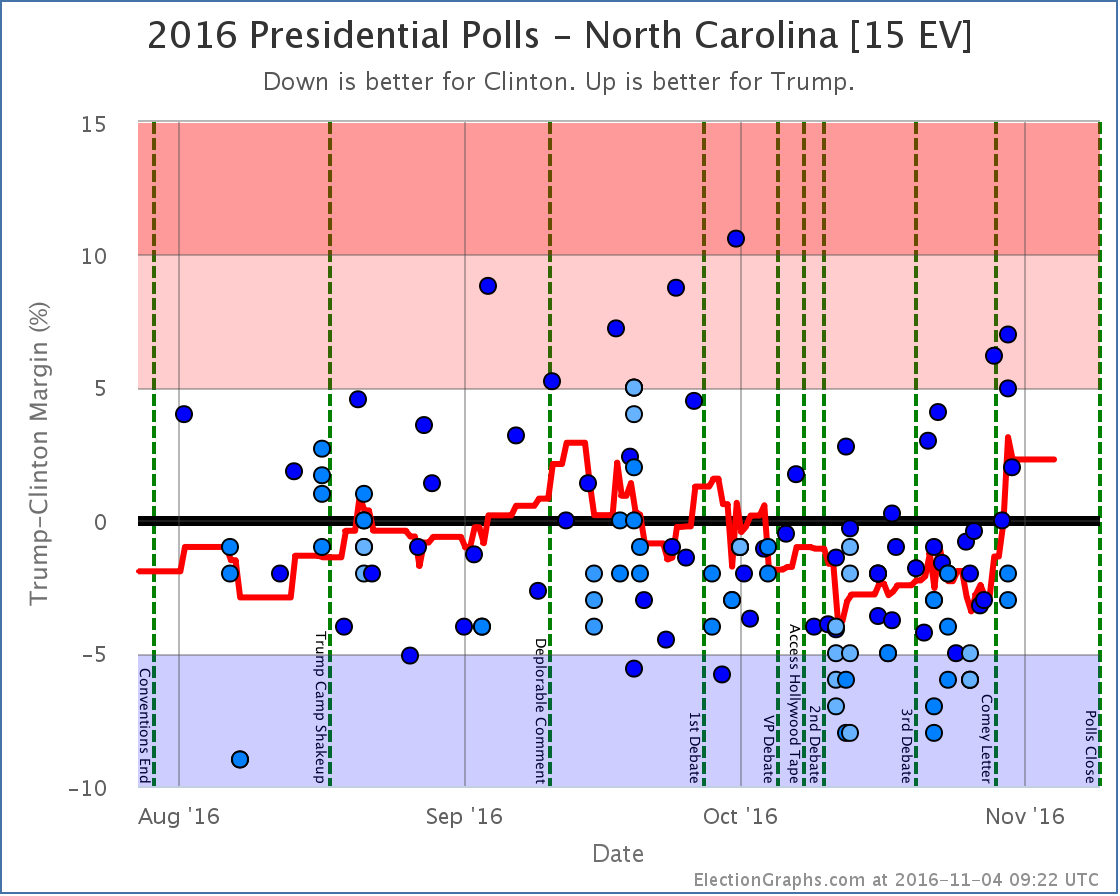
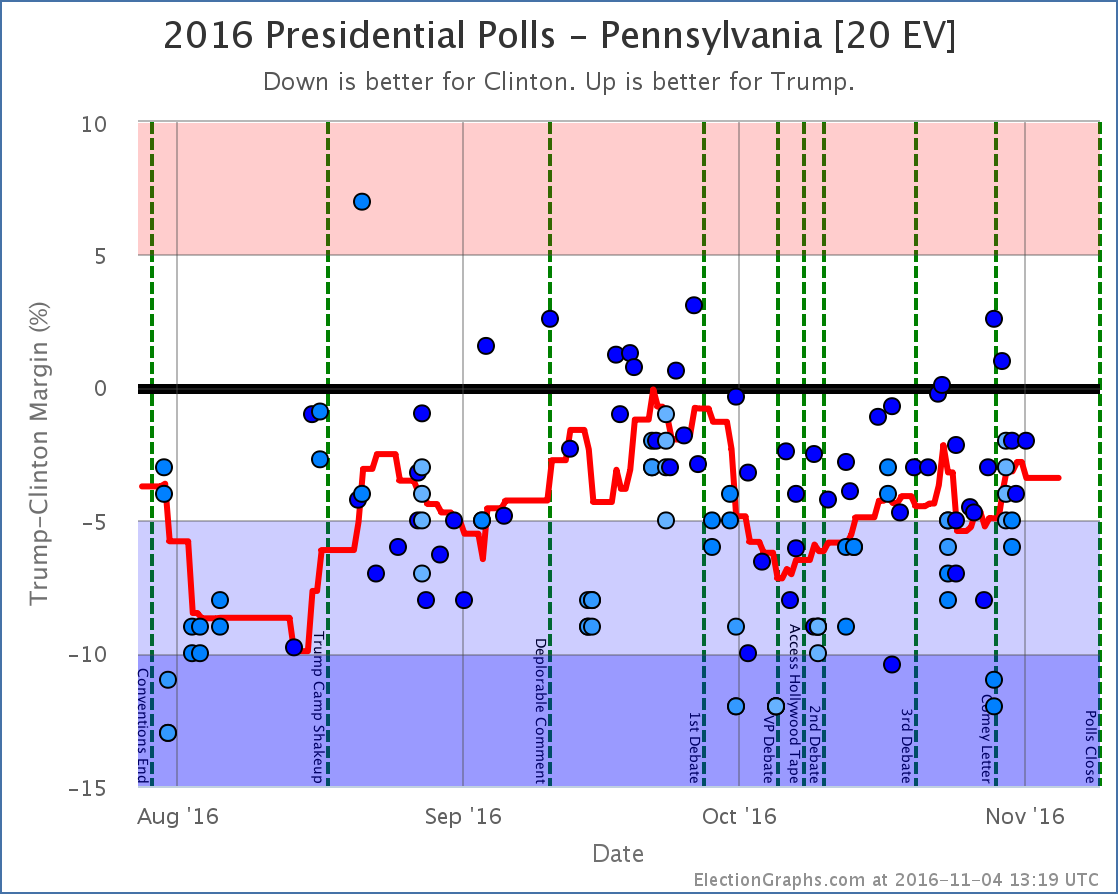
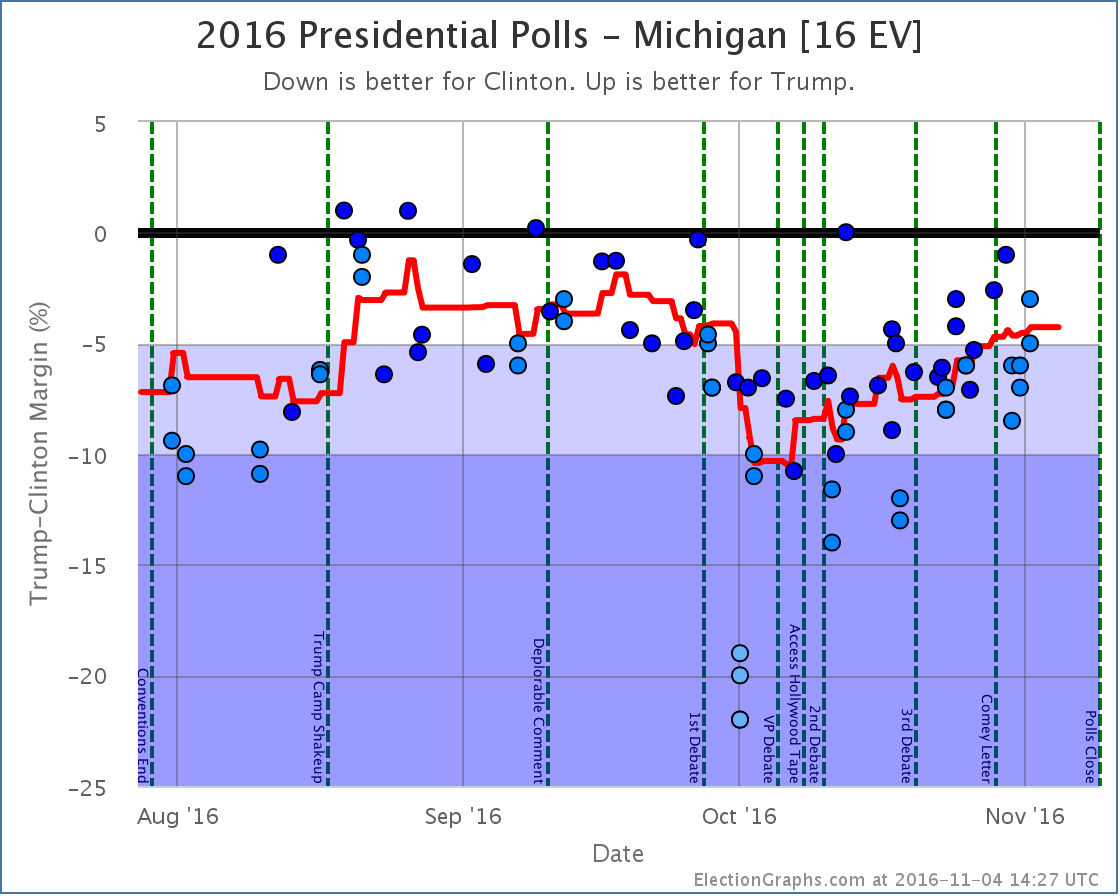
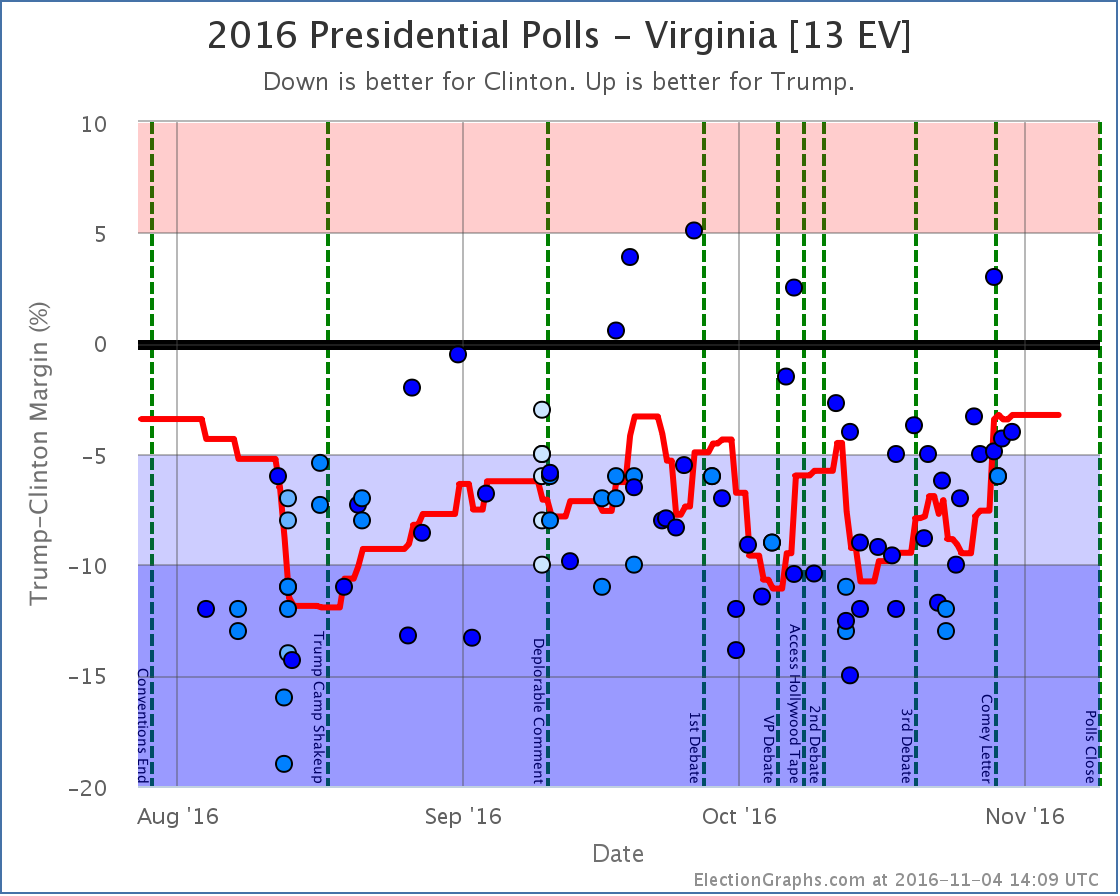
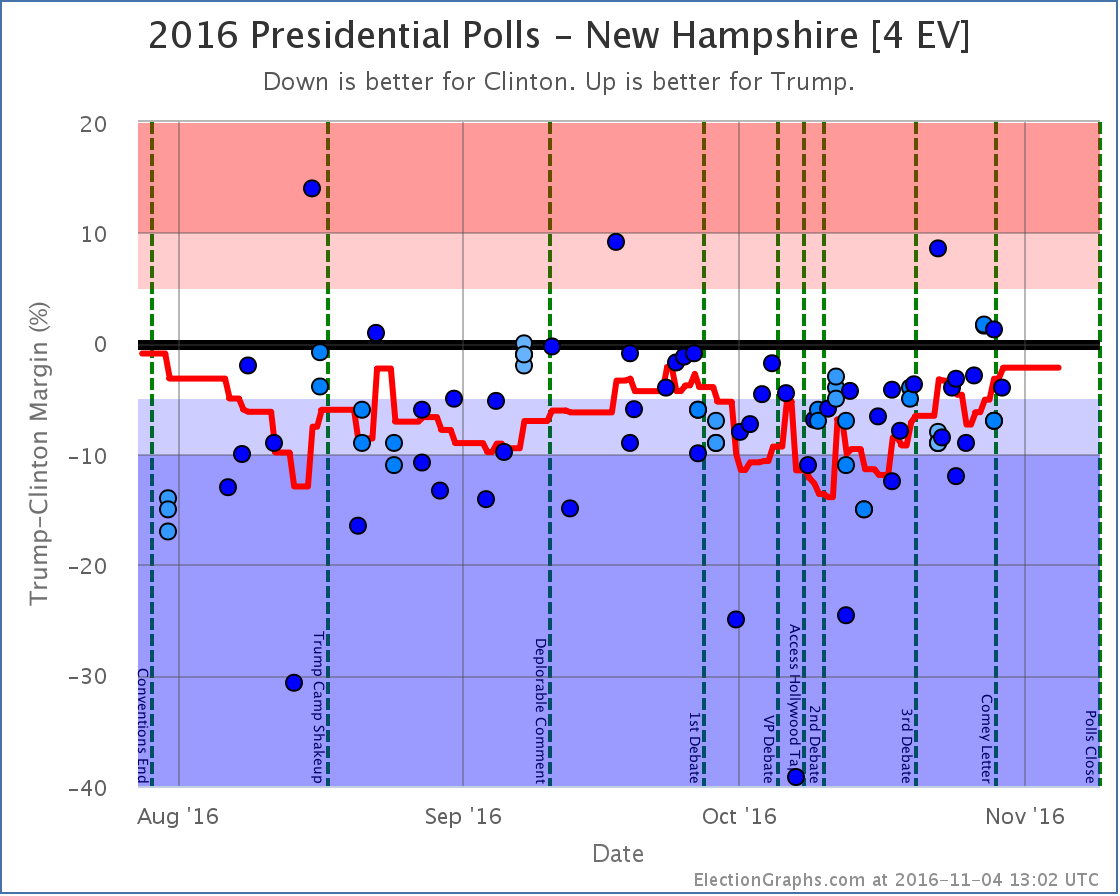
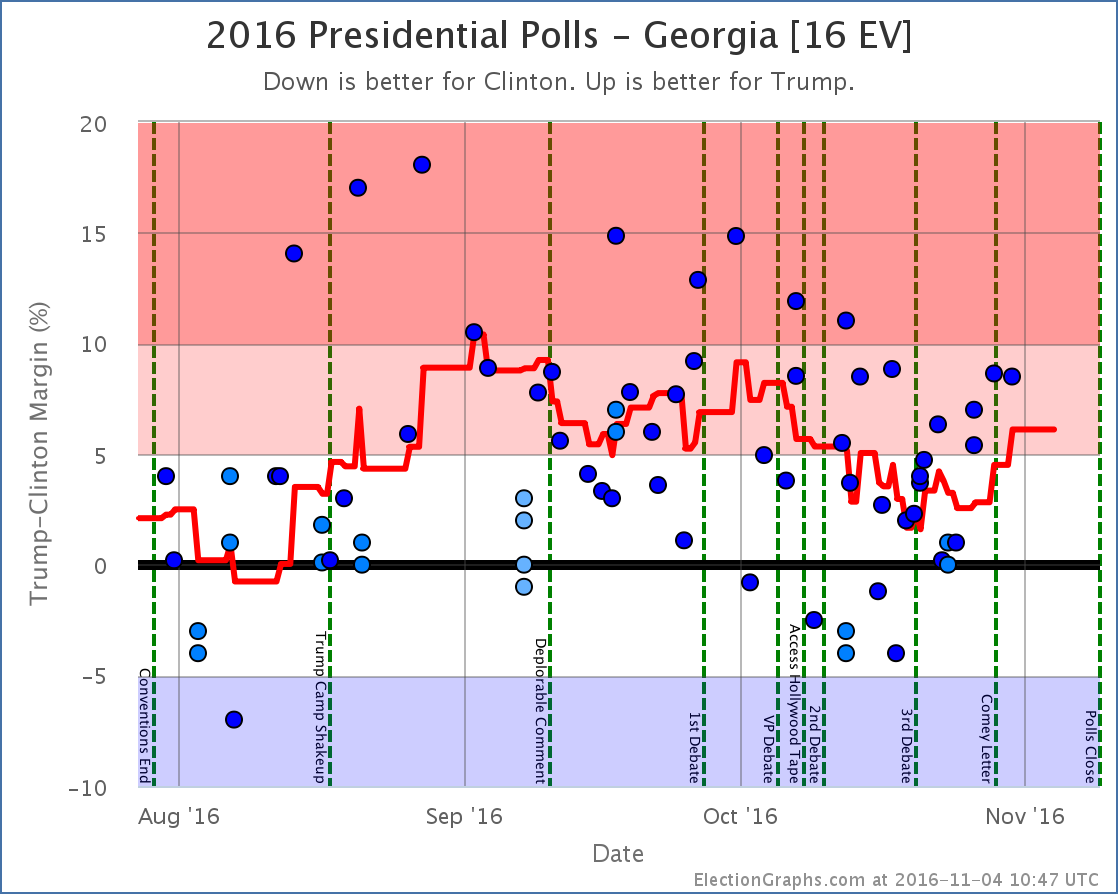
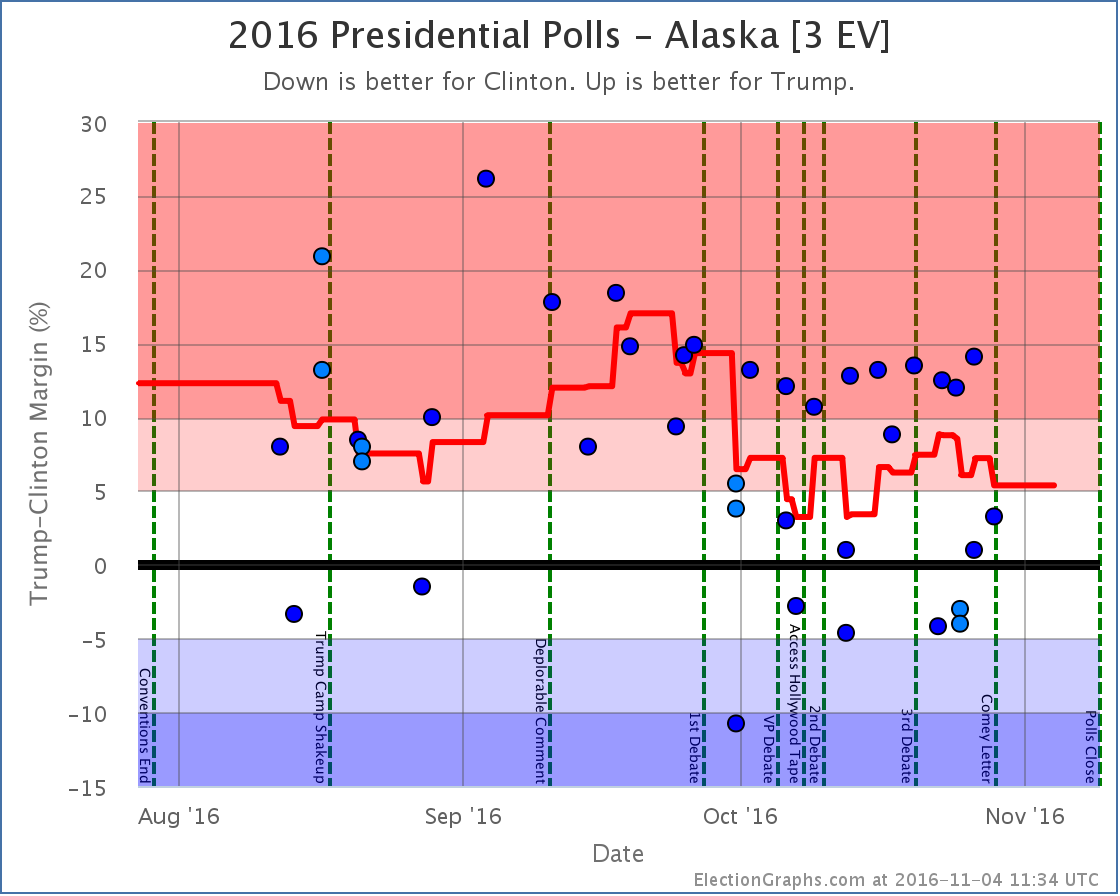
Notable changes in: Pennsylvania (20), Georgia (16), Michigan (16), North Carolina (15), Virginia (13), New Hampshire (4), Alaska (3), and the tipping point.
With the current pace of polling, there are already a number of new polls out since the line was cut for this update. They will of course be included in the next update.
National Summary
It has been about four days since the last update. Since then the movement has all been towards Trump. Some of this has been movement from polls taken primarily after the Comey letter, but a some of it also represents movement that was already happening when that news broke.
Good for Trump:
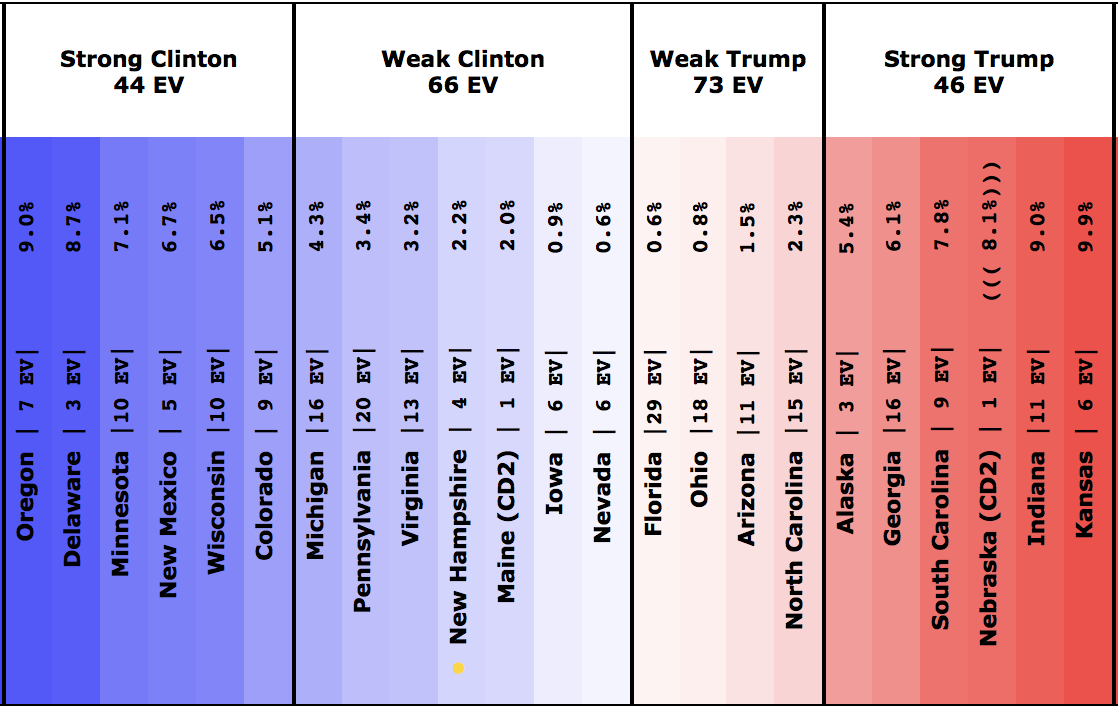
- The expected result has moved from a 62 EV Clinton win to only a 32 EV Clinton win
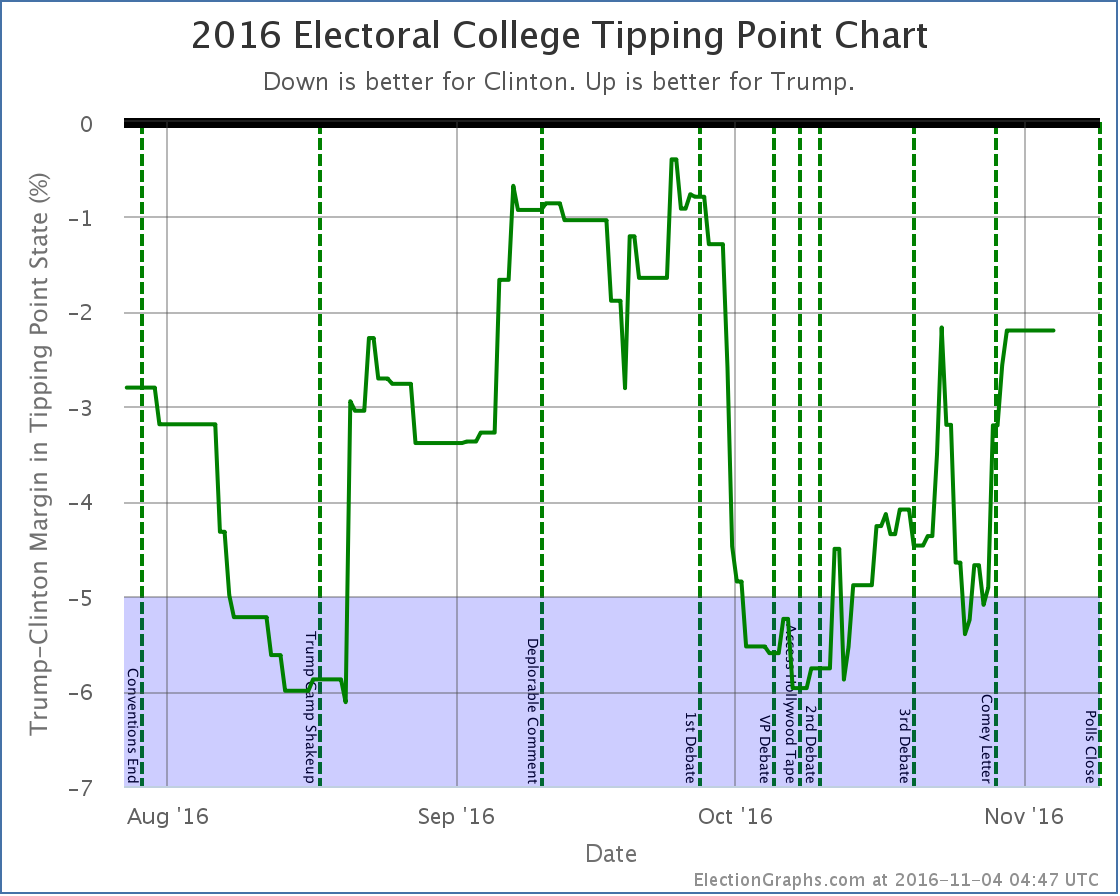
- The tipping point has moved from Clinton by 5.3% in PA to Clinton by only 2.2% in NH
- Clinton’s best case has declined from a 216 EV win to only a 178 EV win
- Trump’s best case has shifted from a 6 EV loss to a 100 EV win
Charts
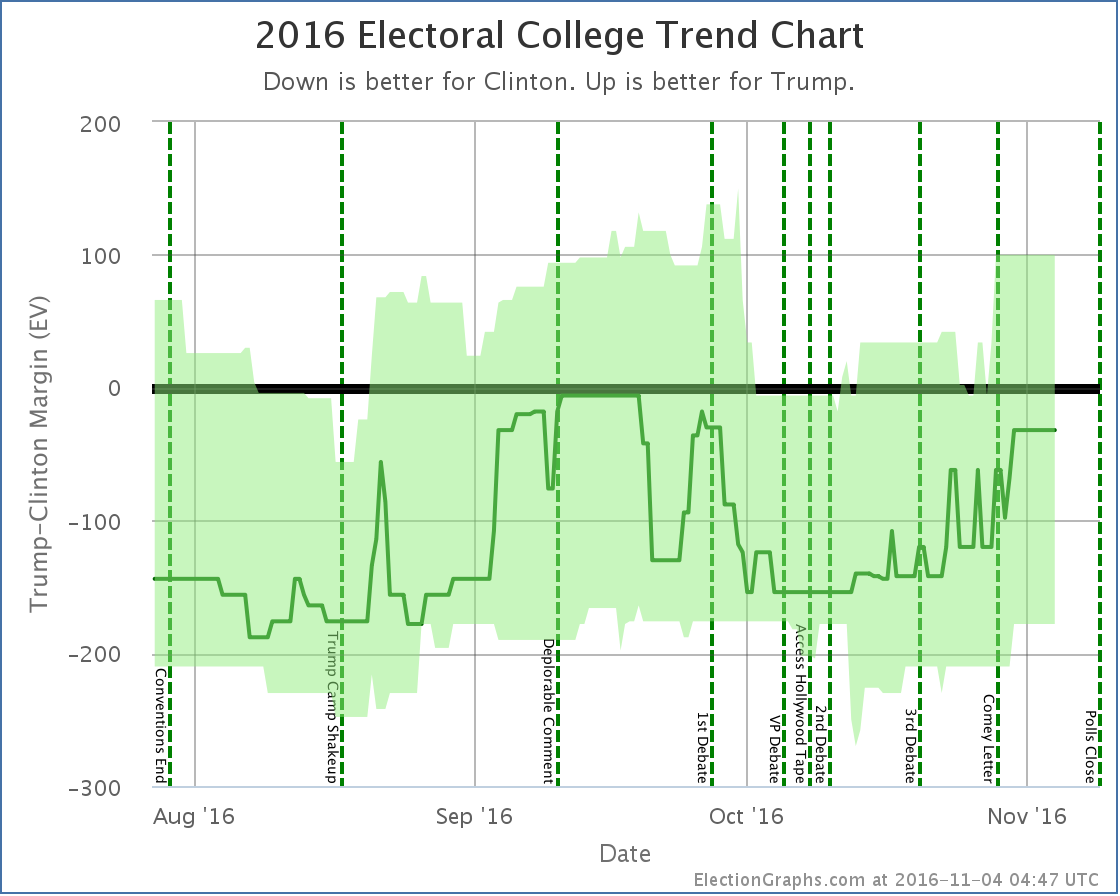
Discussion
Four days ago Trump had tightened the expected electoral college case, but critical states like Pennsylvania were moving against him, so the job of getting to 270 electoral votes was actually getting harder despite the electoral college gap narrowing.
Not so any more. In the last few days, which added lots of post-Comey polls (as well as some covering the pre-Comey period too) the movement has ALL been toward Trump. There is no mixed message this time. No bright side for Clinton. In the last few days almost all of the polling news has been good for Trump and bad for Clinton.
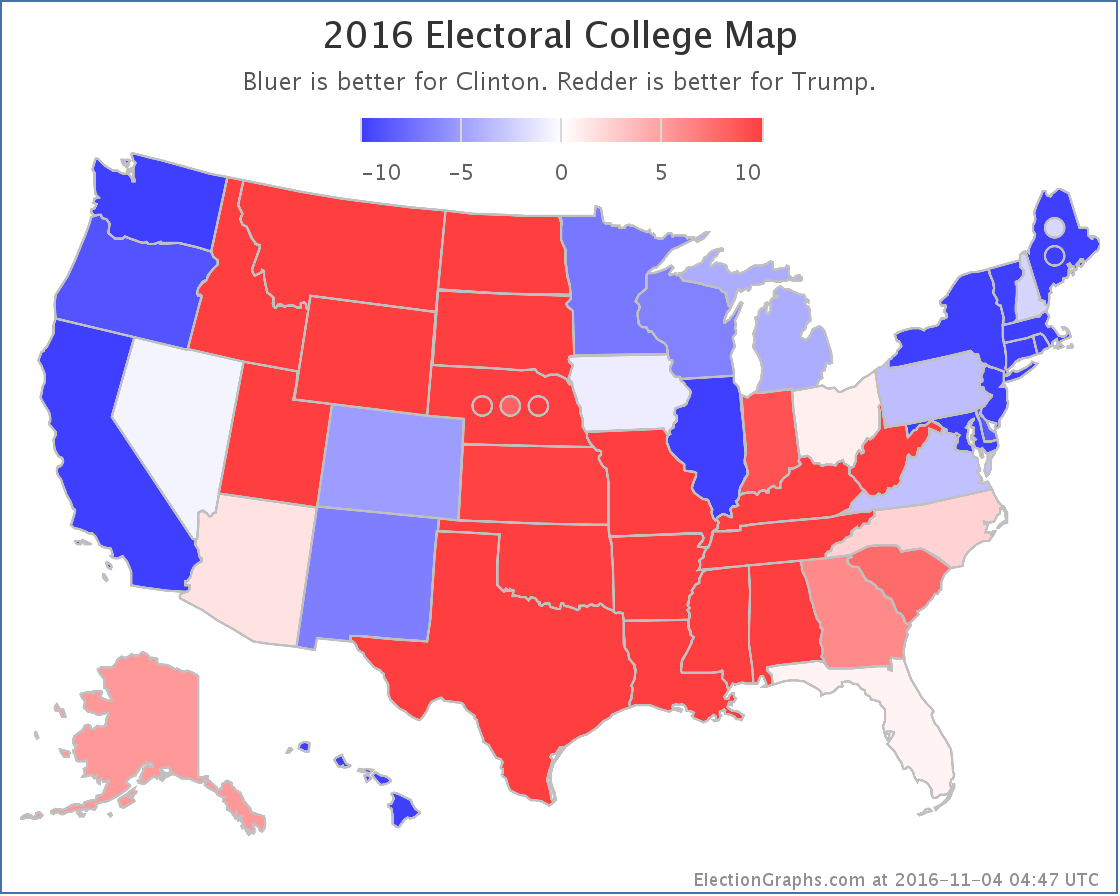
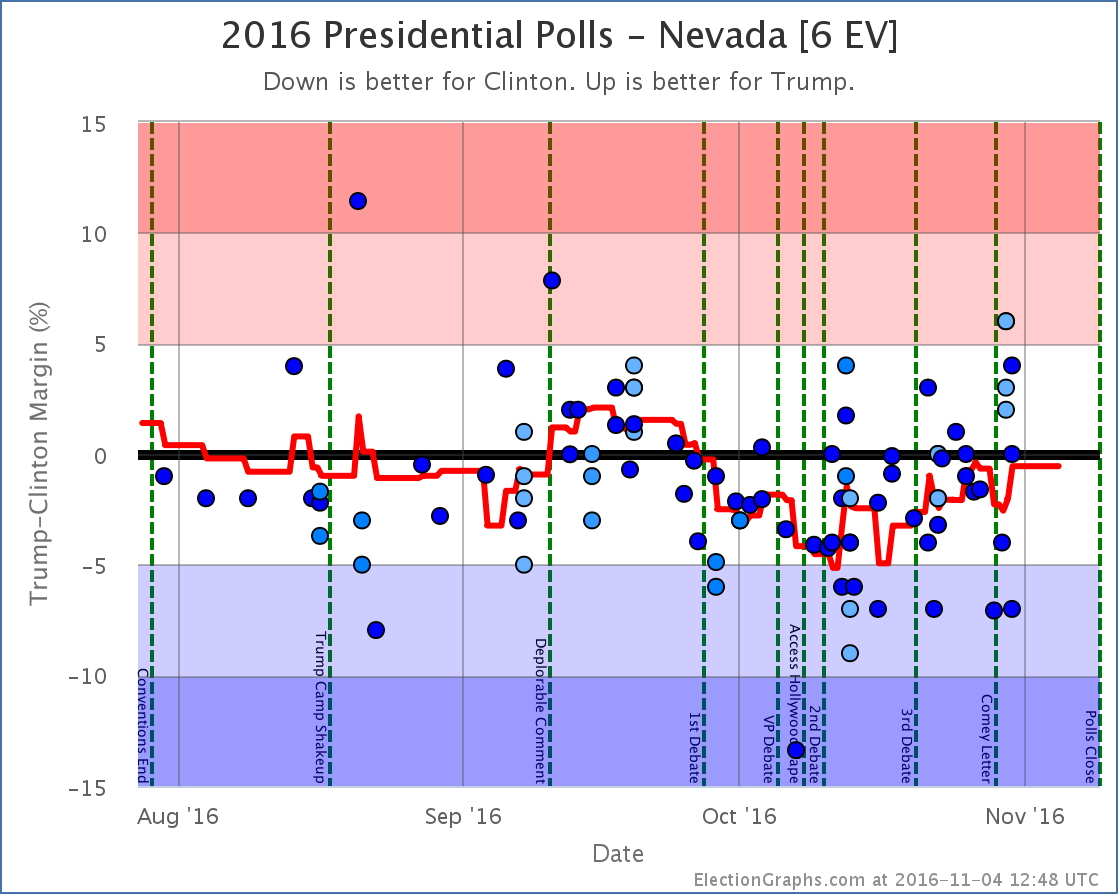
Now, she is still ahead. But Trump once again has a path. The “easiest” path at this point would be to win all the states he is currently leading, then pull in Nevada (0.6% Clinton lead), Iowa (0.9% Clinton lead) and New Hampshire (2.2% Clinton lead). Or he could get any one of those states, plus Virginia (3.2% Clinton lead). Or just Pennsylvania (3.4% Clinton lead). Or just Michigan (4.3% Clinton lead).
All of these states are ones where a few days ago Clinton’s lead was much stronger. Trump has been making gains all over the map.
How much of this is Comey? Some for sure, but as I’ve pointed out before, the expected electoral college been moving slowly toward Trump for weeks. But that did seem to have somewhat stalled out. The tipping point was moving back toward Clinton. With the Comey letter the move toward Trump came back with a vengeance.
We’re not quite at Trump’s highs from September, but we are getting near there. Now, even at his best point in September, Trump was still losing to Clinton. But it was close. And it is close again now. The Trump surge is real, and he has made this a race again.
The tipping point is at 2.2%. That is within the zone where a systematic polling error or a last minute news event that happens too late to be captured in polls could reverse the result. A Trump win COULD happen. This is not impossible.
Clinton is still heavily favored though.
This site does not produce “odds”, just the range of “you shouldn’t be completely shocked” outcomes, which is intentionally pretty wide. Right now, a Clinton win is expected, but a Trump win is not out of the question.
Lots of places do produce odds though. Here is the current rundown in terms of percentage chance of Trump winning:
- 32% – FiveThirtyEight
- 24% – Election Betting Odds
- 16% – New York Times
- 14% – PredictWise
- 9% – Daily Kos
- 6% – HorsesAss
- 2% – Huffington Post
- 1% – Princeton Election Consortium
I was asked on Twitter yesterday for my odds. Given that my model does not produce a number for this, I was reluctant to give an exact number. But I gave a range and said between 5% and 10%. With a few additional polls added since then, I’d go toward the higher end of that range. Maybe 7% to 10%.
Why that range?
Trump is getting very close to Clinton, but in all the prior polling movement in the campaign Trump has never been able to actually pull into the lead. It seems like he reaches a ceiling and gets to the point where to gain any further he has to not just convince the wishy-washy undecideds, but he has to start getting actual Clinton supporters to flip, which seems like a much harder job.
But until September I thought Trump’s ceiling was matching Romney’s performance in 2012. With current polling, Trump wins every state Romney won, then adds Florida and Ohio. So levels that look like ceilings can indeed be broken. Another bad news cycle for Clinton, or even some systematic error in the polling could easily put us there.
So 7% to 10% seems reasonable.
If a Trump win does happen, surprise is warranted, because he would have beaten the odds, but not shock, because he IS close.
If Trump was a hurricane that was four days out, we would be “within the cone”. Toward the edge of the cone to be sure. We are not directly on the projected path. We expect it to miss us. But we would be making preparations just in case the storm swerves and hits us.
4.3 days until we stop looking at polls and start looking at actual election results.
State Details
The following are the detailed charts for all the states that influenced the national changes outlined above.
Moving from Clinton to Trump
Moving into reach for Trump
Moving out of Clinton’s reach
Other states that helped move the tipping point
A note about McMullin
Election Graphs is designed around showing the Republican – Democrat margin, and there is not enough time before the election to revamp the site to properly account for 3rd parties that are strong enough to have a shot at winning electoral votes.
Right now the Real Clear Politics average in Utah has McMullin 12.0% behind the lead. The 538 average in Utah has him 10.3% behind the lead. Although McMullin was a lot closer than anyone expected, he never got closer than 5% to the lead in Utah in these averages and now appears to be fading. 538 still has him in second place, but it doesn’t seem likely at this point that he will win electoral votes.
If that changes, I will of course note it in these updates and on the Election Graphs site.
For more information…
This post is an update based on the data on ElectionGraphs.com. Election Graphs tracks a state poll based estimate of the Electoral College. All of the charts and graphs seen in this post are from that site. Additional graphs, charts and raw data can be found there. Follow @ElectionGraphs on Twitter or like Election Graphs on Facebook to see announcements of updates or to join the conversation. For those interested in individual general election poll updates, follow @ElecCollPolls on Twitter for all the polls as they are added. If you find the information in these posts interesting or useful, please consider visiting the tip jar.
Edit 17:45 UTC to fix some wording in the hurricane comparison paragraph.
Edit 19:53 UTC to fix a Comey/Comet autocorrect.