This is the website of Abulsme Noibatno Itramne (also known as Sam Minter).
Posts here are rare these days. For current stuff, follow me on Mastodon
|
States with new poll data added since the last update: All 50 states, DC, the Maine congressional districts, and the 2nd congressional district in Nebraska.
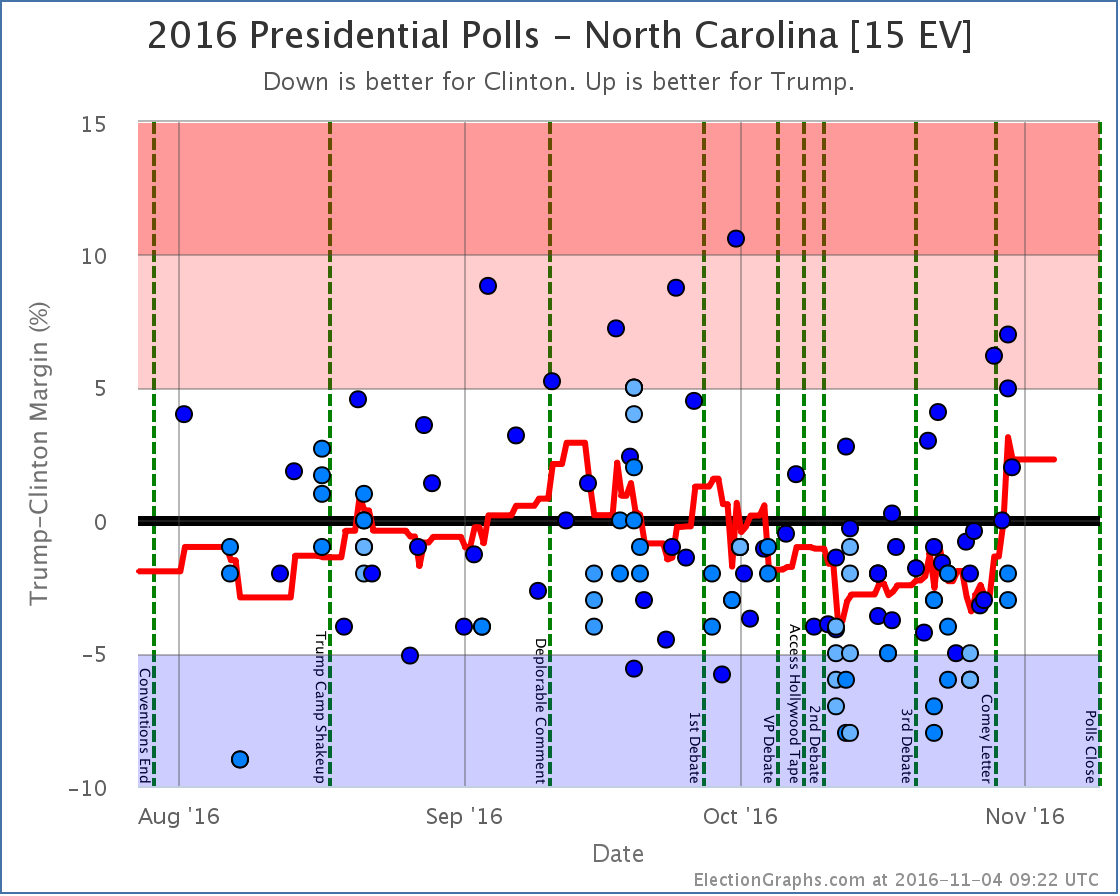
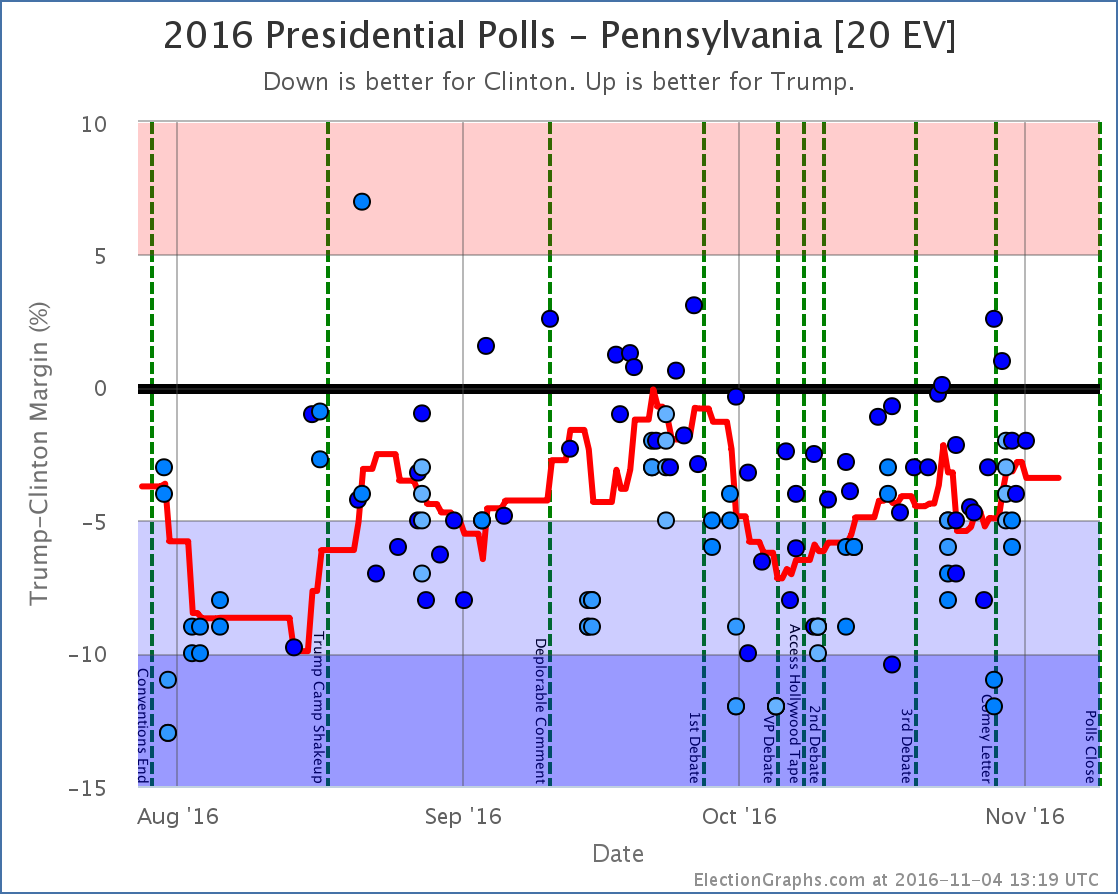
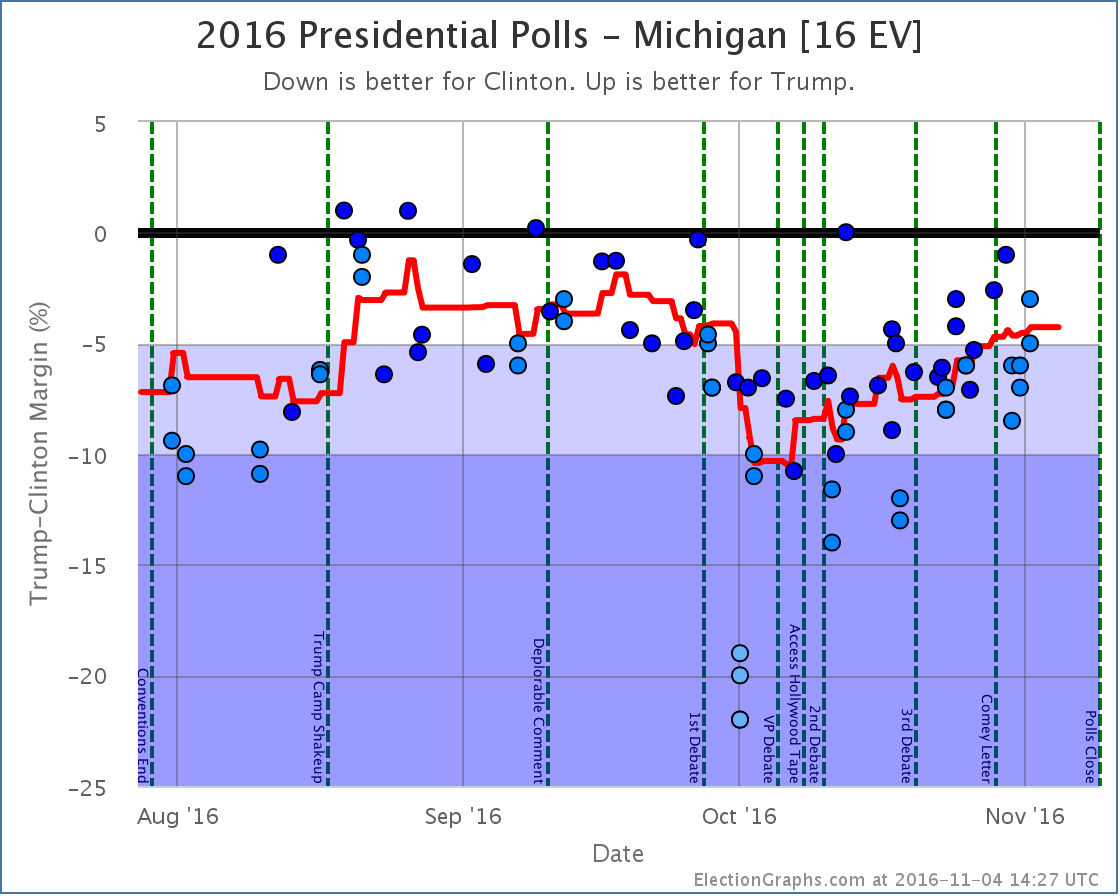
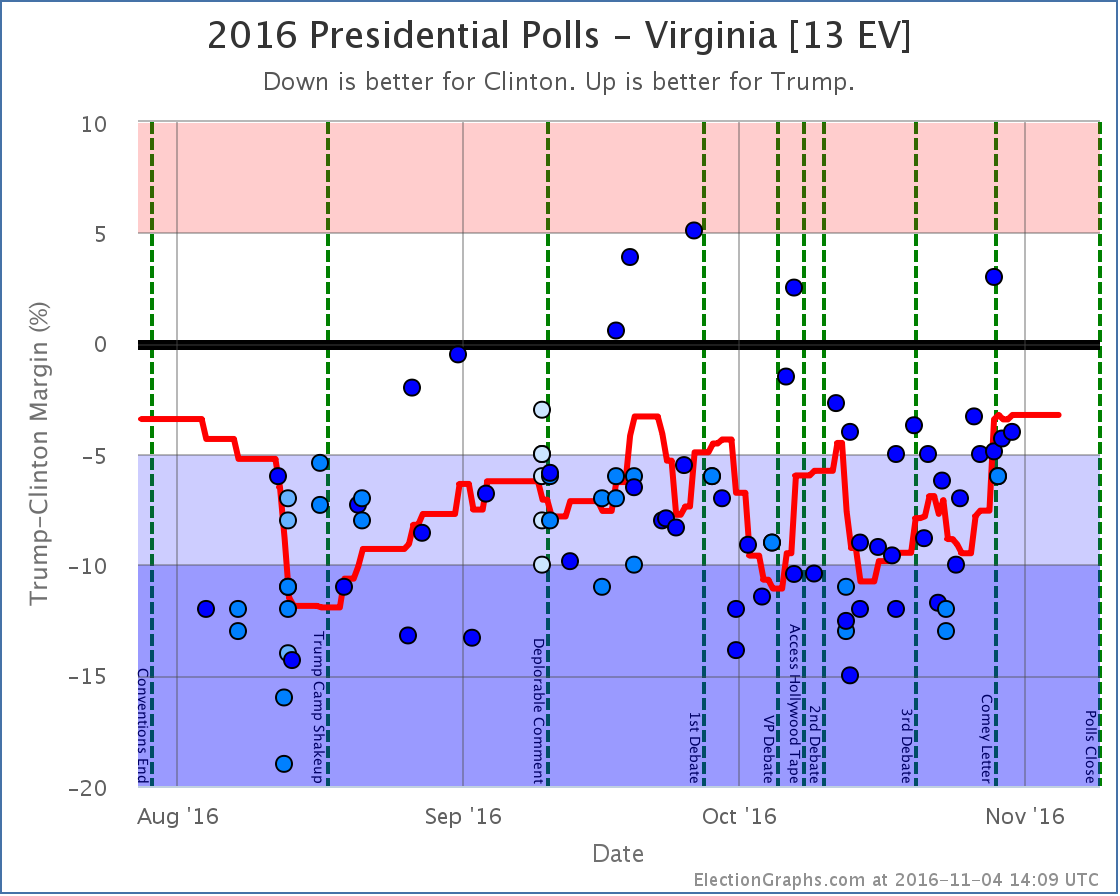
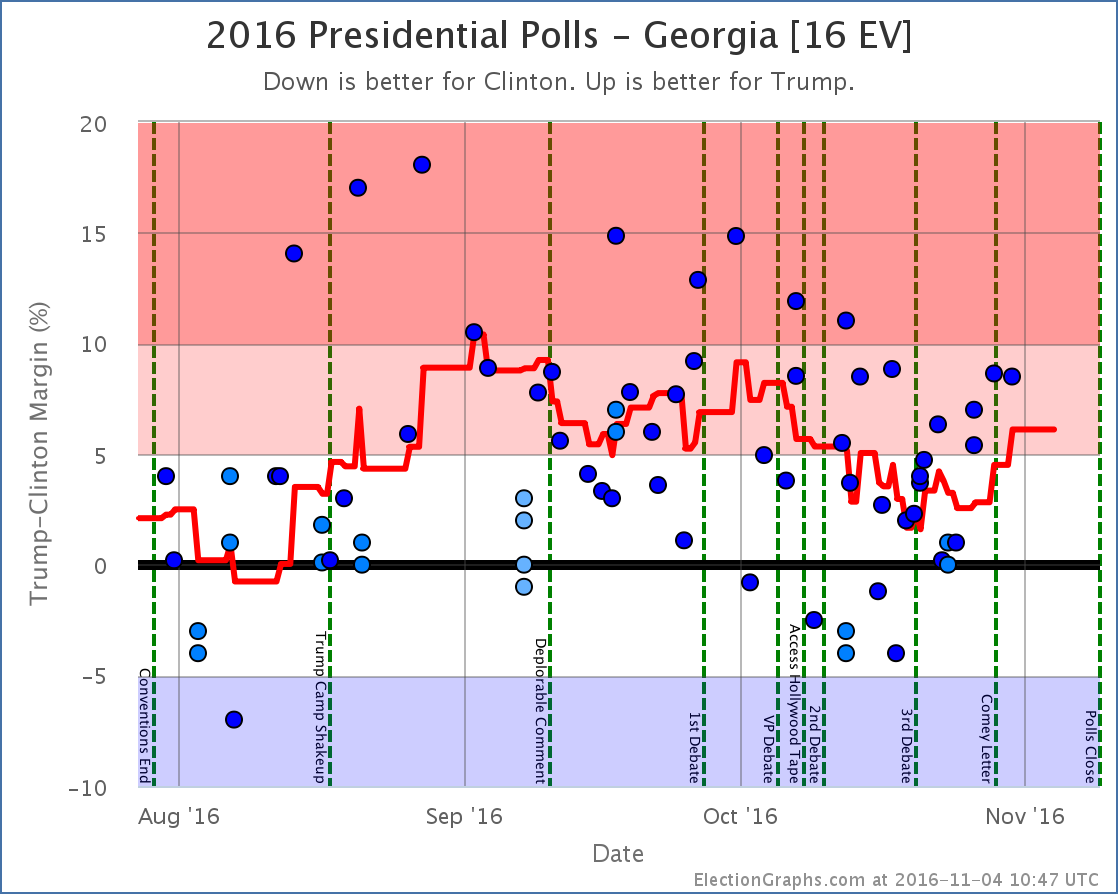
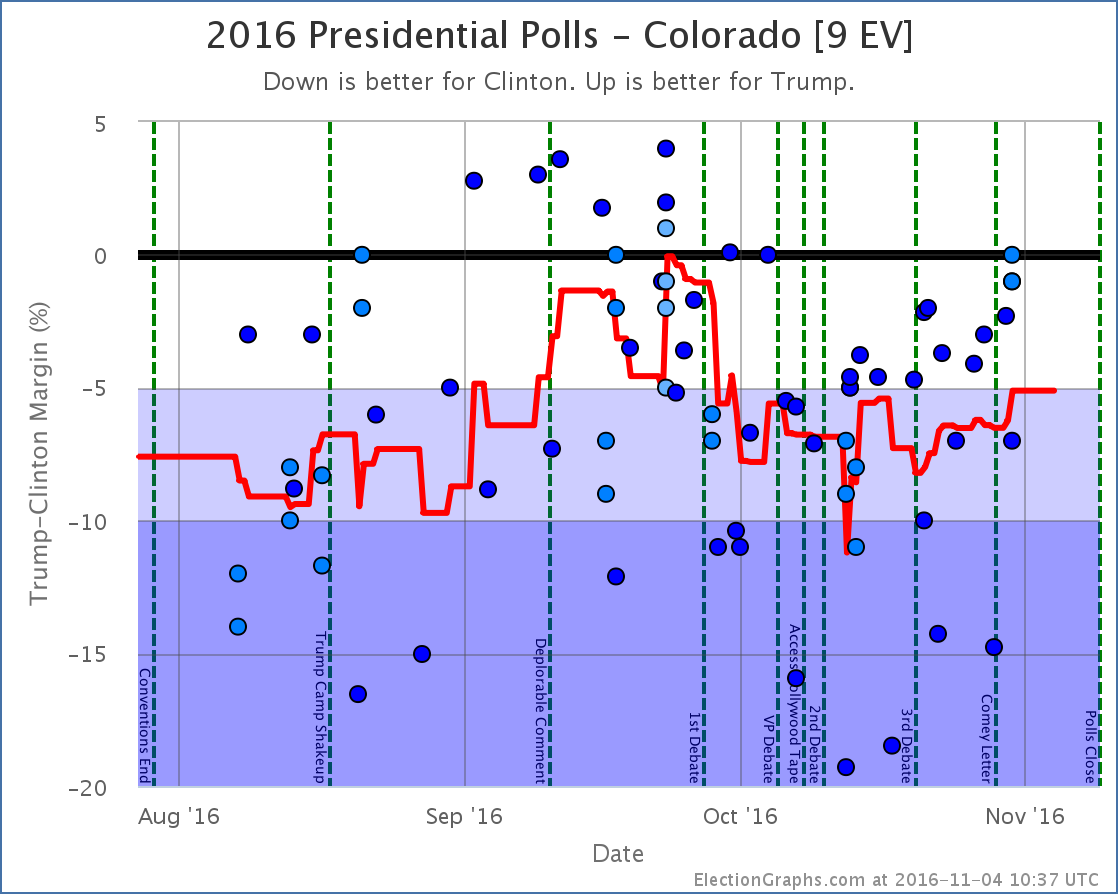
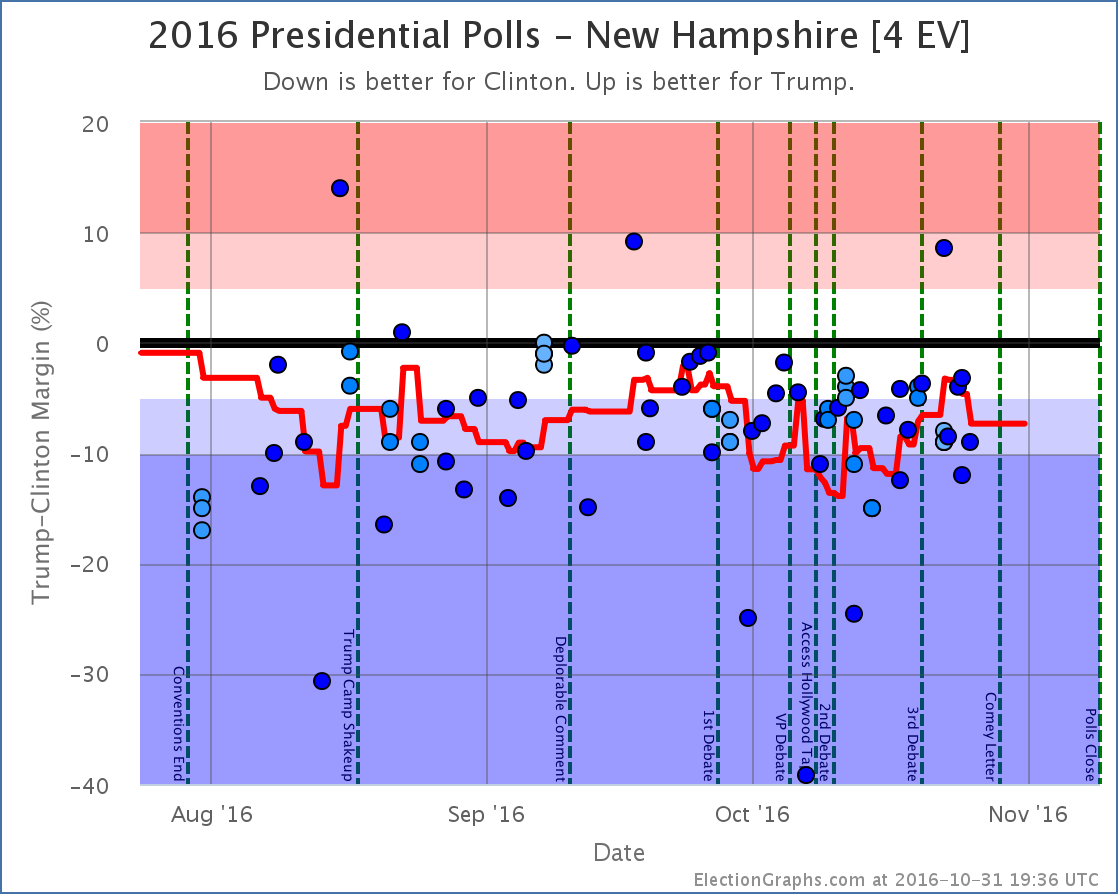
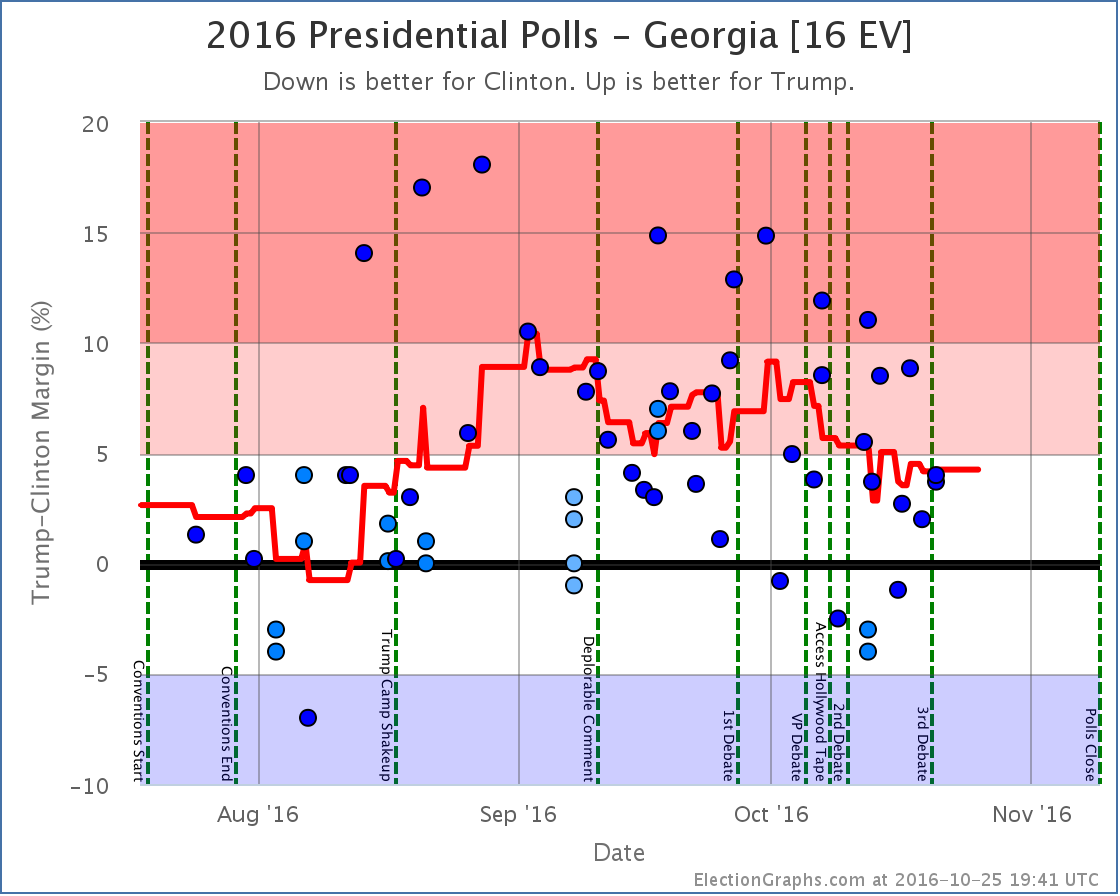
Notable changes in: Pennsylvania (20), Georgia (16), Michigan (16), North Carolina (15), Virginia (13), New Hampshire (4), Alaska (3), and the tipping point.
With the current pace of polling, there are already a number of new polls out since the line was cut for this update. They will of course be included in the next update.
National Summary
It has been about four days since the last update. Since then the movement has all been towards Trump. Some of this has been movement from polls taken primarily after the Comey letter, but a some of it also represents movement that was already happening when that news broke.
Good for Trump:
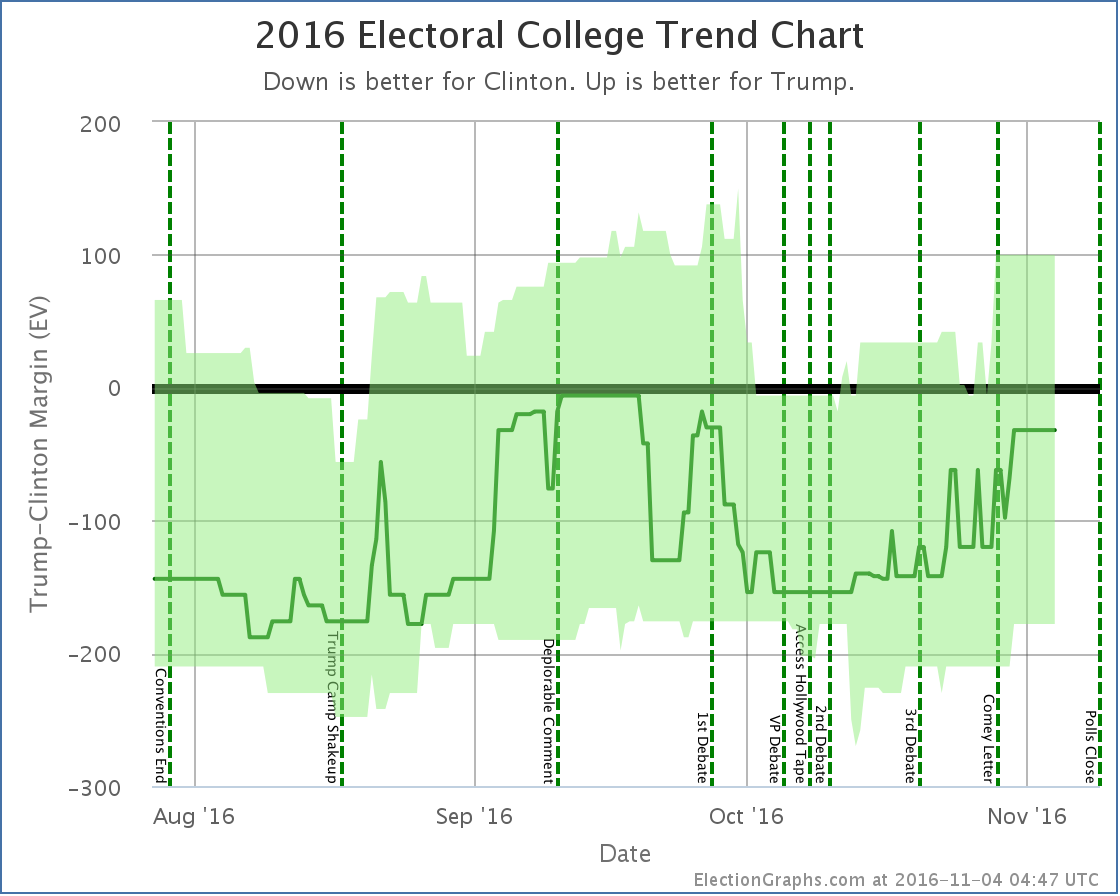
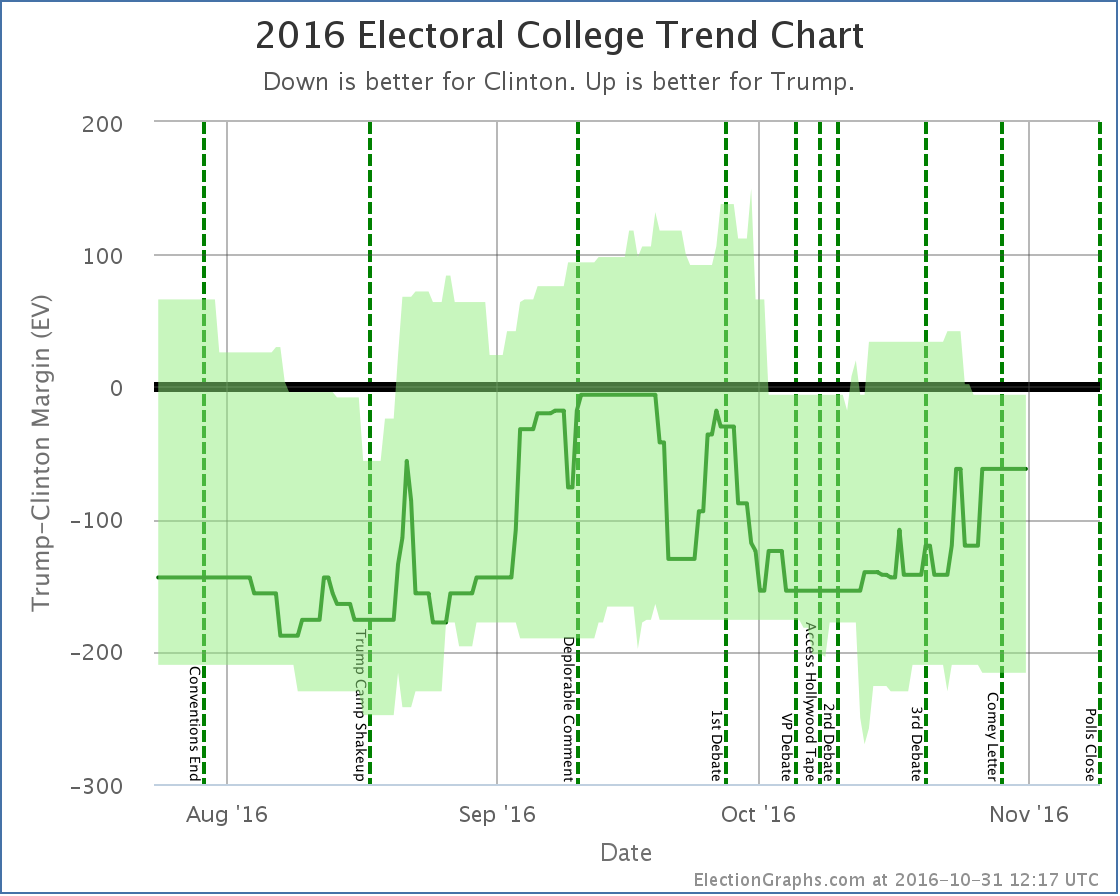
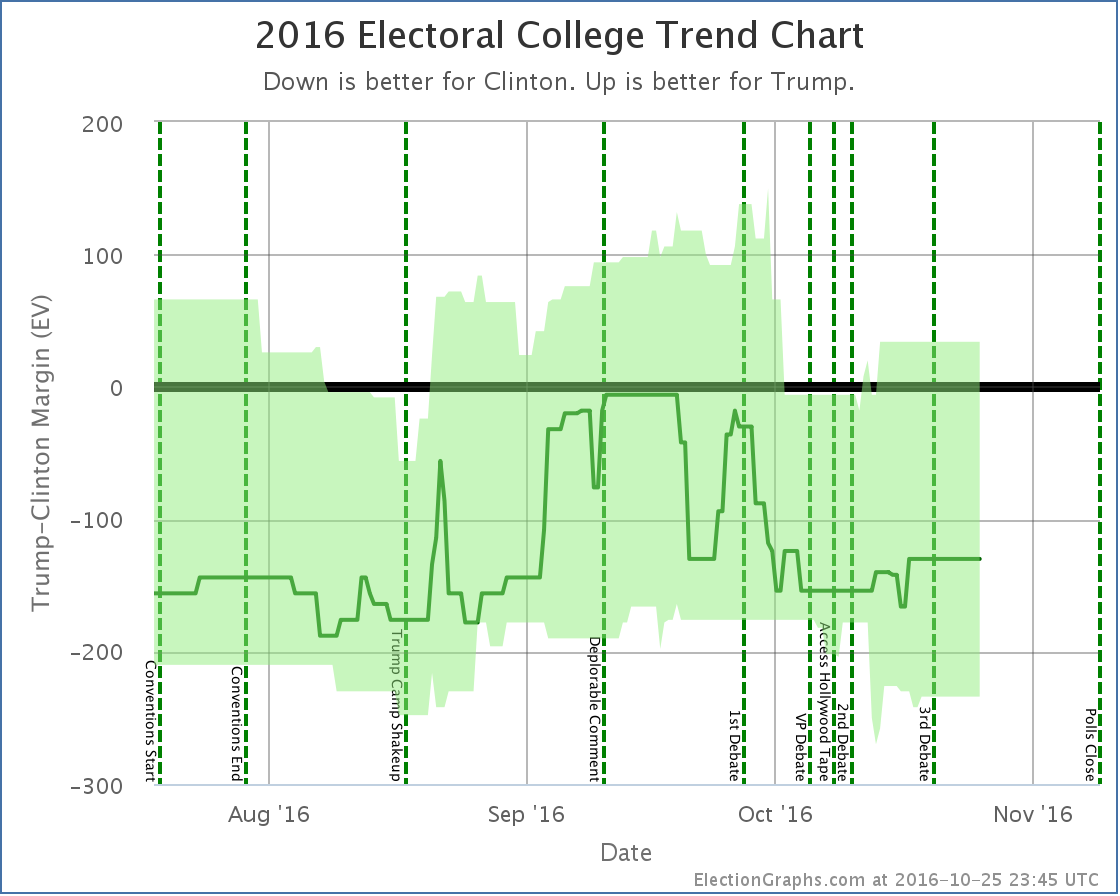
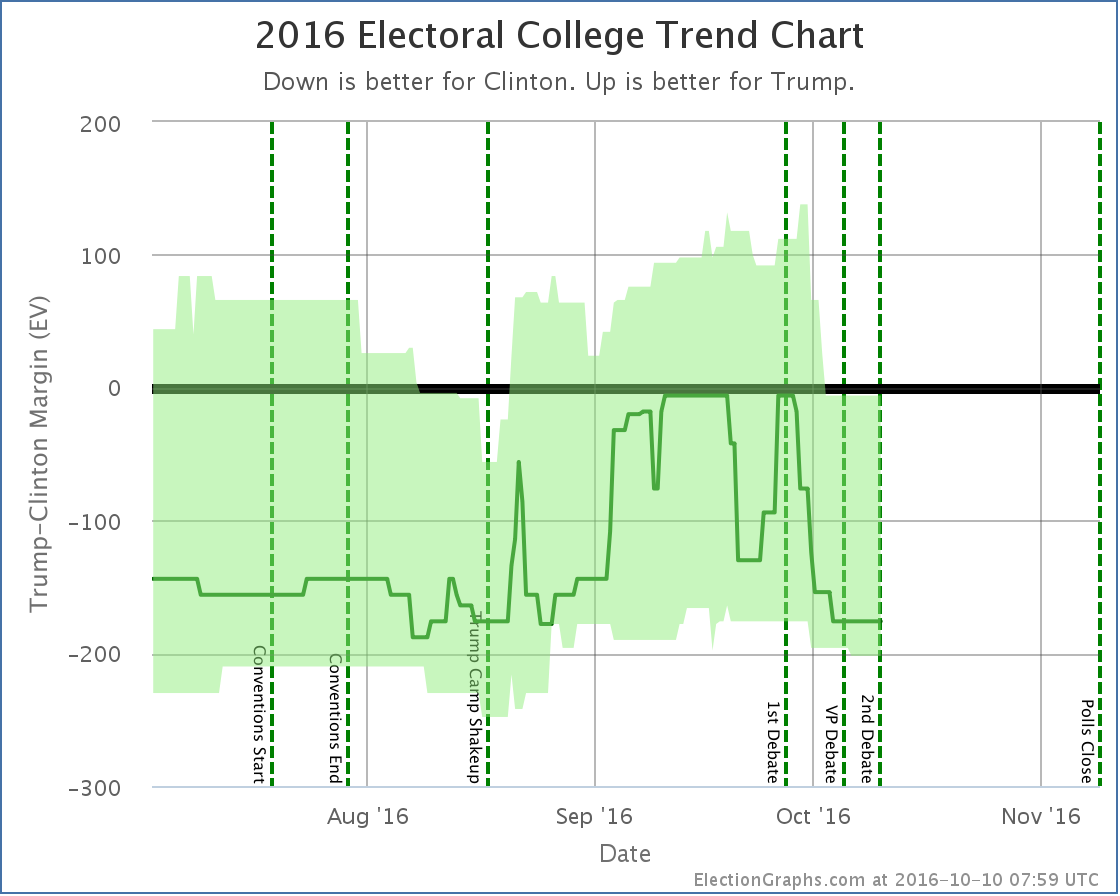
- The expected result has moved from a 62 EV Clinton win to only a 32 EV Clinton win
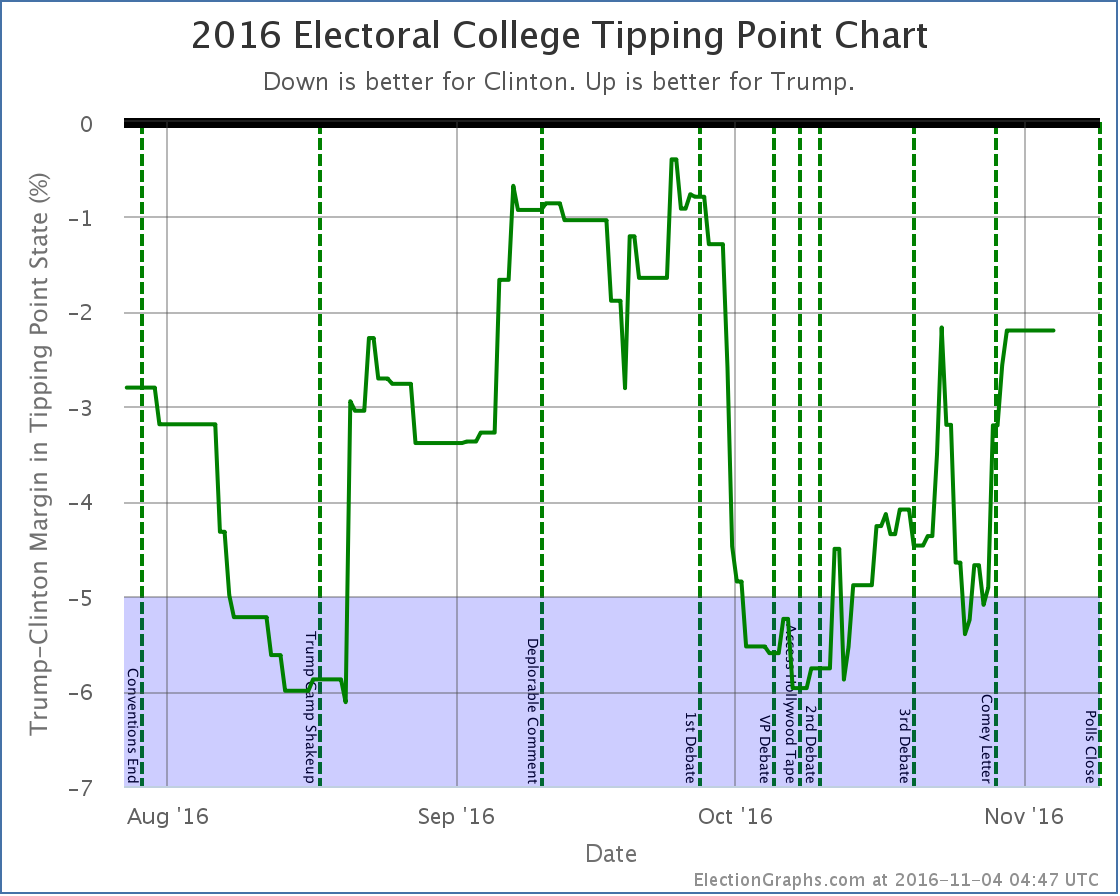
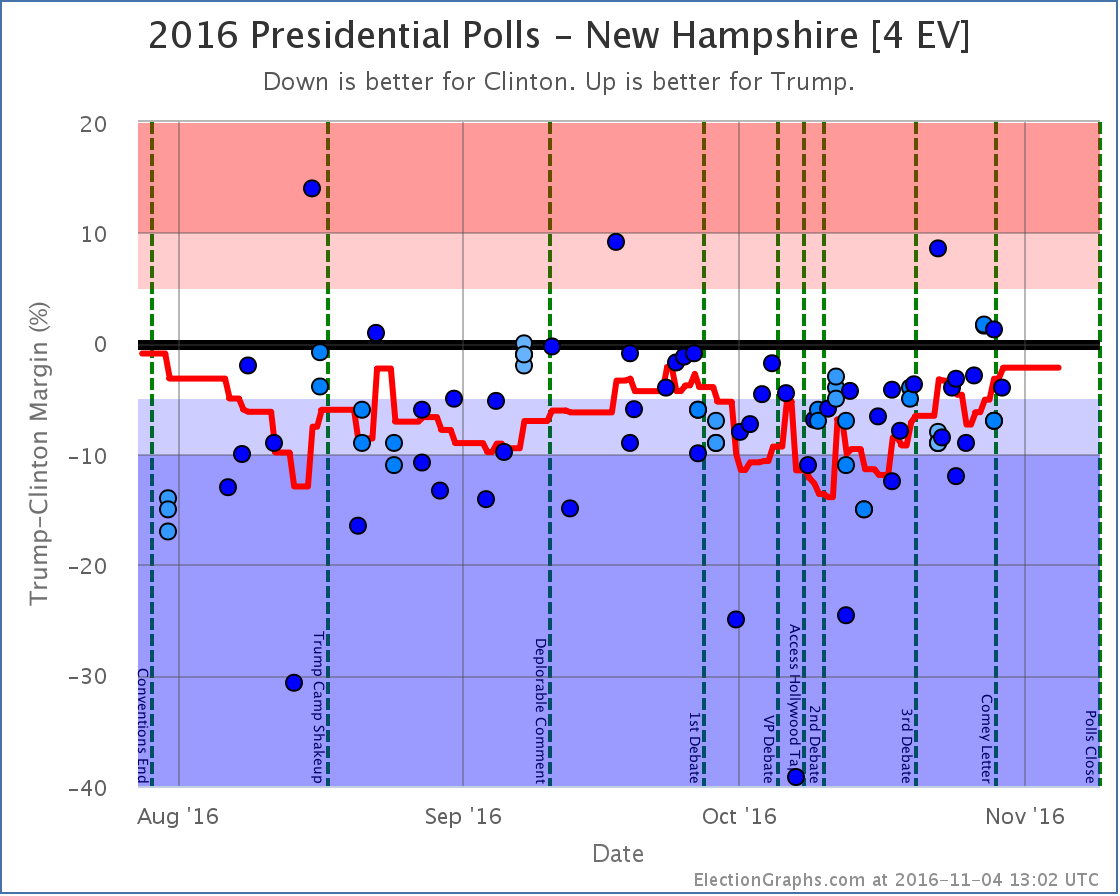
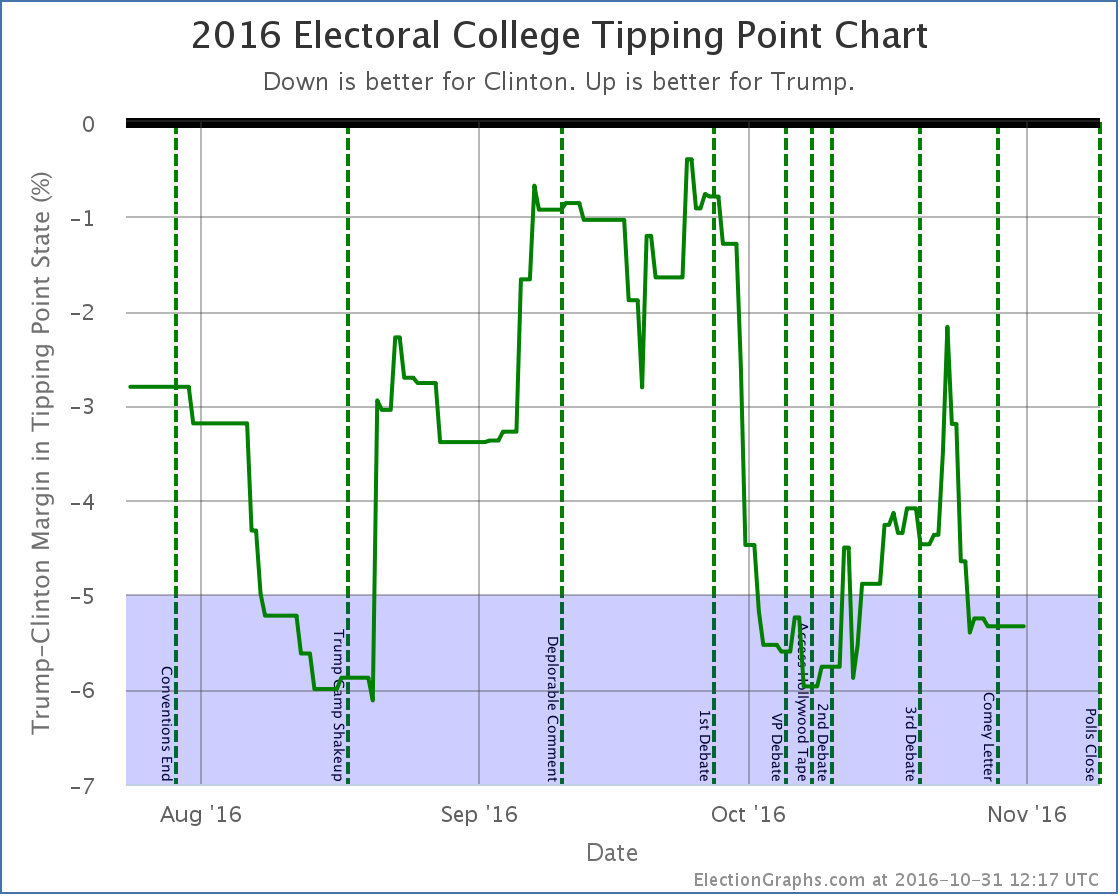
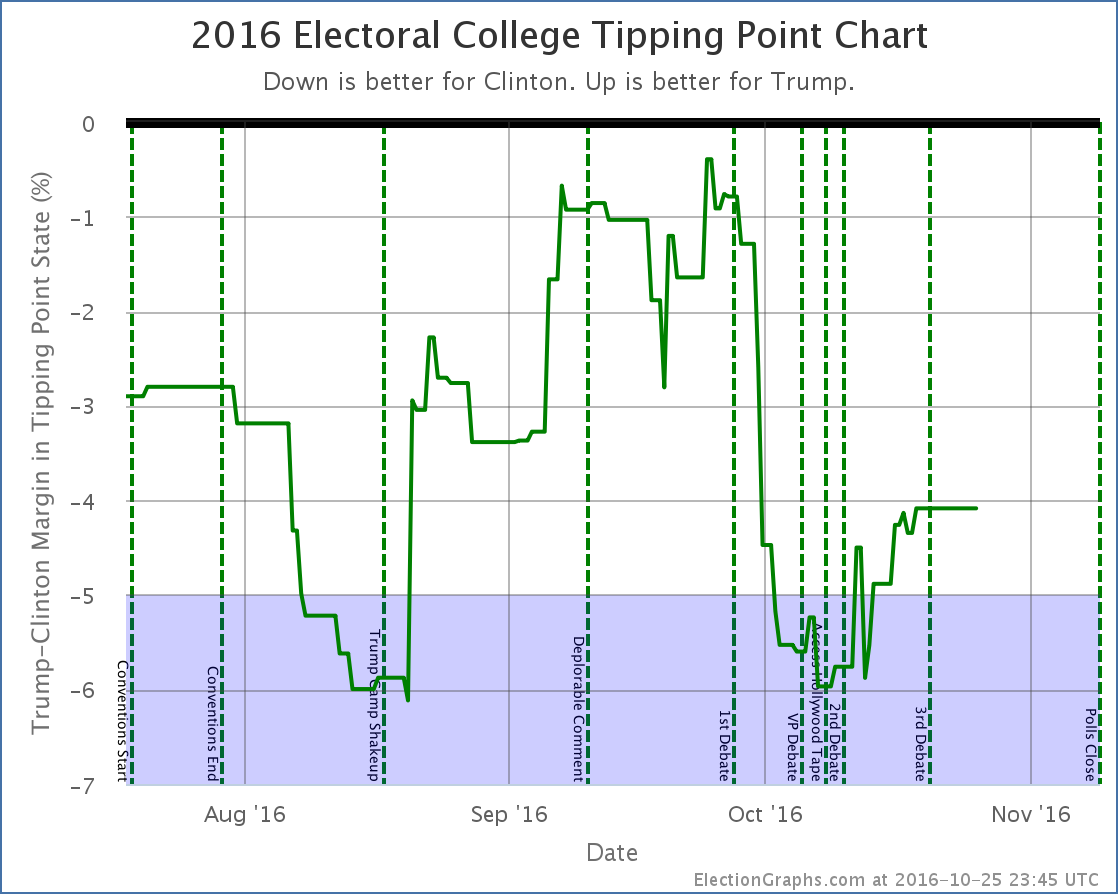
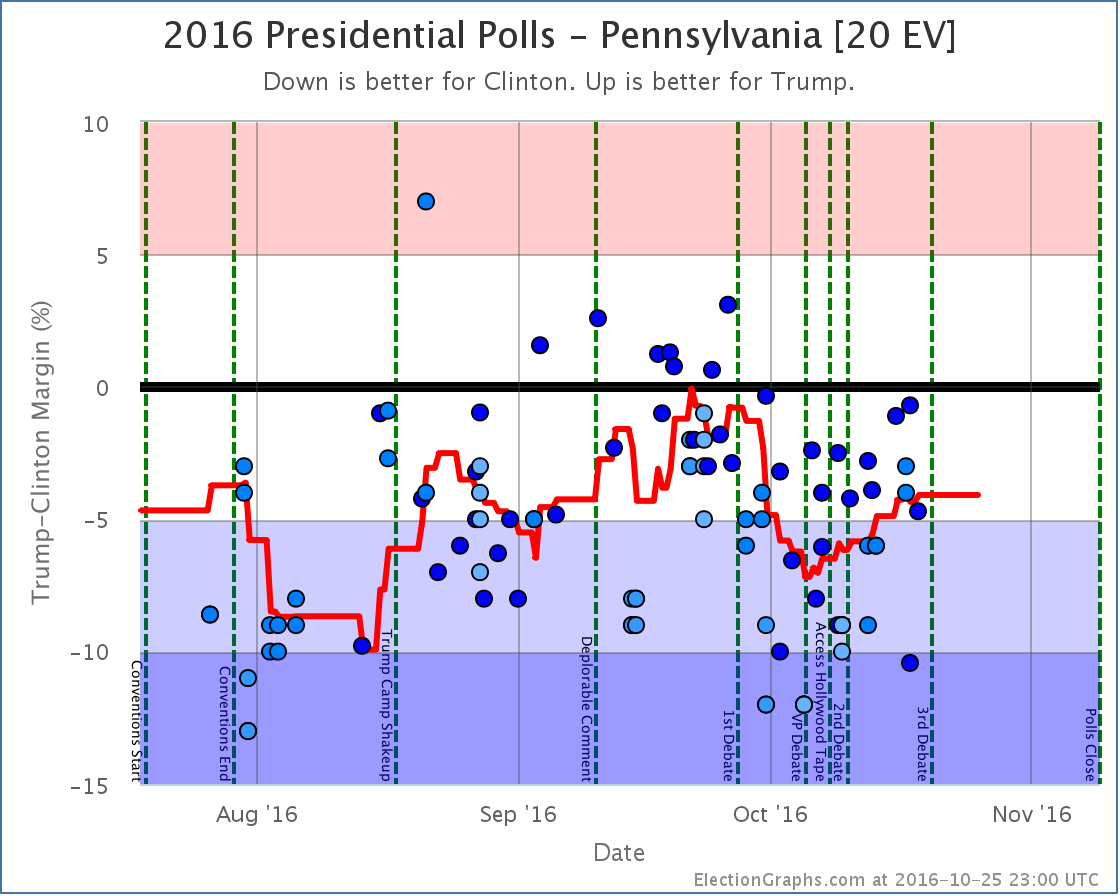
- The tipping point has moved from Clinton by 5.3% in PA to Clinton by only 2.2% in NH
- Clinton’s best case has declined from a 216 EV win to only a 178 EV win
- Trump’s best case has shifted from a 6 EV loss to a 100 EV win
Charts
Discussion
Four days ago Trump had tightened the expected electoral college case, but critical states like Pennsylvania were moving against him, so the job of getting to 270 electoral votes was actually getting harder despite the electoral college gap narrowing.
Not so any more. In the last few days, which added lots of post-Comey polls (as well as some covering the pre-Comey period too) the movement has ALL been toward Trump. There is no mixed message this time. No bright side for Clinton. In the last few days almost all of the polling news has been good for Trump and bad for Clinton.
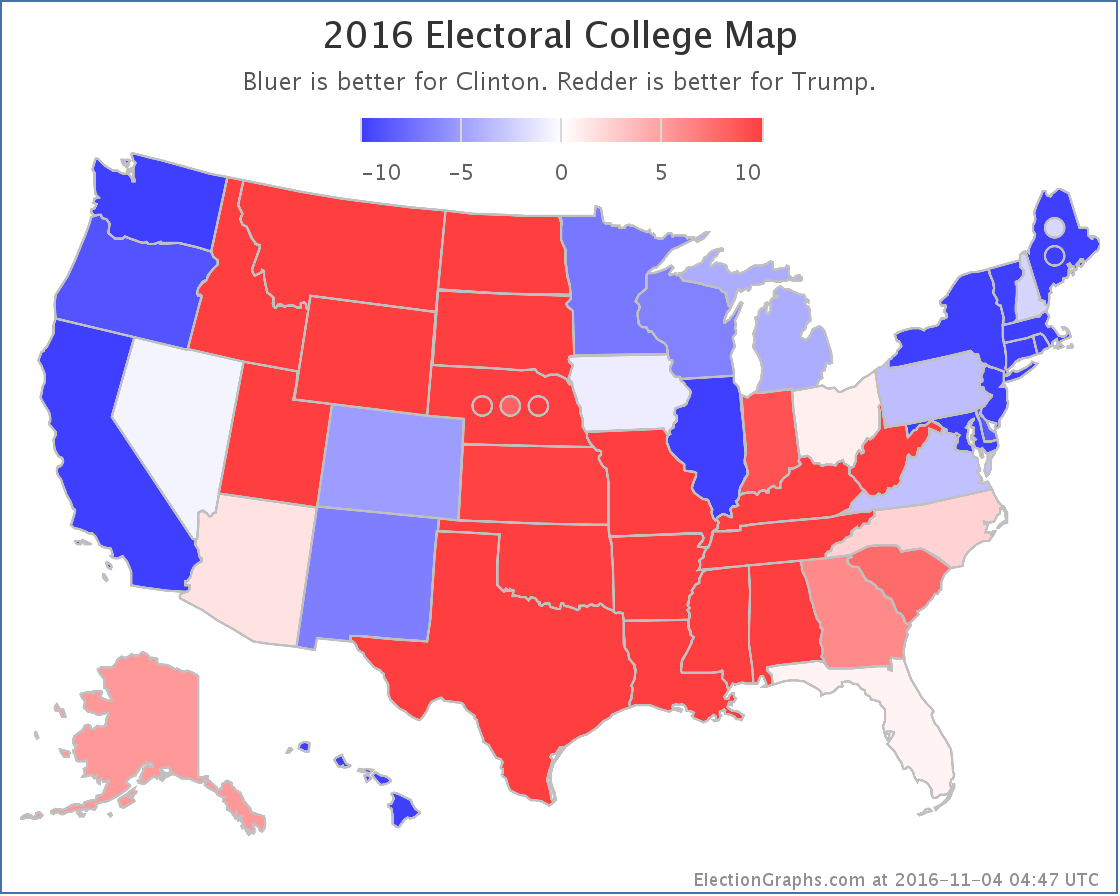
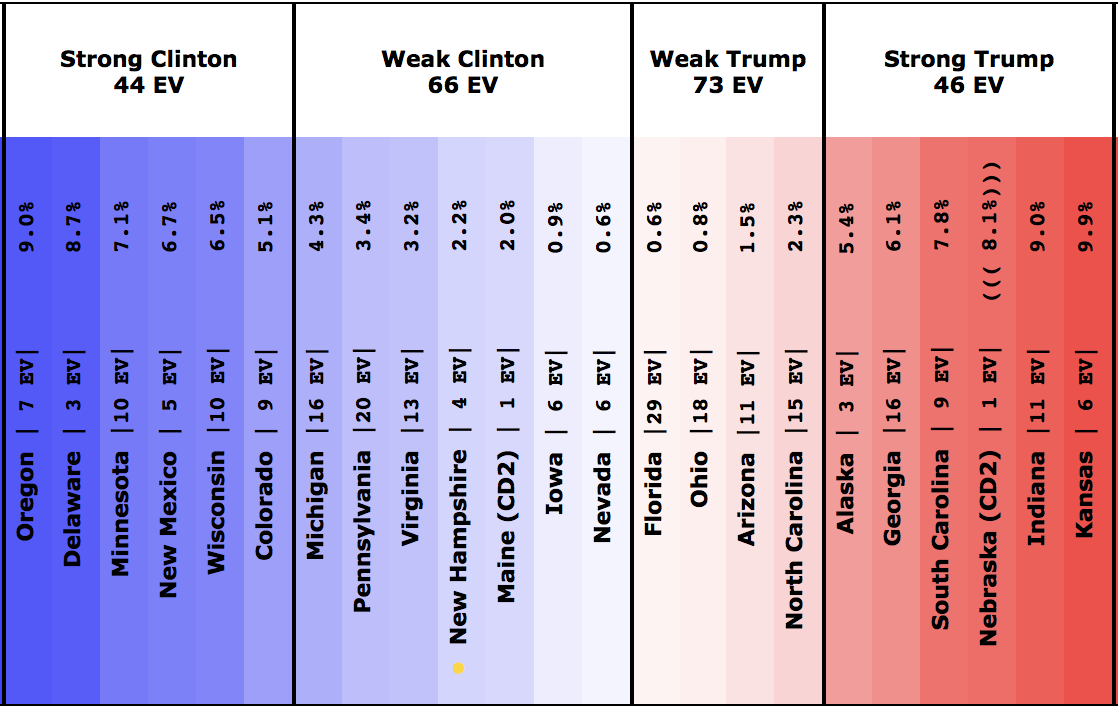
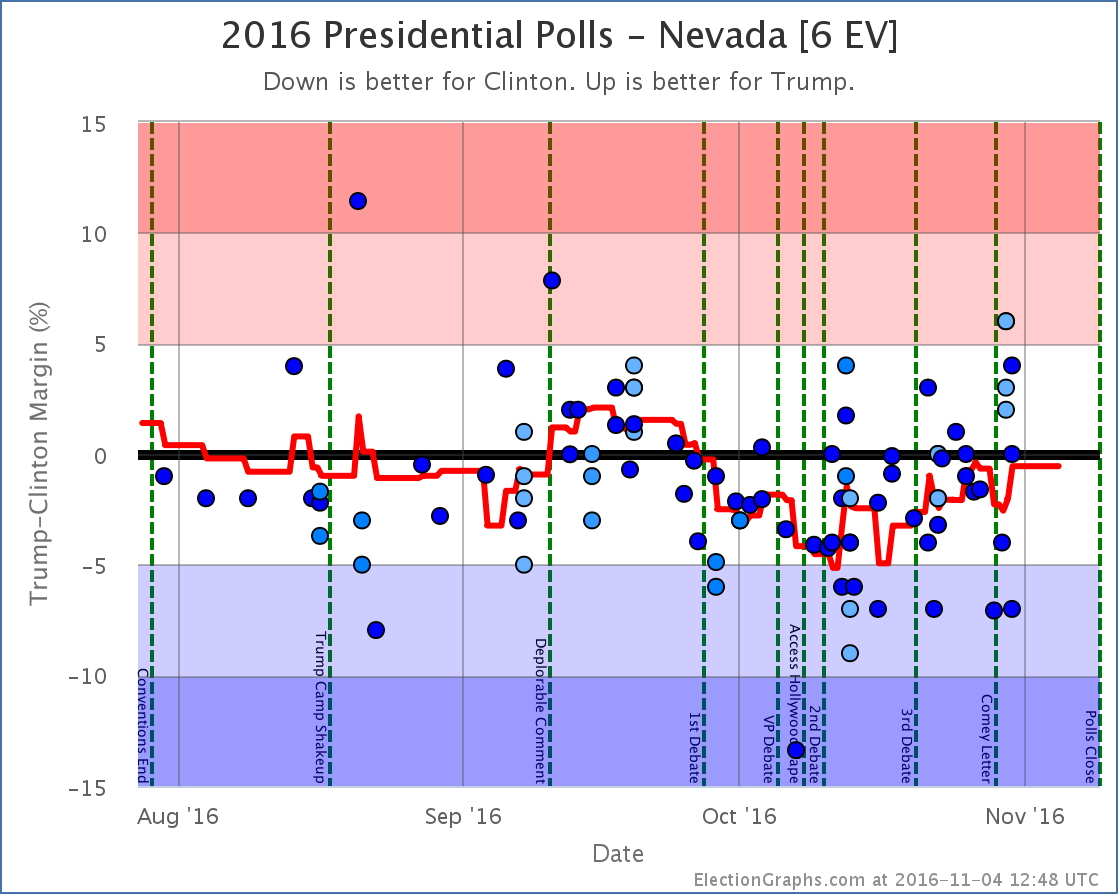
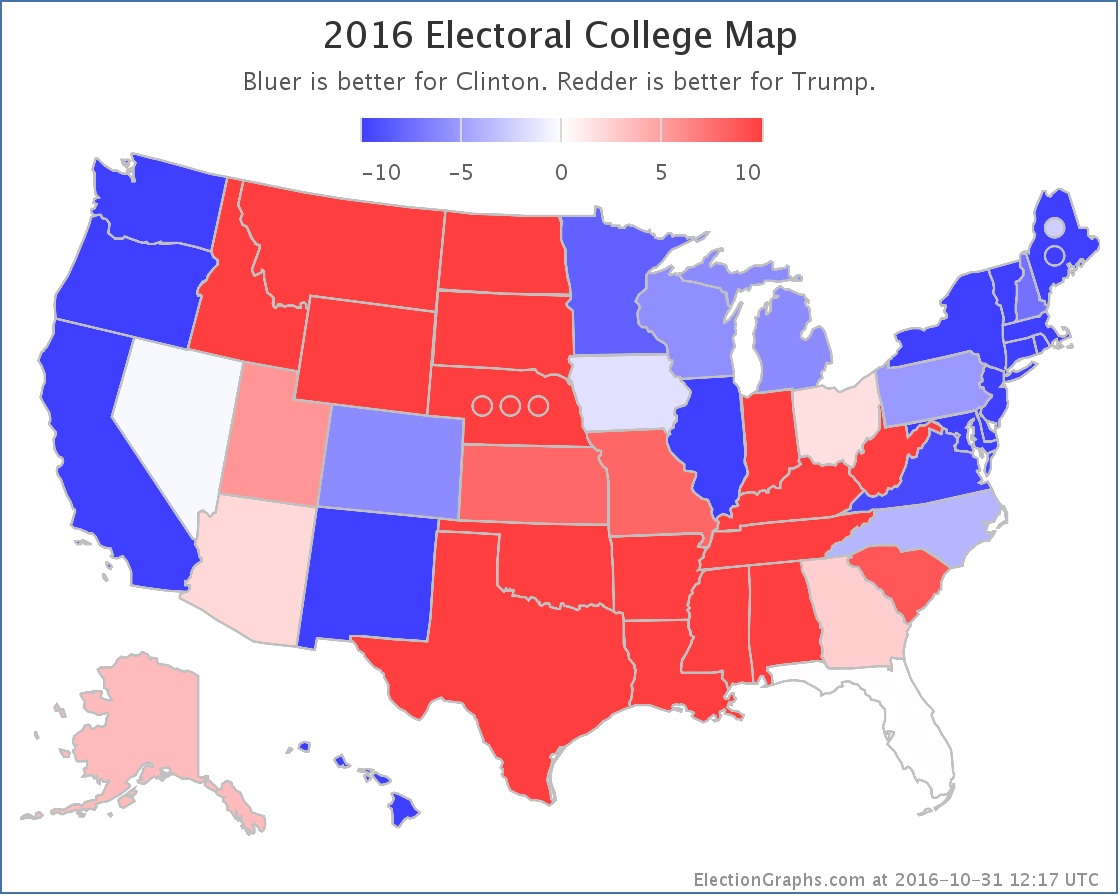
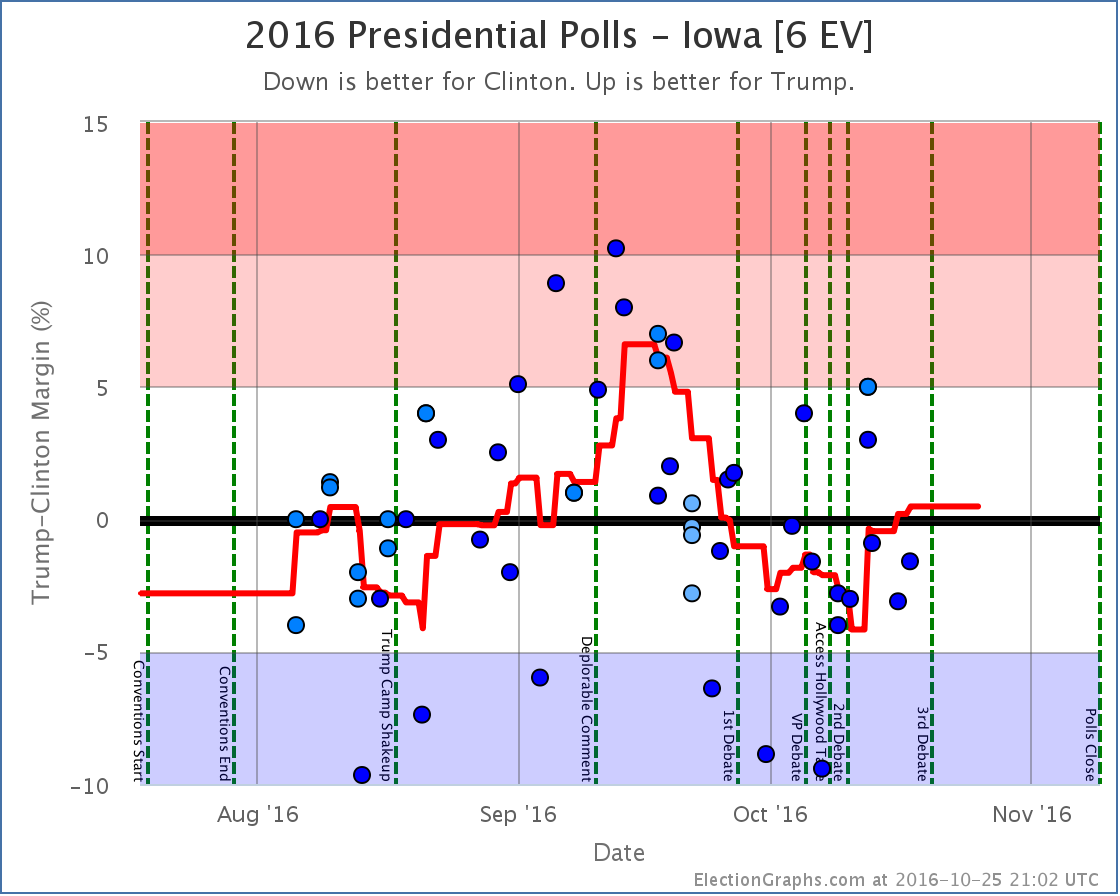
Now, she is still ahead. But Trump once again has a path. The “easiest” path at this point would be to win all the states he is currently leading, then pull in Nevada (0.6% Clinton lead), Iowa (0.9% Clinton lead) and New Hampshire (2.2% Clinton lead). Or he could get any one of those states, plus Virginia (3.2% Clinton lead). Or just Pennsylvania (3.4% Clinton lead). Or just Michigan (4.3% Clinton lead).
All of these states are ones where a few days ago Clinton’s lead was much stronger. Trump has been making gains all over the map.
How much of this is Comey? Some for sure, but as I’ve pointed out before, the expected electoral college been moving slowly toward Trump for weeks. But that did seem to have somewhat stalled out. The tipping point was moving back toward Clinton. With the Comey letter the move toward Trump came back with a vengeance.
We’re not quite at Trump’s highs from September, but we are getting near there. Now, even at his best point in September, Trump was still losing to Clinton. But it was close. And it is close again now. The Trump surge is real, and he has made this a race again.
The tipping point is at 2.2%. That is within the zone where a systematic polling error or a last minute news event that happens too late to be captured in polls could reverse the result. A Trump win COULD happen. This is not impossible.
Clinton is still heavily favored though.
This site does not produce “odds”, just the range of “you shouldn’t be completely shocked” outcomes, which is intentionally pretty wide. Right now, a Clinton win is expected, but a Trump win is not out of the question.
Lots of places do produce odds though. Here is the current rundown in terms of percentage chance of Trump winning:
I was asked on Twitter yesterday for my odds. Given that my model does not produce a number for this, I was reluctant to give an exact number. But I gave a range and said between 5% and 10%. With a few additional polls added since then, I’d go toward the higher end of that range. Maybe 7% to 10%.
Why that range?
Trump is getting very close to Clinton, but in all the prior polling movement in the campaign Trump has never been able to actually pull into the lead. It seems like he reaches a ceiling and gets to the point where to gain any further he has to not just convince the wishy-washy undecideds, but he has to start getting actual Clinton supporters to flip, which seems like a much harder job.
But until September I thought Trump’s ceiling was matching Romney’s performance in 2012. With current polling, Trump wins every state Romney won, then adds Florida and Ohio. So levels that look like ceilings can indeed be broken. Another bad news cycle for Clinton, or even some systematic error in the polling could easily put us there.
So 7% to 10% seems reasonable.
If a Trump win does happen, surprise is warranted, because he would have beaten the odds, but not shock, because he IS close.
If Trump was a hurricane that was four days out, we would be “within the cone”. Toward the edge of the cone to be sure. We are not directly on the projected path. We expect it to miss us. But we would be making preparations just in case the storm swerves and hits us.
4.3 days until we stop looking at polls and start looking at actual election results.
State Details
The following are the detailed charts for all the states that influenced the national changes outlined above.
Moving from Clinton to Trump
Moving into reach for Trump
Moving out of Clinton’s reach
Other states that helped move the tipping point
A note about McMullin
Election Graphs is designed around showing the Republican – Democrat margin, and there is not enough time before the election to revamp the site to properly account for 3rd parties that are strong enough to have a shot at winning electoral votes.
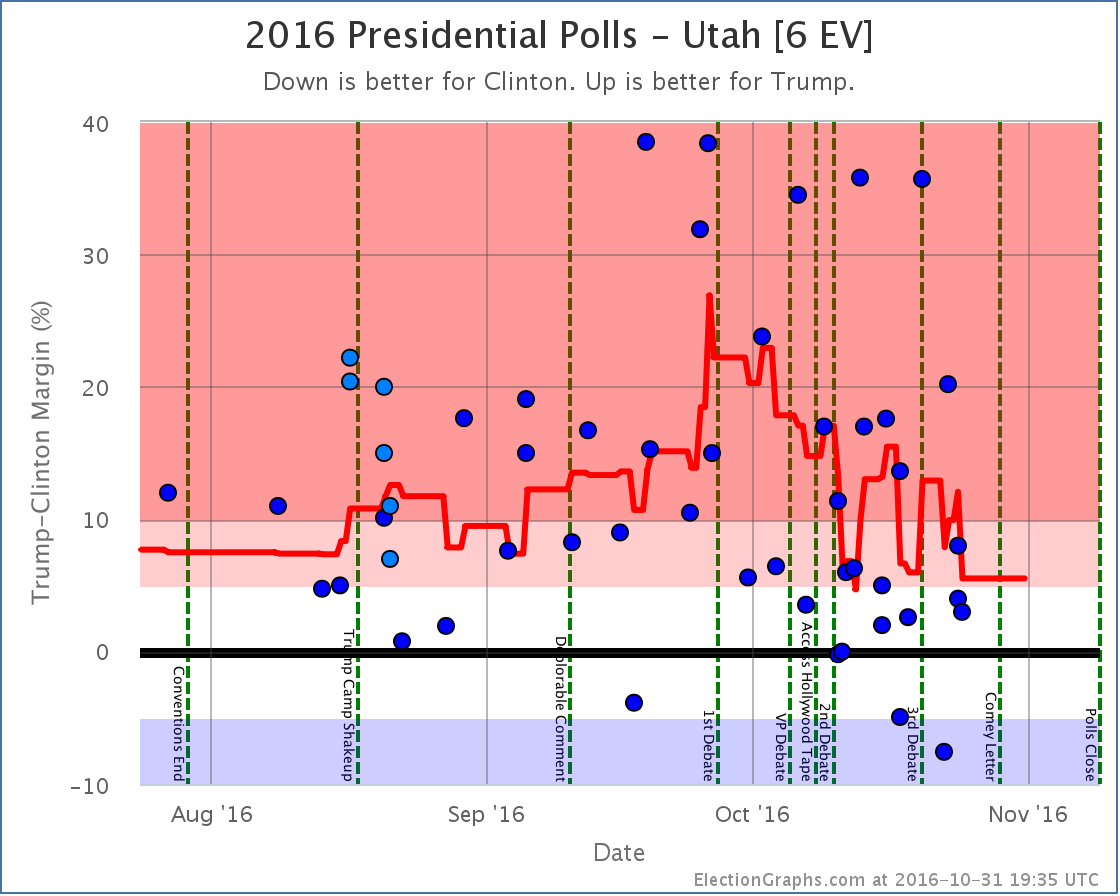
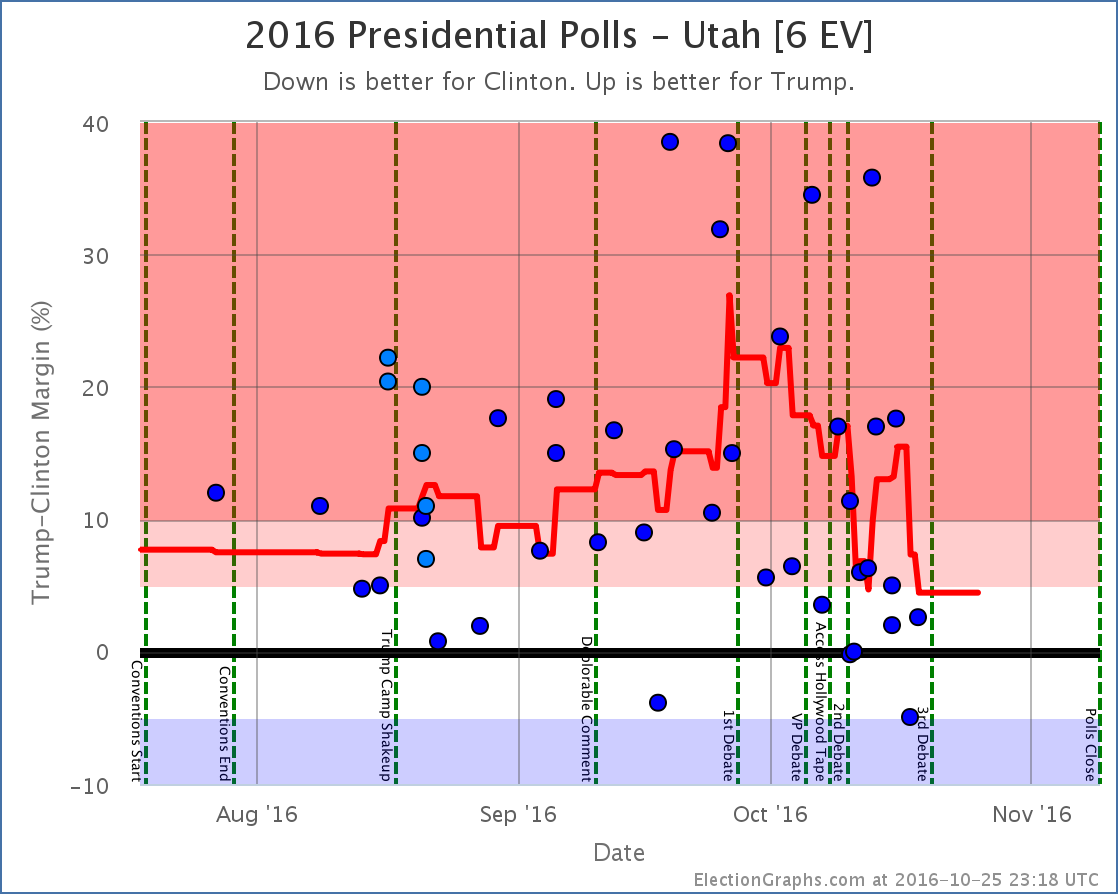
Right now the Real Clear Politics average in Utah has McMullin 12.0% behind the lead. The 538 average in Utah has him 10.3% behind the lead. Although McMullin was a lot closer than anyone expected, he never got closer than 5% to the lead in Utah in these averages and now appears to be fading. 538 still has him in second place, but it doesn’t seem likely at this point that he will win electoral votes.
If that changes, I will of course note it in these updates and on the Election Graphs site.
For more information…
This post is an update based on the data on ElectionGraphs.com. Election Graphs tracks a state poll based estimate of the Electoral College. All of the charts and graphs seen in this post are from that site. Additional graphs, charts and raw data can be found there. Follow @ElectionGraphs on Twitter or like Election Graphs on Facebook to see announcements of updates or to join the conversation. For those interested in individual general election poll updates, follow @ElecCollPolls on Twitter for all the polls as they are added. If you find the information in these posts interesting or useful, please consider visiting the tip jar.
Edit 17:45 UTC to fix some wording in the hurricane comparison paragraph.
Edit 19:53 UTC to fix a Comey/Comet autocorrect.
States with new poll data added since the last update: All 50 states, DC, and the Maine congressional districts.
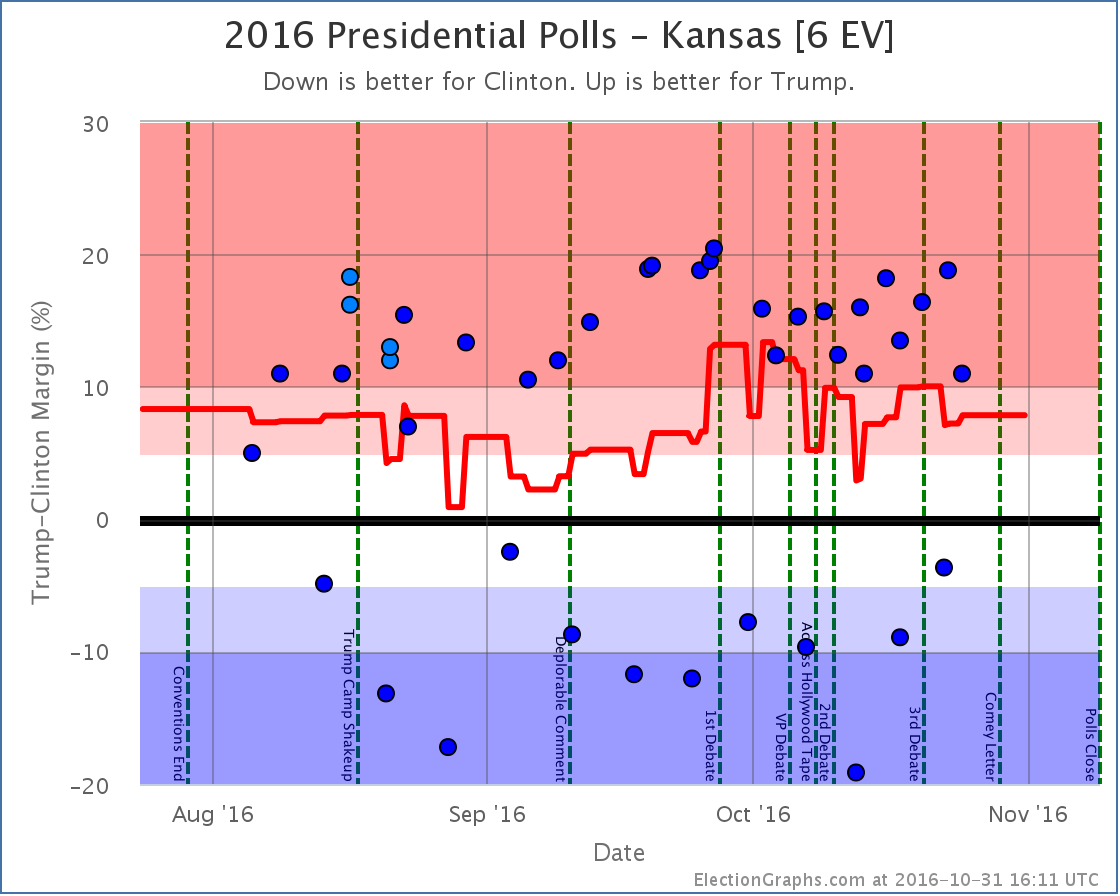
Notable changes in: Florida (29), Pennsylvania (20), Arizona (11), Iowa (6), Kansas (6), Utah (6), Alaska (3), and the tipping point.
National Summary
It has been about five days since the last update. Since then the movement has been decidedly mixed.
Note that as of this update, no polls have been included that contain interviews done after the release of the “Comey Letter”.
Good for Trump:
- The expected result has moved from a 130 EV Clinton win to only a 62 EV Clinton win
- Clinton’s best case has declined from a 234 EV win to only a 216 EV win
Good for Clinton:
- The tipping point moves from Clinton by 4.1% in PA to Clinton by 5.3% in PA
- Trump’s best case declines from a 34 EV win to a 6 EV loss
Charts
Discussion
While some metrics have moved in Trump’s direction and others in Clinton’s, in the end this picture is bad news for Trump. Why is that? Fundamentally, doesn’t the fact that the “expected case” moved toward Trump mean that he is doing better?
Well, it means the margin he will lose by is getting smaller, yes. However, if you are trying to look for scenarios where Trump would actually catch up and win, the tipping point is what you want to be looking at. To win he has to move the tipping point state (or states he is even further behind in) over to his side of the line. And the tipping point is moving further away at the moment.
If you look at the tipping point chart you can see that Trump had indeed been making progress on the tipping point starting about when the Access Hollywood tape dropped. But that started to reverse around the 23rd. At the same time that his expected electoral college result was still improving.
This is still confusing. What is happening? Well, all the states aren’t moving in lock step in reaction to events. A number of close states have moved toward Trump, like Florida for instance. But key states like Pennsylvania have been moving away from him. Because of this divergence, we can have Trump improving his electoral college “score” while simultaneously the path to 270 electoral votes gets harder.
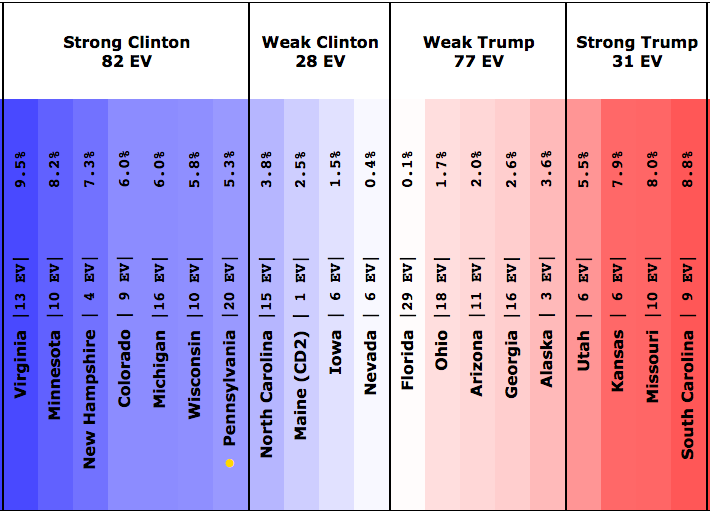
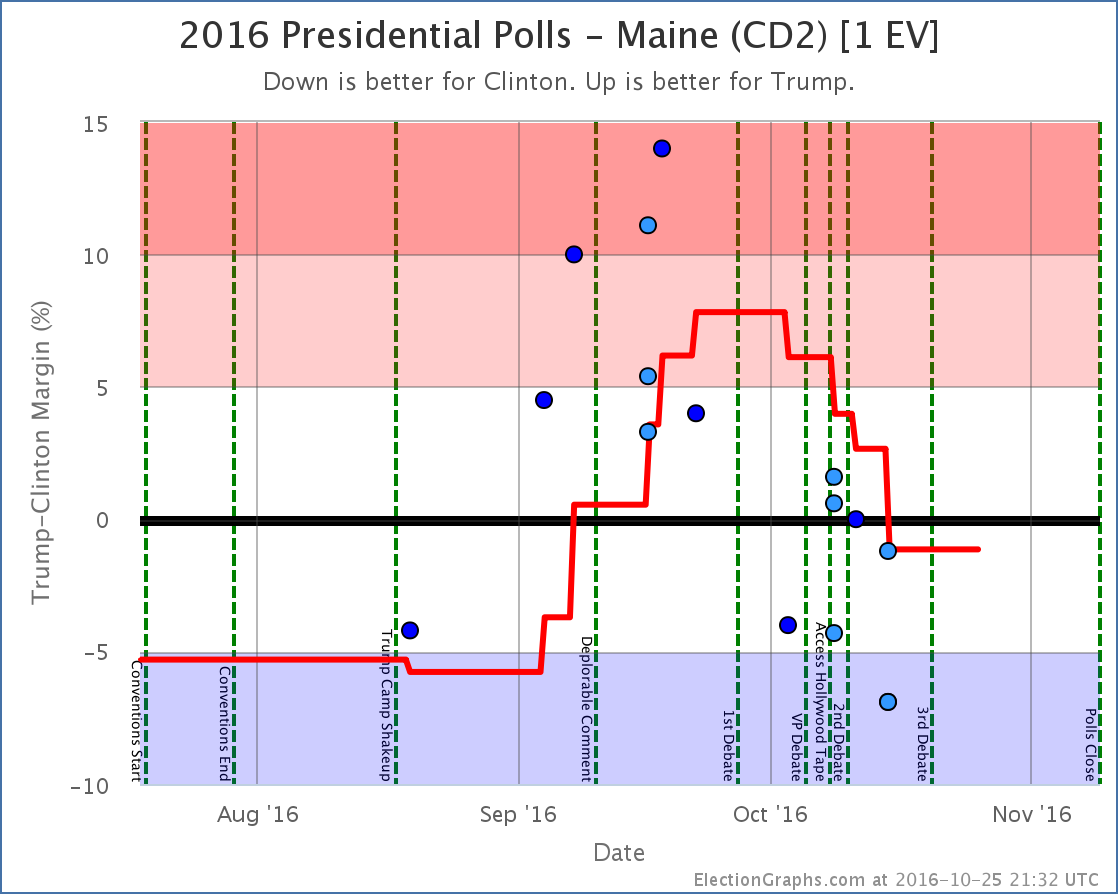
And in fact, at the moment, 270 looks out of reach for Trump. Look at the spectrum of the close states above. Right now Trump could win every state he is ahead in, then also pull over the states where he is close… Nevada (0.4% Clinton lead), Iowa (1.5% Clinton lead), Maine CD2 (2.5% Clinton lead), and North Carolina (3.8% Clinton lead)… and Trump would still lose by 6 electoral votes.
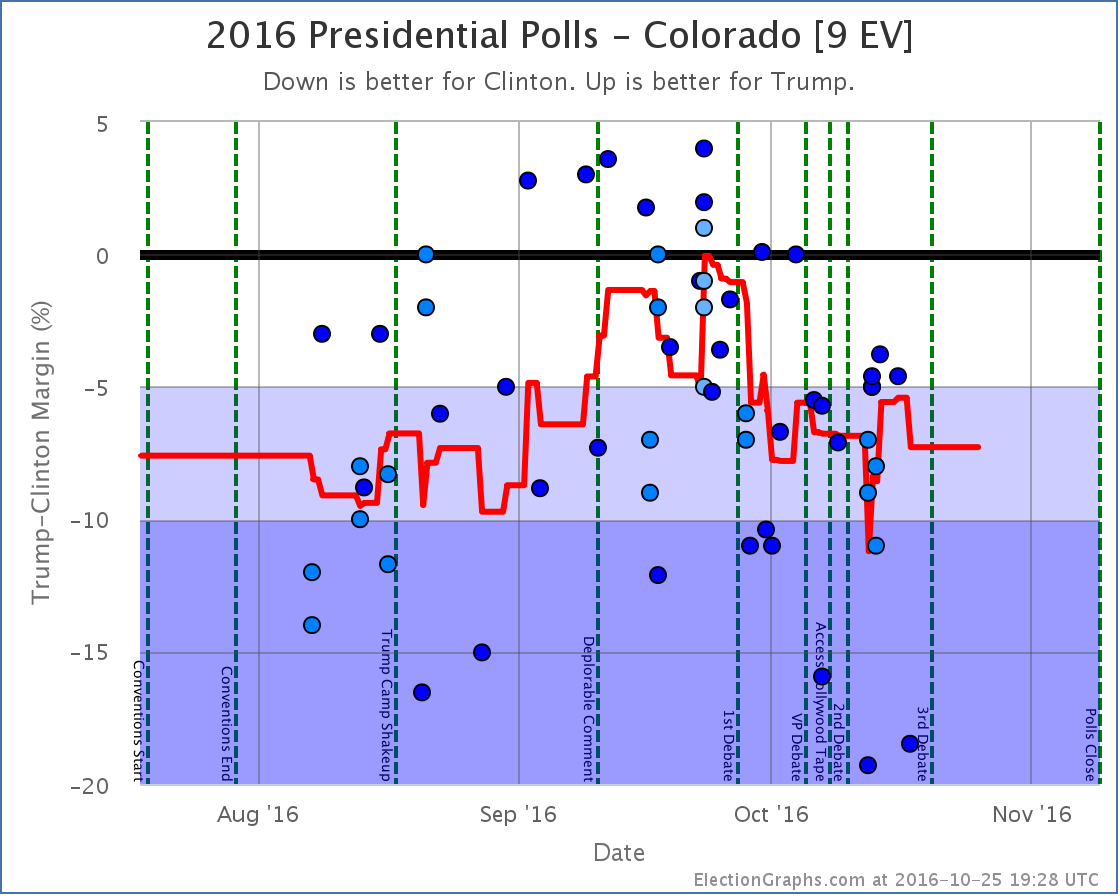
To win, Trump has to win all of the close states, plus Pennsylvania, where Clinton has a 5.3% lead at the moment… or one of the other larger “Strong Clinton” states… Wisconsin, Michigan, Colorado, Minnesota, or Virginia… all of which Clinton currently leads by even bigger margins. (New Hampshire isn’t enough to push Trump over the edge with only 4 EV.)
This is a really big pull with so little time left. The Trump side seems to be hanging their hopes on the fallout from the Comey Letter. This may cause some movement, but early indications are that almost all voters made up their minds on the Clinton email issue and if it mattered to them long long ago, and this is unlikely to change many minds.
We’ll start to see if there is any movement due to the letter within a few days. But there just are not that many days left. Sites that give odds for Trump winning range from less than 0.01% on the low side to 24.4% on the high side. The median odds seem to be around 5%. That isn’t impossible. But those odds are low enough that a Trump win would be a very big surprise.
There is another goal that Trump has a much better shot at though. If the election ends up exactly how things look today, Trump will lose by only 62 electoral votes. That would mean that Trump would do better than both McCain (lost by 192 EV) and Romney (lost by 126 EV). It may not be an actual win, but Trump improving on the performance of both previous Republican candidates may give the message to Republicans that a Trump like candidate in 2020 might be the way to go rather than returning to Romney or McCain style Republicanism.
We shall see.
8.1 days left until we start getting actual election results.
We are almost there.
State Details
The following are the detailed charts for all the states that influenced the national changes outlined above.
Moving from Clinton to Trump

Moving from Trump to Clinton

Now a possible Clinton pickup
Now out of Trump’s reach
Now out of Clinton’s reach
Also influencing the tipping point
A note about McMullin
Election Graphs is designed around showing the Republican – Democrat margin, and there is not enough time before the election to revamp the site to properly account for 3rd parties that are strong enough to have a shot at winning electoral votes.
Right now the Real Clear Politics average in Utah has McMullin 6.0% behind the lead. The 538 average in Utah has him 7.3% behind the lead. If/when McMullin is within 5% according to either of these averages, I will add notes to both the Utah and National pages about the possibility of McMullin winning Utah’s 6 electoral votes.
For more information…
This post is an update based on the data on ElectionGraphs.com. Election Graphs tracks a state poll based estimate of the Electoral College. All of the charts and graphs seen in this post are from that site. Additional graphs, charts and raw data can be found there. Follow @ElectionGraphs on Twitter or like Election Graphs on Facebook to see announcements of updates or to join the conversation. For those interested in individual general election poll updates, follow @ElecCollPolls on Twitter for all the polls as they are added. If you find the information in these posts interesting or useful, please consider visiting the tip jar.
States with new poll data added since the last update: All 50 states, DC, and the Maine congressional districts
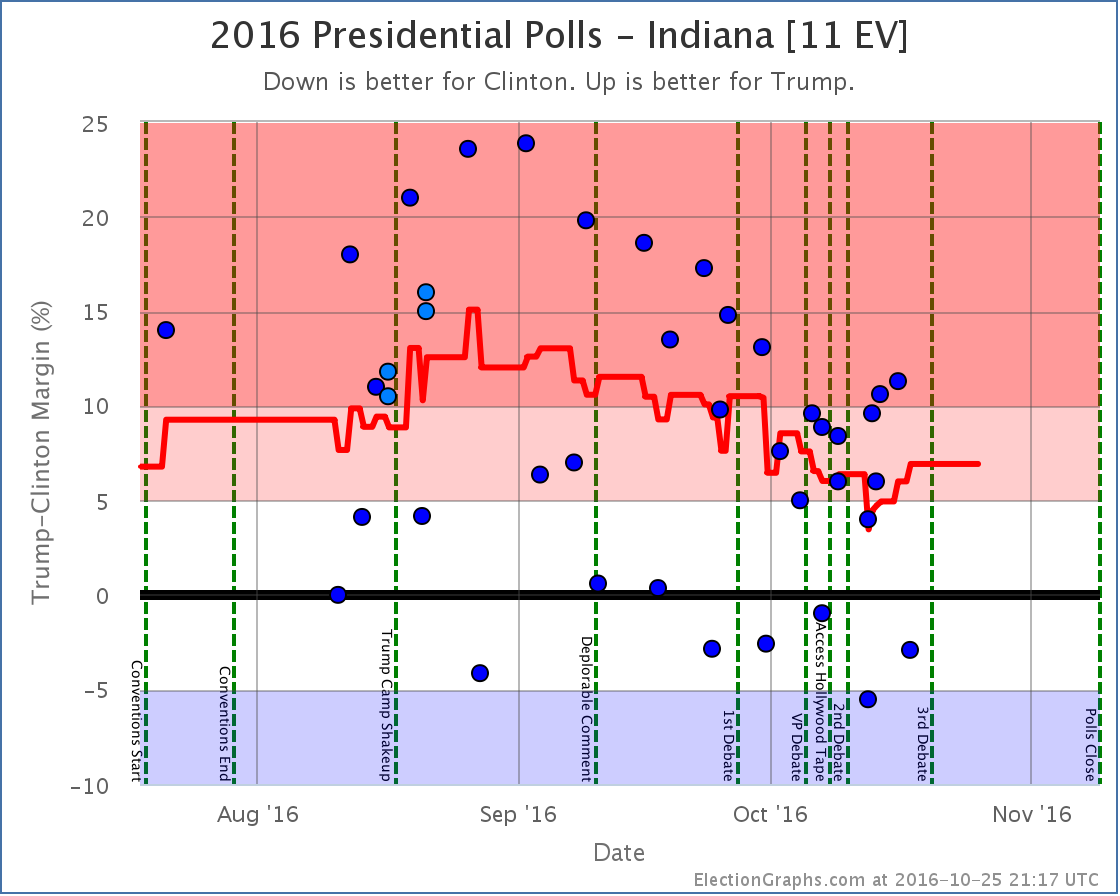
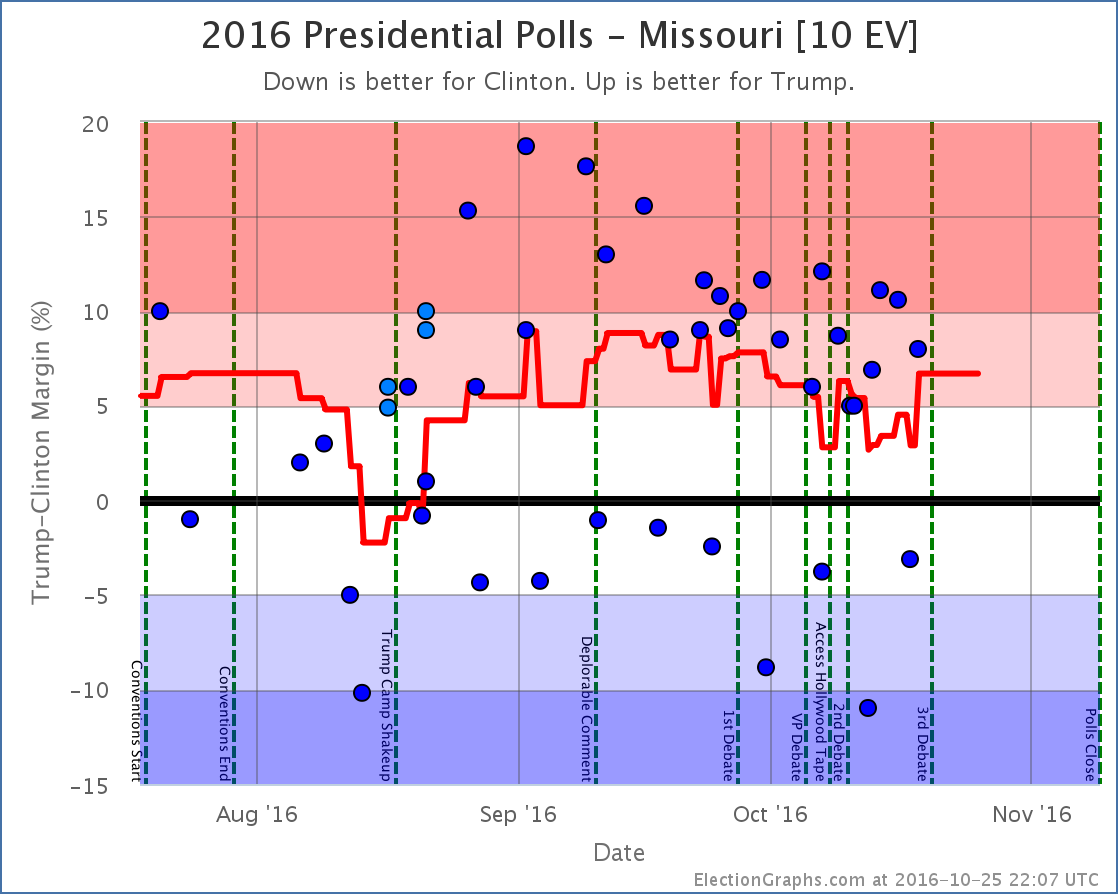
Notable changes in: Iowa, Georgia, Utah, Alaska, Indiana, Missouri, Maine (CD2), and the tipping point
National Summary
It has been about six days since my last update and the trend since then has been toward Trump. Here are the stats:
Good for Trump:
- The expected result changed from a 140 EV Clinton win to a 130 EV Clinton win
- The tipping point moved from Clinton by 4.9% in PA to Clinton by 4.1% in PA
- Clinton’s best case declined from a 238 EV win to only a 234 EV win
No change
- Trump’s best case remained a 34 EV win
Charts
Discussion
With all the data we have now, looking back to the release of “the tape” on October 7th the overall movement has been mixed. Both candidates have improved their “best cases” as states that were not close have gotten closer… on both sides. So this doesn’t show a move toward one candidate or another, but rather some red states getting less red while simultaneously some blue states got less blue.
Some of the really close states moved across the center line… in both directions… resulting in a net movement of the expected electoral college margin toward Trump by 24 electoral votes… but the most indicative sign of movement toward Trump is actually the tipping point.
Since the release of the tape the tipping point has moved from Clinton leading by 6.0% (in Virginia) to Clinton leading by only 4.1% (in Pennsylvania). So… with some of the worst news cycles for a politician in decades, with day after day after day of negative revelations… Trump improved his position by nearly 2%.
How to interpret this? My best guess… Most people were pretty well set on their Trump vs Clinton choice prior to the reveal of the tapes and the subsequent sexual assault allegations. In the wake of the first debate the part of the public that was persuadable had already swung us from near Trump’s ceiling to near Trump’s floor. With the string of additional bad news, very few die hard Trump supporters moved away from him, while some number of those persuadables viewed this as the press piling on Trump and went back to him thinking this was unfair.
But to be honest, the above is trying to make up a story to fit the numbers. Is it right? I don’t know.
In the end though, the reality is that in the face of a hurricane of bad coverage, Trump has actually improved his position.
Despite the improvement, Trump is still losing by a significant margin, but Trump’s best case does still includes a win.
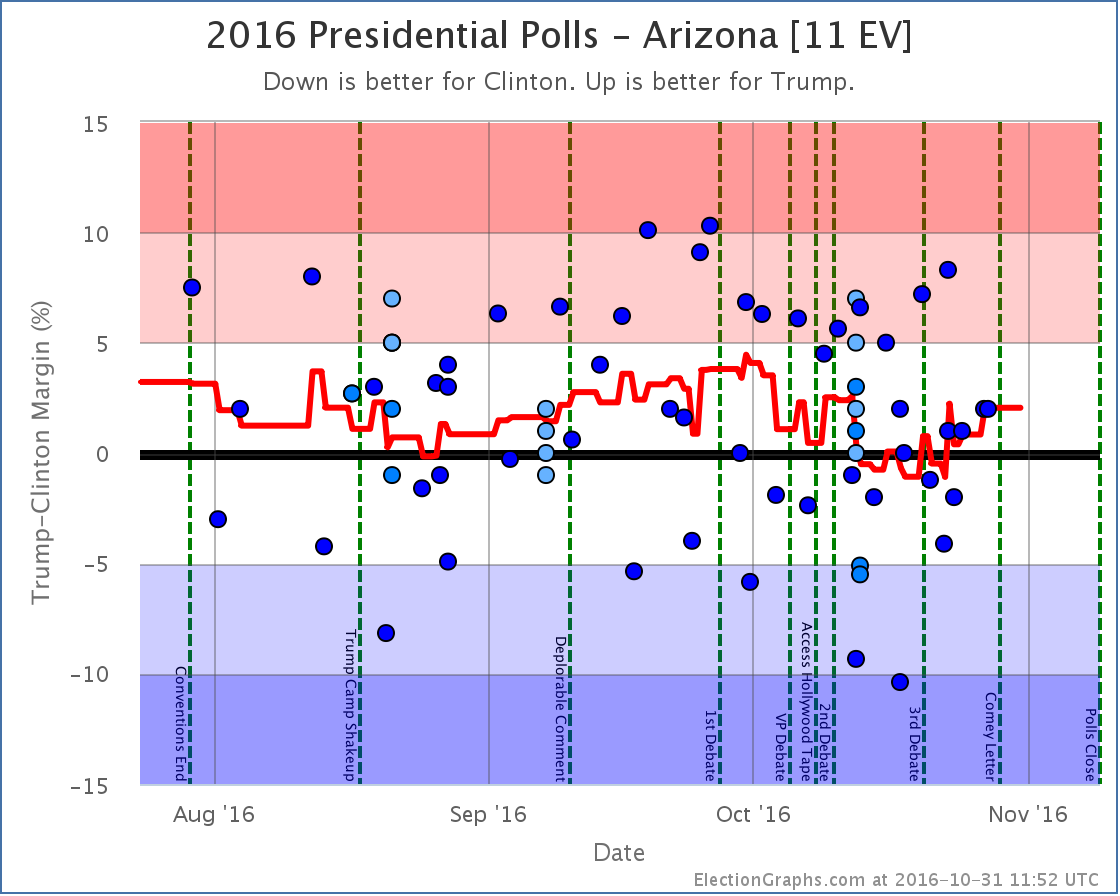
If he keeps all the states he leads, then flips Arizona, North Carolina, Florida and Pennsylvania, he could still pull out a narrow win. Arizona is close enough it could flip back easily enough. North Carolina and Florida have both been back and forth over the past couple months, so seeing them go red again would not be shocking.
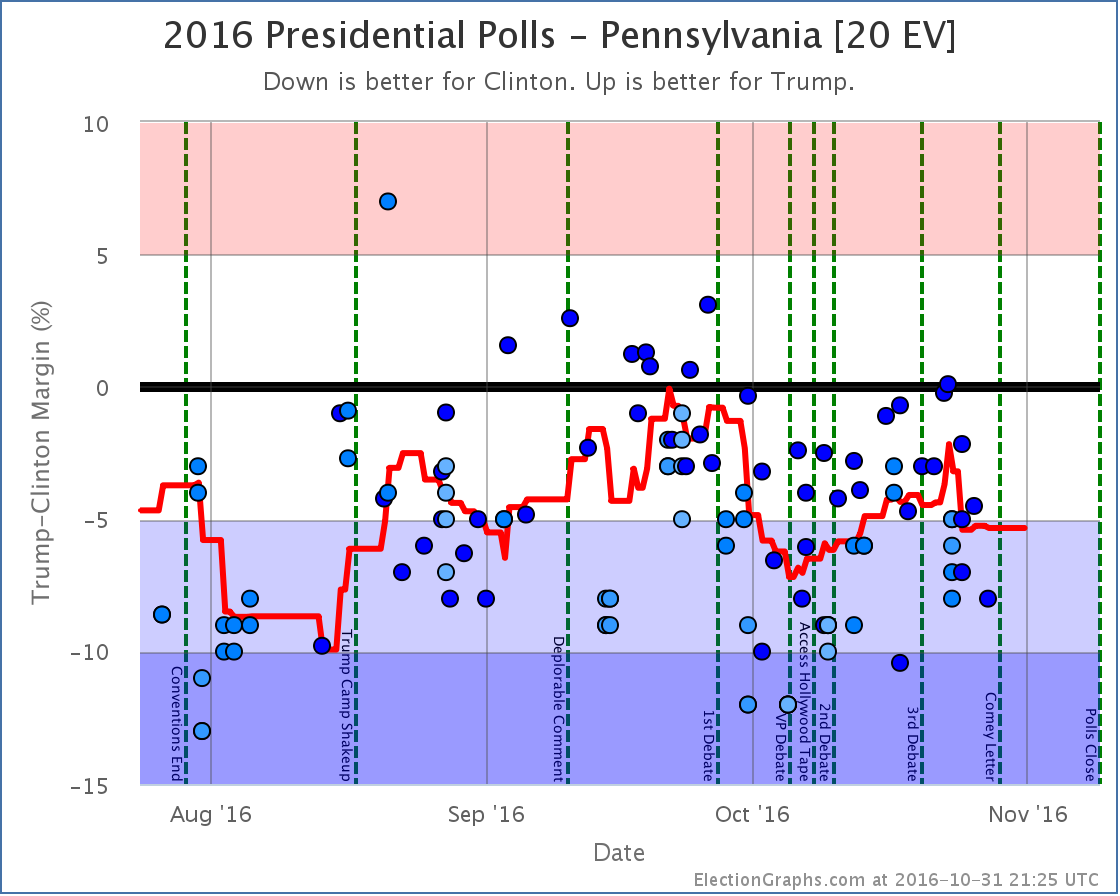
Pennsylvania is the hard pull. While he made it close in September, Trump has never led in Pennsylvania. And Trump needs Pennsylvania to win. Right now, this is Clinton’s firewall.
Clinton would clearly like to be leading in Pennsylvania by more than 4.1%… but even at that margin, it is a tall wall for Trump to climb.
There are 13.7 days left until the first polls close. With less than two weeks left to go now, it is almost certainly too late for Trump to flip all the states he would need to flip in order to win. But if he manages to continue the trend of the last couple of weeks, it is enough time for him to make it close enough that Democrats will start to panic.
State Details
The following are the detailed state charts for states that influenced the status changes since the last update.
Weak Clinton to Weak Trump
Weak Trump to Weak Clinton
Influencing the tipping point
Now possible Clinton pickups
No longer possible pickups for Clinton
A note about McMullin
Election Graphs is designed around showing the Republican – Democrat margin, and there is not enough time before the election to revamp the site to properly account for 3rd parties that are strong enough to have a shot at winning electoral votes.
Right now the Real Clear Politics average in Utah has McMullin 5.5% behind the lead. The 538 average in Utah has him 8.5% behind the lead. If/when McMullin is within 5% according to either of these averages, I will add notes to both the Utah and National pages about the possibility of McMullin winning Utah’s 6 electoral votes.
For more information…
This post is an update based on the data on ElectionGraphs.com. Election Graphs tracks a state poll based estimate of the Electoral College. All of the charts and graphs seen in this post are from that site. Additional graphs, charts and raw data can be found there. Follow @ElectionGraphs on Twitter or like Election Graphs on Facebook to see announcements of updates or to join the conversation. For those interested in individual general election poll updates, follow @ElecCollPolls on Twitter for all the polls as they are added. If you find the information in these posts interesting or useful, please consider visiting the tip jar.
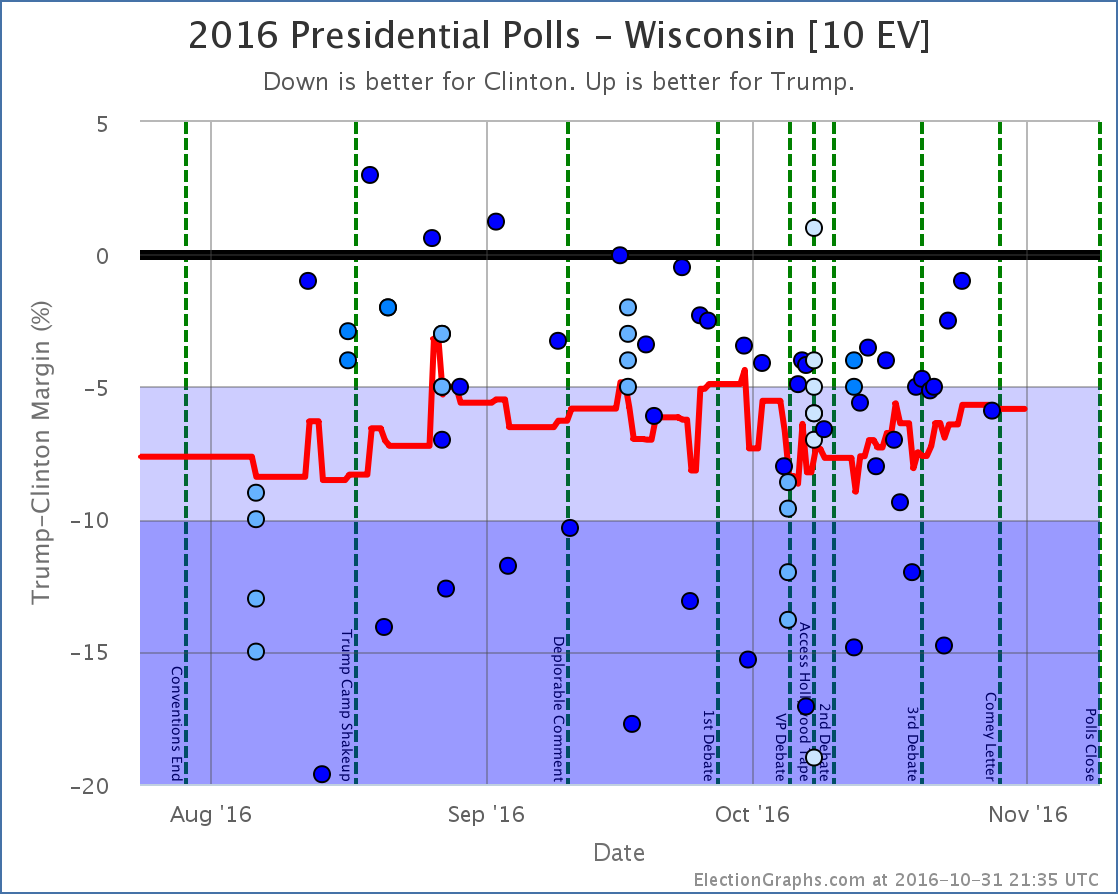
States with new poll data added since the last update: Florida, Pennsylvania, Wisconsin, Ohio, Alaska
Notable changes in: Alaska
National Summary
Only one change this time, but it it continues to be movement toward Clinton. The most recent polls included here now ended Friday, but it is unclear how much, if any, they were impacted by the 2005 Trump tape, since that happened later in the day on Friday.
- Clinton best case moves from a 196 electoral vote win to a 202 electoral vote win
The chart:
Clinton’s best case has been improving slowly since mid-September. She has a bit to go before she matches her peak in August, but if the current trends continue, we may see that again within a week or so as the impacts from the 2005 Trump tape and the second debate start to be visible in the state polls.
9.3 days until the next debate. 29.3 days until we start getting actual election results. We are in the final stretch.
State Details
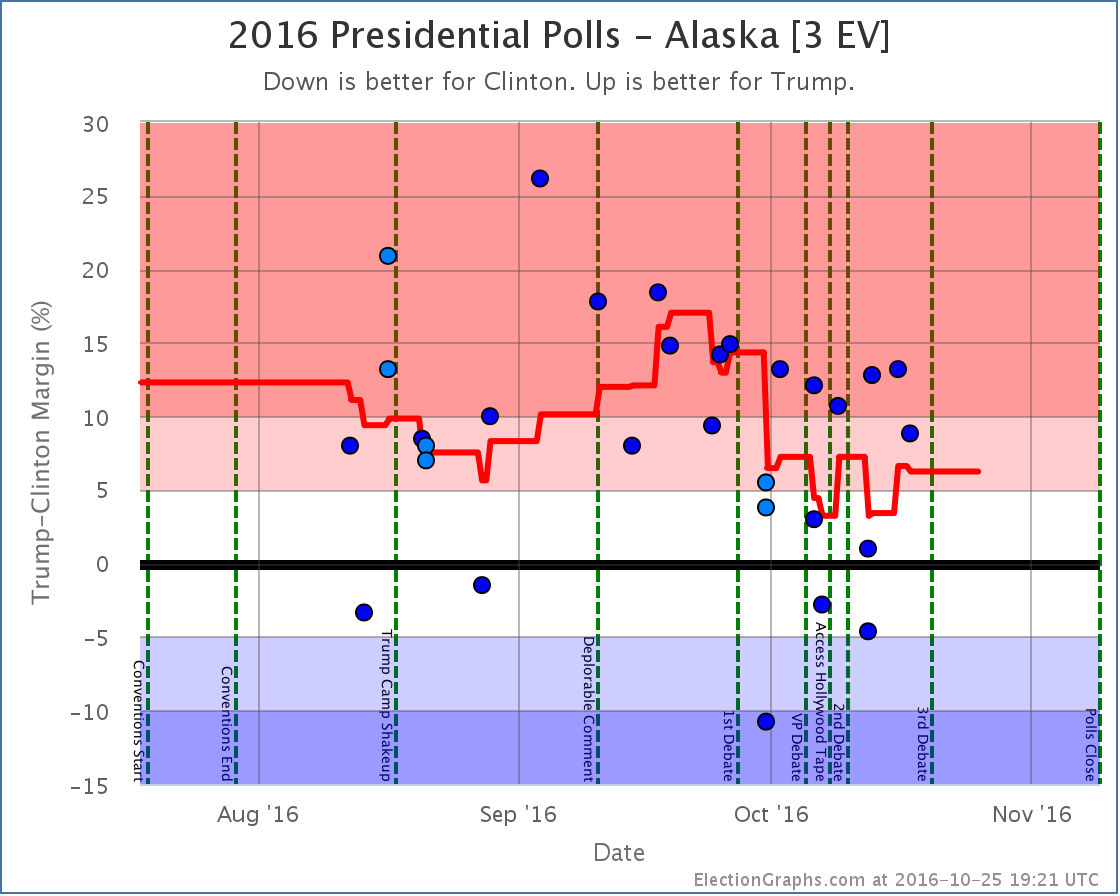
Moving into play for Clinton
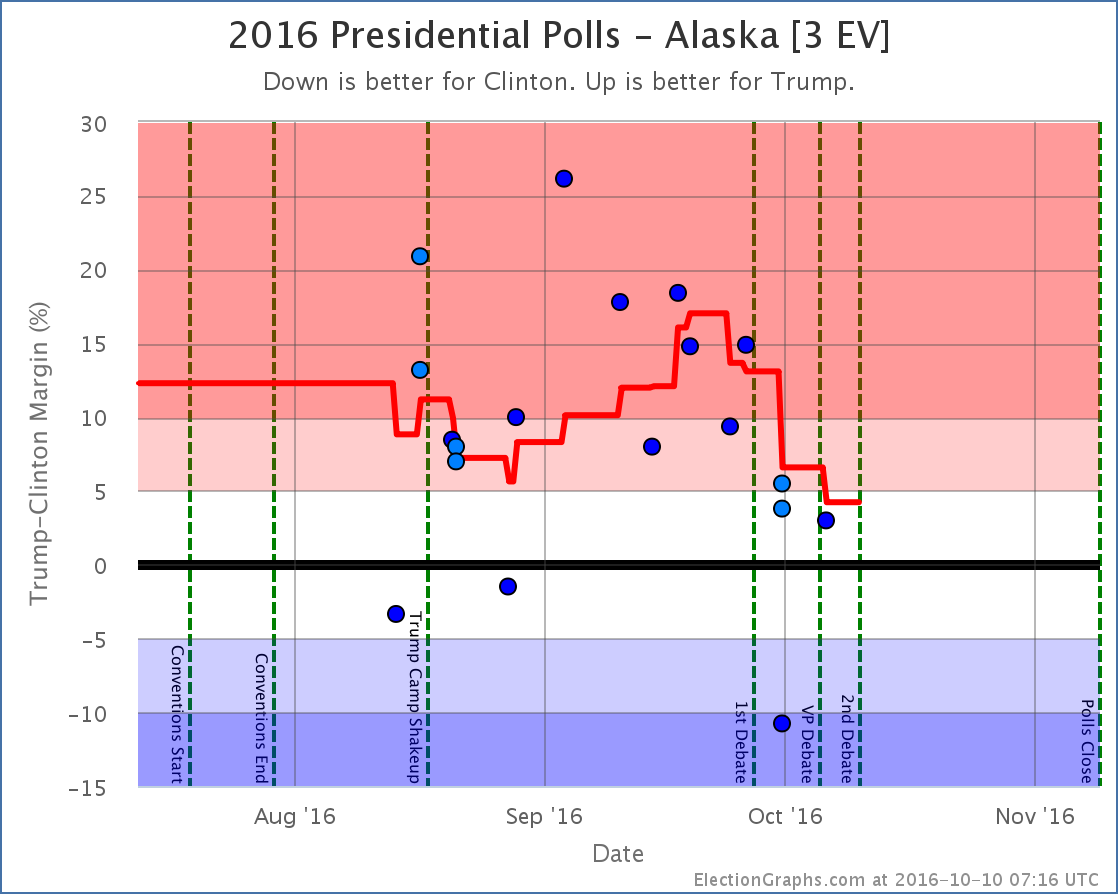
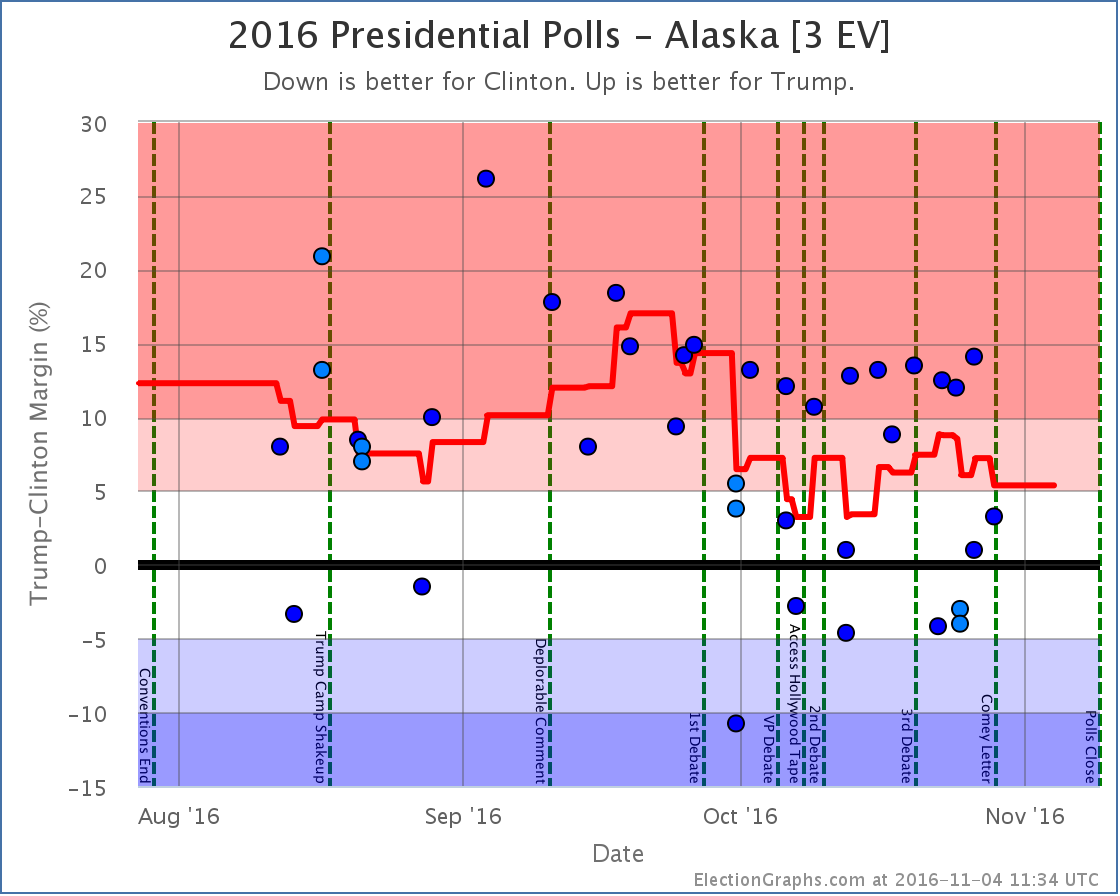
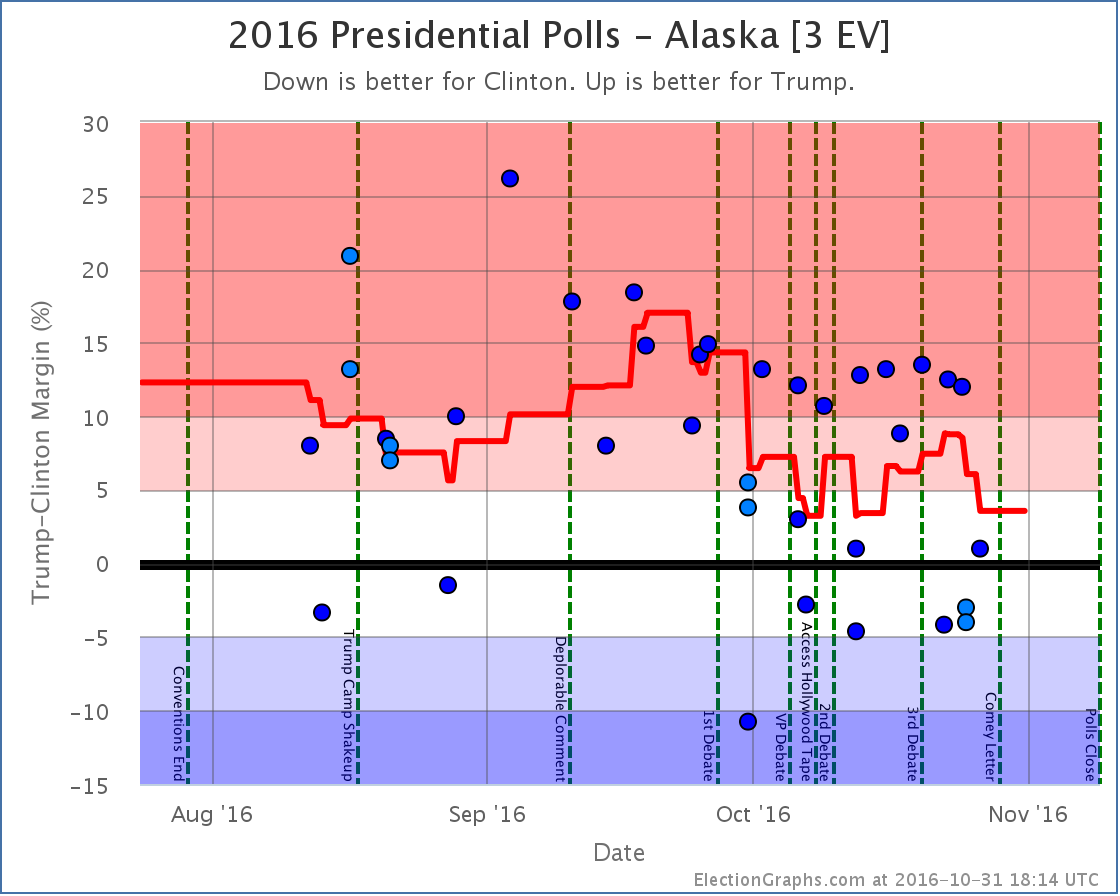
Alaska has been moving away from Trump for the last couple of weeks. With the latest additions, Trump is now up by only 4.2%. So it moves into the “Weak Trump” category.
Now, big caveat here… This is heavily influenced by a Google poll showing Clinton up by 10.8%. Google has had strange outliers in many states this cycle, and this may well be one of them. So it is quite possible this won’t last as additional new polls come in. Without Google, Trump’s lead would still be at 9.1%.
Having said that, there have been two non-Google polls since the first debate. If you only average those, you have a 3.8% Trump lead. Still in “Weak Trump” territory. So saying Alaska is looking much closer than it did is probably still quite fair.
In any case, we have a policy of including just about everything, so the Google polls count, and so Alaska is at Trump +4.2% now, which is a narrow enough lead that the state is now a possible Clinton pick up.
For more information…
This post is an update based on the data on ElectionGraphs.com. Election Graphs tracks both a poll based estimate of the Electoral College and a numbers based look at the Delegate Races. All of the charts and graphs seen in this post are from that site. Additional graphs, charts and raw data can be found there. Follow @ElectionGraphs on Twitter or like Election Graphs on Facebook to see announcements of updates or to join the conversation. For those interested in individual general election poll updates, follow @ElecCollPolls on Twitter for all the polls as they are added. If you find the information in these posts interesting or useful, please consider visiting the tip jar.
On the Curmudgeon’s Corner podcast this week, most of the show is of course about the presidential election. Ivan and Sam discuss everything you would expect about Clinton, Trump, Sanders and Cruz. And Sam ran a caucus! But in addition, there is plenty of other good stuff about hard drives, Microsoft Tay, being sick, the 5th amendment, and more!
Click below to listen or subscribe… then let us know your own thoughts!

Recorded 2016-03-31
Length this week – 1:51:50
 1-Click Subscribe in iTunes 1-Click Subscribe in iTunes
 View Podcast in iTunes View Podcast in iTunes
 View Raw Podcast Feed View Raw Podcast Feed
 Download MP3 File Download MP3 File
 Follow the podcast on Facebook Follow the podcast on Facebook
Show Details:
- (0:00:10-0:11:09) But First
- Agenda
- Sick People
- Airplane WiFi
- Work without Internet?
- (0:11:45-0:34:25) Lightning Round
- Microsoft Tay
- Pakistan Bombing / Egyptian Hijacking
- Obama Approval Ratings
- Apple vs FBI
- Phones not protected by 5th Amendment?
- (0:35:28-0:56:10) Election 2016 – Democrats
- Washington, Hawaii and Alaska
- The Sanders Path
- Sam Caucuses
- Information Bubbles
- (0:56:56-1:08:18) Hard Drive Bonus Segment
- Ivan’s Problem
- SSD vs Spinning Platter
- Wirecutter
- Alex Interlude
- Separating Media
- Backups
- (1:09:38-1:51:30) Election 2016 – Republicans
- Wisconsin Delegate Allocation
- Upcoming States
- Trump Insanity
- Third Parties and the Pledge
- Vice Presidential Selection
- The Trump Insider
- Trump Presidential Style
- Rubio keeping delegates
- Autocorrect
Although the best delegate tallies are still estimates that will almost certainly change a bit before they are final, the general outline will not change. Sanders crushed Clinton in all three states that caucused on March 26th. With Washington, Hawaii and Alaska together, the delegate haul was 104 for Sanders to only 38 for Clinton.
Since the last update Sanders has also been on a roll gaining four new superdelegates (while Clinton got no new supers), and having four delegates move from Clinton to Sanders as results in states that voted earlier got finalized.
Between all that, since the 23rd the net change is Sanders +112, Clinton +34.
So Sanders got a whopping 76.71% of the delegates since the 23rd. That is well above the 67.70% he needed to improve his position in the race in terms of the % of the remaining delegates needed to win. So unlike some Sanders “wins” where he gets the most delegates but still just ends up in a worse position because he didn’t win by enough, this time Sanders supporters are fully justified in celebrating the win.
See that downward slope right neat the end of the green line? That is the improvement in Sander’s position because of these three states. Despite all the states that Sanders has won, this has not happened often. Aside from days when a stray superdelegate committed to him or when states revised their results by a delegate here or there, the only previous times so far where Sanders has improved his position are February 9th when he won New Hampshire and March 6th when he won Maine. (OK, probably Democrats Abroad too.) This new result on March 26th swamps both of those in the magnitude of the improvement.
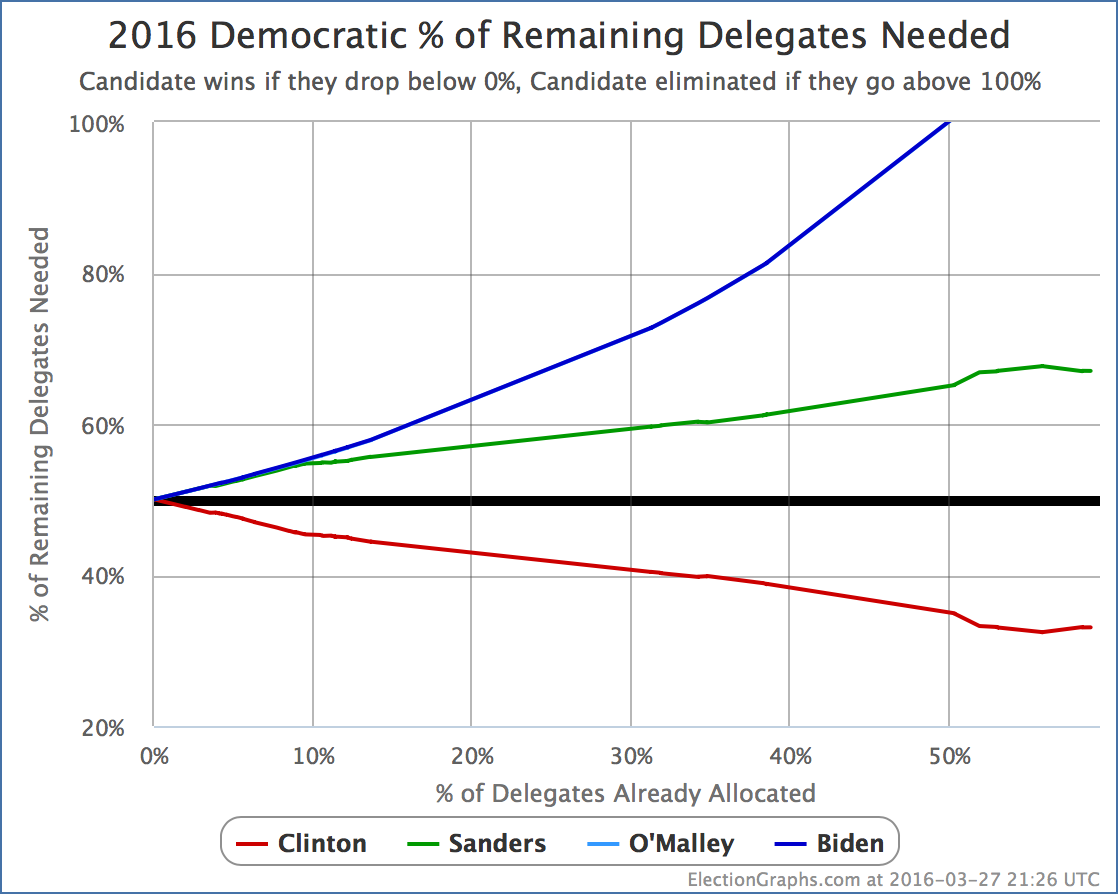
With all of the results and adjustments since Arizona, Idaho and Utah last week, Sanders goes from needing 67.70% of the remaining delegates to win, to needing only… 67.03%.
So… an improvement of… 0.67%.
So, uh… big improvement? Suddenly the Sanders path to victory is clear? Well, it is the biggest improvement in this metric Sanders has seen yet, but…
No.
March 26th was a big Sanders win. That should not be minimized. If he matched the March 26th performance in every contest from here to the end of the primary season, he would indeed catch up to Clinton and win. And the visibility of wins like the 26th may help Clinton seem weak, and may improve Sanders’ performance in future contests.
But the basic situation has not changed significantly. 67% of delegates is still an incredibly high bar. Sanders would have to consistently meet that bar for the rest of the race in order to win outright.
But wait you say, once again this is all including superdelegates. But surely if Sanders won in pledged delegates, the superdelegates wouldn’t deny him the win and would switch to Sanders en masse because to do otherwise would be unseemly? Well, I generally reject starting with that premise and say lets watch the superdelegates and see what they actually do.
But for the moment, as I did once before, let me run the numbers pretending superdelegates don’t exist.
With supers the totals right now are Clinton 1735, Sanders 1069.5, O’Malley 1
Without supers that becomes Clinton 1264, Sanders 1040.
Without supers there are 4050 delegates, and you need 2026 to have a majority.
Sanders would need 976 more delegates to have that majority of pledged delegates. There are 1746 more pledged delegates available.
That means Sanders would need 55.90% of the pledged delegates remaining to end the season with a majority of the pledged delegates.
That bar is a LOT lower than 67%. Consistently beating 67% seems close to unimaginable without a complete implosion. But 56%? Could you get to that just through some momentum, some positive press cycles and good campaigning? Maybe. It seems like it is on the outer edge of the possible given the history so far, but still possible.
If Sanders did succeed at that, he would still need to get a large number of Clinton superdelegates to defect in order to actually win. But Sanders has said he is ramping up his efforts to woo superdelegates. He has gone from saying superdelegates should be ignored, to acknowledging that any realistic path to a win involves getting superdelegates to vote for him too.
If superdelegates do start to defect, you will of course see it on the graphs here.
One last comparison, updating the one I did two weeks ago:
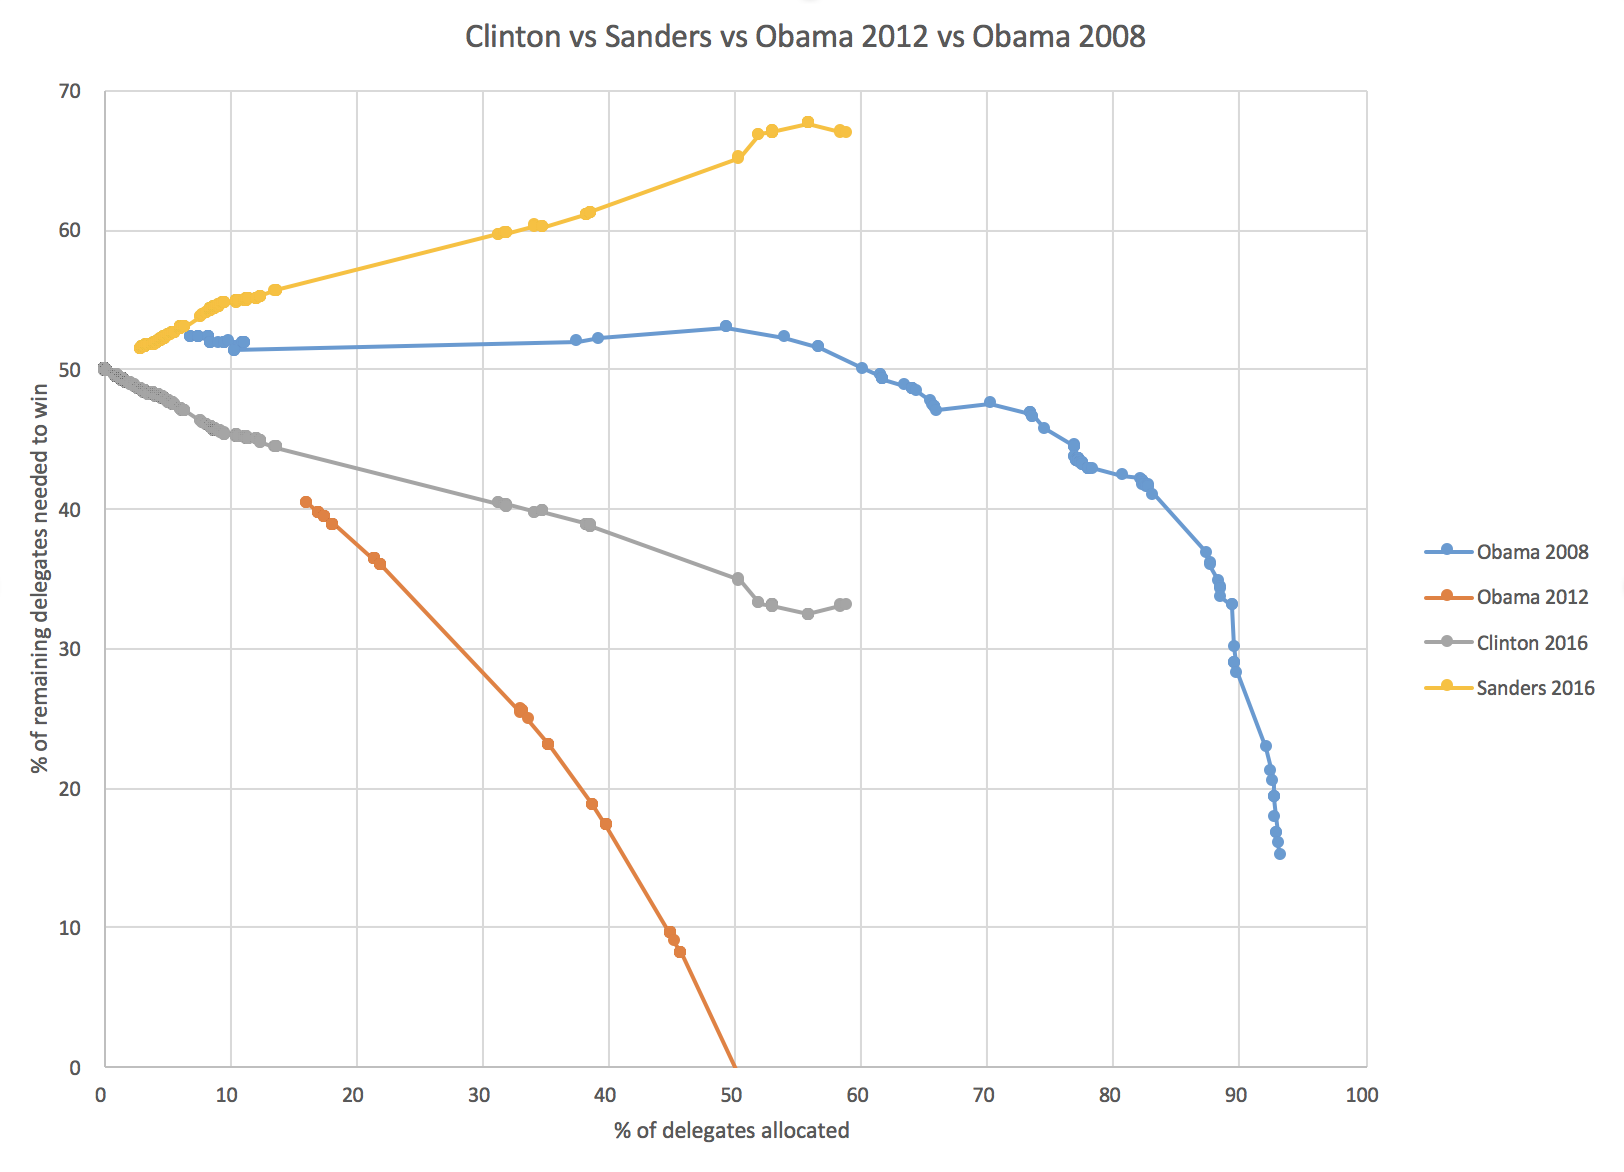
Granting for the moment the premise that the results on the 26th are not an outlier, but are instead indicative of an inflection point in the race, you see that compared to Obama 2008, Sanders starts his “turn” on the graph later (at about 56% rather than at about 49%) and that he is much much further behind that Obama was. Just barely past this point in 2008 is when Obama took the delegate lead. Sanders is far from that.
Meanwhile, Clinton is in a much stronger position than Obama was until very nearly the end.
If this is a “turn”, and Sanders drives his line down and eventually wins, it will be one of the largest come from behind wins in modern times. This is not impossible, but it is still highly unlikely.
Wisconsin is next on April 5th. Right now the RCP poll average there has Clinton 46.5% to Sanders 44.0%. If that average plays out and assuming a roughly even distribution of support throughout the congressional districts in the state, it would mean about 44 delegates for Clinton to 42 delegates for Sanders.
If that happened, Sanders would then need 67.87% of the remaining delegates to win, completely undoing the gains he made with Washington, Hawaii and Alaska.
Now, Sanders may get a boost of his recent wins and do better than the current poll average indicates. He may even win Wisconsin. The question though is not if he wins, but if he wins it by enough to actually be on a pace to catch up to Clinton before things are over. Right now, that means he needs 58 of the 86 delegates available from the Wisconsin primary.
We shall see.
[Update 2016-04-01 16:10 UTC – Superdelegate scan nets Clinton +3, Sanders +2.5. This does not significantly change the analysis above.]
[Update 2016-04-01 16:55 UTC – I found an update from Michigan which I had logged on March 10th, but had an error in it, so the totals in Michigan in the state detail table were correct, but that update wasn’t included in the national totals. Fixed now. Net change from that: Clinton +2, Sanders -2. This also does not significantly change the analysis above.]
[Update 2016-04-05 16:29 UTC – Superdelegate scan: Clinton +1. Note because Bill Clinton said something about how he would support Sanders at the convention if Sanders won, just like he supported Obama in 2008, some people are saying he should be listed as an Uncommitted superdelegate instead of a Clinton superdelegate. I don’t buy this at the moment and am continuing to list Bill Clinton as supporting Hillary Clinton.]
Note: This post is an update based on the data on ElectionGraphs.com. Election Graphs tracks both a poll based estimate of the Electoral College and a numbers based look at the Delegate Races. All of the charts and graphs seen in this post are from that site. Additional graphs, charts and raw data can be found there. All charts above are clickable to go to the current version of the detail page the chart is from, which may contain more up to date information than the snapshots on this page, which were current as of the time of this post. Follow @ElectionGraphs on Twitter or like Election Graphs on Facebook to see announcements of updates or to join the conversation. For those interested in individual general election poll updates, follow @ElecCollPolls on Twitter for all the polls as they are added.
[Edit 2016-03-28 00:05 UTC – Fixed one place I had Sanders’ name instead of Clinton.]
Once again the headline out of a state is Trump winning. In Nevada the delegate count was:
14 Trump, 7 Rubio, 6 Cruz, 2 Carson, 1 Kasich
To be on the glide path for a 1st ballot victory though, Trump needed 15 of the 30 delegates. So he fell slightly short.
Now, don’t misunderstand. This is still an impressive victory, and looking at the upcoming states he has a clearer path to victory than anybody else. His margins were higher in Nevada than many people expected. But if today’s performance was replicated in all of the other states, Trump would come to the convention with more delegates than anybody else, but not the majority needed to win outright. Of course as we continue more people will drop out, and the amount with which states give bonuses to the winners increases, so that still seems like an unlikely final outcome.
Right now Trump continues to do everything he needs to do to win. Lets look at some of the graphs, then we’ll do a quick look at the March 1st “Super Tuesday” states.
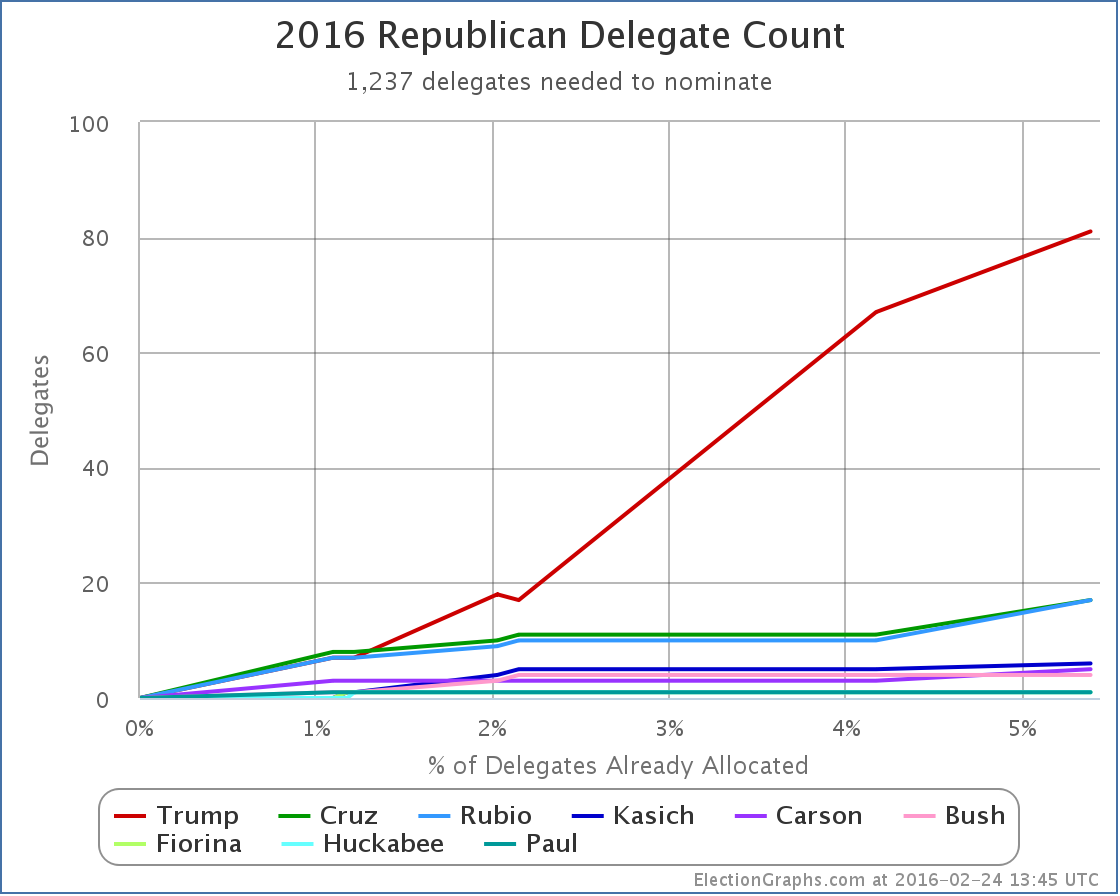
The overall delegate count is now:
81 Trump, 17 Cruz, 17 Rubio, 6 Kasich, 5 Carson, and 7 for people who have dropped out
Trump continues to dominate. Lets look at this as percentages:
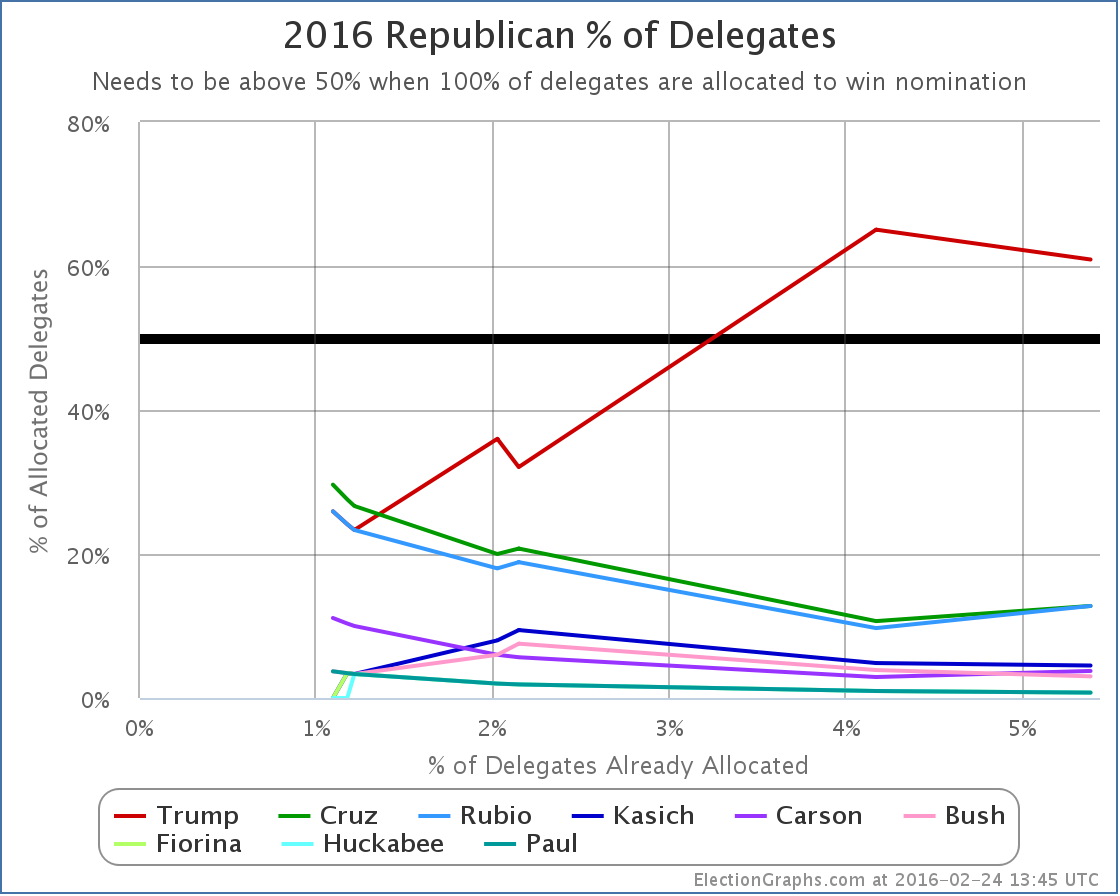
The “winners” here were actually Cruz, Rubio and Carson. Each of them improved their proportion of delegates with Nevada’s results. Trump actually went down. He doesn’t have to worry too much about that though. He still has a majority of the delegates allocated so far, and he is far far ahead of any of his opponents.
Finally, lets look at the “% of remaining delegates needed to win”, which I argue is the single most important thing to look at to understand where the race really is:
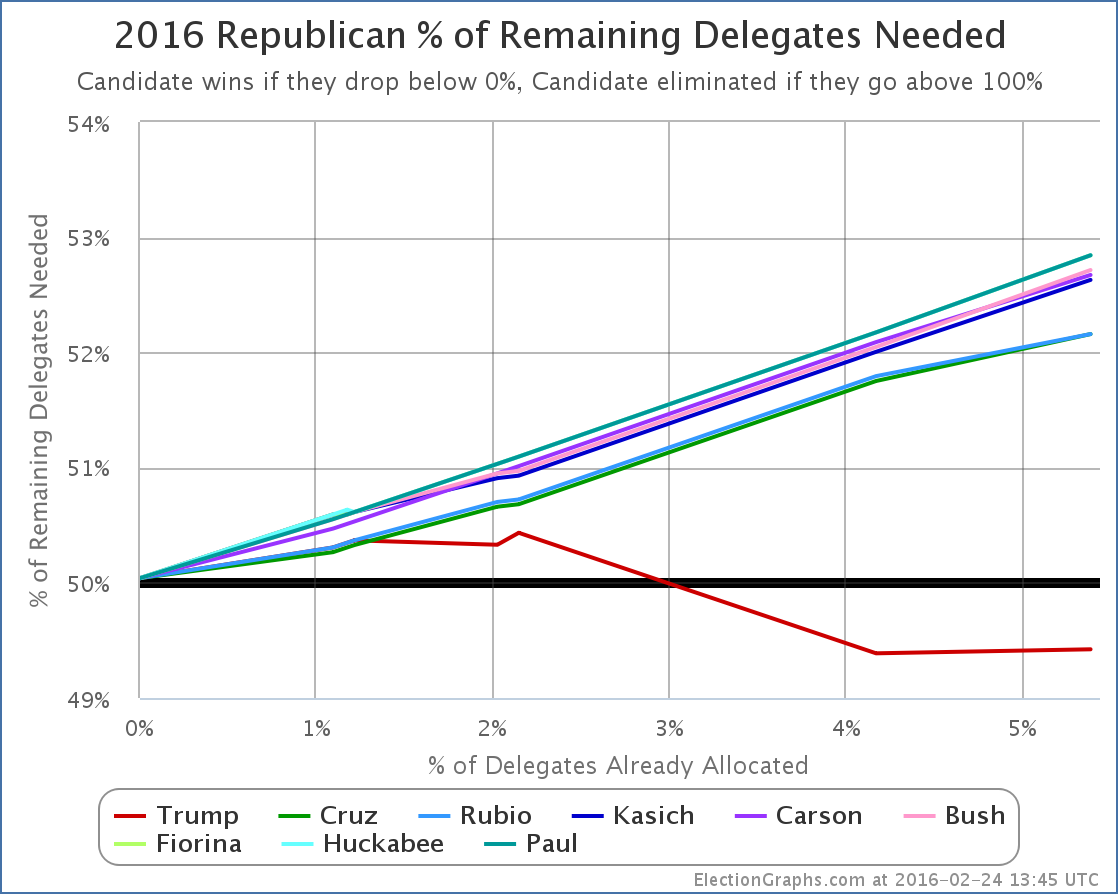
Because Trump got 14 delegates instead of 15 delegates, his line goes up a little bit. (Remember, on this chart down is good, up is bad.) The red line goes from needing 49.39% of the remaining delegates to needing 49.42%. This is a relatively trivial difference though. It is basically flat. Trump’s situation is very close to unchanged.
Meanwhile, the other lines keep going up at a decent pace. Kasich and Carson add about 0.6% to their numbers. Cruz and Rubio add about 0.4%.
This should be obvious, but the more they lose, the harder it is to catch up.
Many people are still talking about how as consolidation happens, the remaining non-Trumps will do better and the picture will change. Maybe, but nobody new announced they were dropping out after the Nevada results (yet anyway). So it looks like we may still go into March 1st with a five person race.
Lets run a hypothetical using current polling on the Super Tuesday states and see where we end up using RCP poll averages for the five remaining candidates. We’ll make delegate estimates based on the specific delegate allocation rules in each state.
Texas (155 delegates)
- Current poll averages: 37.3% Cruz, 28.0% Trump, 11.7% Rubio, 4.7% Carson, 3.0% Kasich
- Delegate estimates: 99 Cruz, 56 Trump
Georgia (76 delegates)
- Current poll averages: 35.0% Trump, 22.7% Cruz, 19.3% Rubio, 7.3% Carson, 6.3% Kasich
- Delegate estimates: 50 Trump, 26 Cruz
Tennessee (58 delegates)
- Last poll from November so using national average: 33.6% Trump, 20.4% Cruz, 16.4% Rubio, 9.8% Kasich, 7.4% Carson
- Delegate estimates: 37 Trump, 21 Cruz
Alabama (50 delegates)
- Last poll from December so using national average: 33.6% Trump, 20.4% Cruz, 16.4% Rubio, 9.8% Kasich, 7.4% Carson
- Delegate estimates: 32 Trump, 18 Cruz
Virginia (49 delegates)
- Using only February poll: 28% Trump, 22% Rubio, 19% Cruz, 7% Kasich, 7% Carson
- Delegate estimates: 17 Trump, 13 Rubio, 11 Cruz, 4 Kasich, 4 Carson
Oklahoma (43 delegates)
- Using only February poll: 32.5% Trump, 25.0% Cruz, 15.5% Rubio, 7.0% Carson, 0.0% Kasich
- Delegate estimates: 17 Trump, 15 Cruz, 11 Rubio
Massachusetts (42 delegates)
- Current poll averages: 41.0% Trump, 17.0% Rubio, 10.0% Cruz, 7.5% Kasich, 3.5% Carson
- Delegate estimates: 23 Trump, 9 Rubio, 6 Cruz, 4 Kasich
Arkansas (40 delegates)
- Using only February poll: 27% Cruz, 23% Trump, 23% Rubio, 11% Carson, 4% Kasich
- Delegate estimates: 18 Cruz, 13 Rubio, 9 Trump (giving Rubio the 2nd place finish breaking 23% tie by alphabetical order)
Minnesota (38 delegates)
- Last poll from January so using national average: 33.6% Trump, 20.4% Cruz, 16.4% Rubio, 9.8% Kasich, 7.4% Carson
- Delegate estimates: 18 Trump, 11 Cruz, 9 Rubio
Wyoming (29 delegates)
- No polls at all, using national average: 33.6% Trump, 20.4% Cruz, 16.4% Rubio, 9.8% Kasich, 7.4% Carson
- Delegate estimates: 12 Trump, 7 Cruz, 5 Rubio, 3 Kasich, 2 Carson
Alaska (28 delegates)
- Last poll from January so using national average: 33.6% Trump, 20.4% Cruz, 16.4% Rubio, 9.8% Kasich, 7.4% Carson
- Delegate estimates: 13 Trump, 8 Cruz, 7 Rubio
Vermont (16 delegates)
- No polls at all, using national average: 33.6% Trump, 20.4% Cruz, 16.4% Rubio, 9.8% Kasich, 7.4% Carson
- Delegate estimates: 10 Trump, 6 Cruz
OK, that’s it. Adding all that up…
Estimated Super Tuesday delegate totals: 294 Trump, 246 Cruz, 67 Rubio, 11 Kasich, 6 Carson
That gives Trump 47.1% of the super Tuesday delegates, Cruz 39.4%, and everyone else much less.
Trump needs 49.4% of the delegates to be on the path to an outright win though! So 47.1% would be in the realm where heading to a contested convention might be possible! Still unlikely, as the additional states in March will add up fast, and more candidates are likely to drop out. Still though, possible!
Adding in the existing delegates, we’d have a post-Super Tuesday race that looks like this:
375 Trump, 263 Cruz, 84 Rubio, 17 Kasich, 11 Carson, 7 for candidates who have already dropped out
Now, these are estimates based on current polling, and very few of these states were well polled as of this post, so much of the above is based on one or two polls, or using the national averages rather than state polls. And I had to make the assumption that all congressional districts would mirror state results (which is unlikely to be true). And Wyoming actually elects individual delegates rather than doing things based on candidate preference, so it may be an oddball in the end. And of course things are likely to change further before people actually vote next Tuesday. But… the general outlines of this aren’t likely to be too far off.
If this is even remotely close to where we are on March 2nd, we end up with Trump very close to the 50% of delegate mark. (The above has him EXACTLY at that mark.) He would need just a LITTLE bit more to actually push him over the edge to a clean win.
The flip side of that though is the combination of all the anti-Trumps would need just a LITTLE bit more in order to have this be on the path to a contested convention. I mentioned earlier that this is still an unlikely outcome. It is. After March 1st, the disproportionality of delegates given to the winner increases, and after March 15th we have pure winner take all states as well. If Trump remains in the overall lead, even with a plurality, then that is all it takes to push him over the edge.
If the anti-Trumps want to have any hope here at all, they need to be in a position by mid-March that they can win not just a few, but many states of the winner-take-most and winner-take-all variety. And frankly, the most likely scenario even then is just forcing a contested convention where Trump still has the most delegates, not someone else winning outright.
The anti-Trumps would have a hard road to get to an outright win. Cruz would need 56.8% of the remaining delegates to catch up and win after March 1st if things played out like my estimates above.
If you had to make a guess based on what we know now, a Trump nomination is far more likely than any other… and with an outright delegate majority on the first ballot, not after a contested convention.
6 days until Super Tuesday. We’ll see how close my estimates above turn out to be.
Update 2016-02-26 07:17 UTC – On February 22nd New Hampshire certified the results of their primary. In the final tally Trump had one more delegate than previous estimates, and Rubio one less. This did not seem worthy of a separate post, but a note here seemed appropriate. The totals on ElectionGraphs.com have been updates appropriately. This does not substantively change any of the analysis above.
Note: This post is an update based on the data on ElectionGraphs.com. Election Graphs tracks both a poll based estimate of the Electoral College and a numbers based look at the Delegate Races. All of the charts and graphs seen in this post are from that site. Additional graphs, charts and raw data can be found there. All charts above are clickable to go to the current version of the detail page the chart is from, which may contain more up to date information than the snapshots on this page, which were current as of the time of this post. Follow @ElectionGraphs on Twitter or like Election Graphs on Facebook to see announcements of updates or to join the conversation. For those interested in individual general election poll updates, follow @ElecCollPolls on Twitter for all the polls as they are added.
[Edit 16:28 UTC to correct math on % of remaining Cruz would need after Super Tuesday, I’d originally shown a higher number around 61%.]
[Edit 2016-02-27 17:06 UTC to fix place where Kasich had been autocorrected to Quash.]
[Edit 2016-02-28 22:03 UTC to add dropped out candidates to the after Super Tuesday estimate.]


|
Romney |
Obama |
| Romney Best Case |
235 |
303 |
| Current Status |
206 |
332 |
| Obama Best Case |
206 |
332 |
I needed to pause to take my wife to the airport, so I couldn’t make this update earlier, but shortly after 06:00 UTC, Alaska was called for Romney.
This means so far the five poll average has called 54/54 contests. Only Florida is left. Even if it ends up missing on Florida, that is pretty good… It is better than it did four years ago.
If I do this again in four years, I may end up doing some things differently based on things I’ve learned this time around, but for the most part I’d say this exercise has been a success. And lots of fun, if somewhat exhausting in the last month.
I have no idea if Florida will end up being called in the next few hours, or if it will end up going almost 15 days like Missouri did in 2008.
Given that, I think it is time to call it a night. I’ll do another update sometime after Florida is called, although it may not be immediate given I’ll now start spending time on non-election things as well. :-)
Thanks again for following my coverage this year. It has been a blast!


Charts from the Abulsme.com 2012 Republican Delegate Count Graphs page. When a candidate gets down to 0%, they have cinched the nomination. If they get up past 100%, they have been mathematically eliminated. The first chart is by date, on the second chart rather than the date on the x-axis, we show the “% of Delegates Already Allocated” as this better represents the progress through the race. Note that these numbers include estimates of the eventual results of multi-stage caucus processes which will be refined as the later stages occur.
Right after the caucuses there, delegates from Alaska were estimated as Romney 8, Santorum 7, Paul 6, Gingrich 3. The district Convention vote is now final, and the estimate changes to Romney 8, Santorum 8, Paul 6, Gingrich 2. So net for the day: Santorum +1, Gingrich -1. (The three superdelegates from Alaska are still up for grabs.)
This of course doesn’t substantially change anything.
(For the die hards: Santorum’s % of remaining needed to win declines from 71.84% to 71.76%, while Gingrich’s rises from 79.49% to 79.57%.)

Chart from the Abulsme.com 2012 Republican Delegate Count Graphs page. When a candidate gets down to 0%, they have cinched the nomination. If they get up past 100%, they have been mathematically eliminated. Rather than the date on the x-axis, we show the “% of Delegates Already Allocated” as this better represents the progress through the race. Note that these numbers include estimates of the eventual results of multi-stage caucus processes which will be refined as the later stages occur.
So, Super Tuesday happened. As of this update, Green Papers has “called” 385 of the 419 delegates available from the Super Tuesday contests. There are 34 delegates that haven’t been determined yet that will result in updates later, but of the ones we do know, the estimates for Super Tuesday contests are: Romney 208, Santorum 84, Gingrich 72, Paul 21. Romney also picked up a Superdelegate, bringing the total for the day to Romney 209, Santorum 84, Gingrich 72, Paul 21.
Compared to the Sabato Crystal Ball projections which we used to game out Super Tuesday over the weekend, Romney performed better than expectations, as did Gingrich. Santorum and Paul underperformed compared to those predictions. In any case, where does this put us…
Bottom line, Romney is the big winner today, and this may be the start of him actually pulling away and heading toward the nomination, but he is still not out of the woods in terms of the danger of being blocked from 1144. Lets look at the details.
The situation for Santorum, Gingrich and Paul is essentially what I mapped out in the gaming Super Tuesday post. To paraphrase what I said there, it is now absolutely undeniably clear (although the trend was obvious even before today) that none of these three guys are on a path to the nomination. Of the three, Santorum is doing the best, but with today’s numbers, to be on a path to win, he would need to now get 64.5% of the remaining delegates, compared to the 21.1% he has gotten so far. For this to even come into the realm of possibility, Gingrich and Paul would both have to stop getting delegates, Santorum would have to pick up all of their support, AND something would need to happen to cause support for Romney to plummet. This is a very unlikely sequence of events. It isn’t going to happen.
Oh, I guess I should also note that Gingrich pulled back ahead of Paul for 3rd place.
The remaining question is: “Are the non-Romney’s collectively still in a position to potentially block Romney from getting to 1144?” If after today, Romney was under 50% of the total delegates, and his “% of remaining needed to win” was heading upward or flat, this is a possibility that would be looking like it was still very much in play. But Romney exceeded the 49.7% of delegates he needed in order to be on track toward 1144, and did it by a decent margin. Of the delegates in today’s total, he picked up 209 of 386, or 54.1%. This reduced his “% of remaining needed to win” from 49.7% to 48.5%. That means to block, the non-Romney’s collectively need to be getting 51.5% of the delegates, compared to the 46.9% they have managed so far. So they have to do better than they have been so far, and by a non-trivial margin. And they have do do this even though it is obvious none of them can win outright. It has to be about stopping Romney.
Now, the rest of March has a bunch of states that are supposed to be relatively good for the non-Romneys. So the non-Romney’s managing to get 51.5% in the next few state is very much within the realm of possibility. After that we hit more Romney friendly states in April. The thing to watch for in the upcoming states is not who wins the popular vote, or even the delegate count. The question will be: “Is Romney continuing to get enough delegates to avoid being blocked?” Right now, that magic number is 48.2%. As long as he is getting 48.2% of the delegates (or more) then he is marching his way toward the nomination. If he gets less than that, then blocking will remain possible a little bit longer. If the rest of March really is friendly to the non-Romneys, we may see that Romney’s “% needed to win” starts heading back up a bit before Romney hits friendly states again and starts fully pulling away. As long as we see that happening, blocking Romney is still a possibility. And indeed, if Romney is damaged by the contests in March and his April states start looking not so good after all, then blocking starts looking more real again.
But Romney’s “% of remaining needed to win” is the smallest it has been so far, and none of the other candidates have realistic shots at winning, only a shot at blocking that relies on them continuing to win delegates even though it is obvious they can’t win, so Romney is in a pretty good position right now. Watch that line though. Until it starts heading downward decisively, Romney hasn’t got it wrapped up just yet.
So what is next? Well, first, the last 34 delegates from Super Tuesday (they are from Georgia, Ohio and Tennessee). Then on Sunday we have Kansas (40), Guam (9), Northern Marianas (9), Virgin Islands (9). Then Tuesday we have Alabama (50), Mississippi (40), Hawaii (20), American Samoa (9). And then it goes on and on…
|
|


