States with new poll data added since the last update: All 50 states, DC, the Maine congressional districts, and the 2nd congressional district in Nebraska.
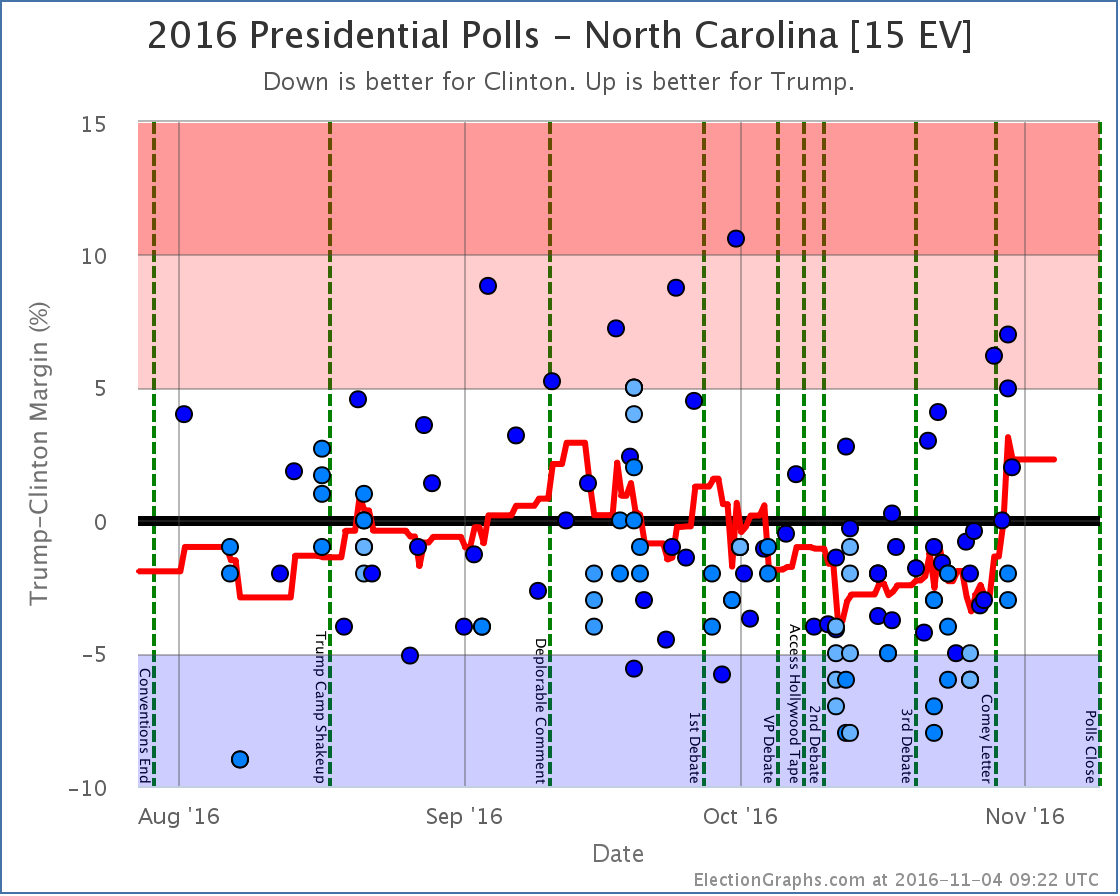
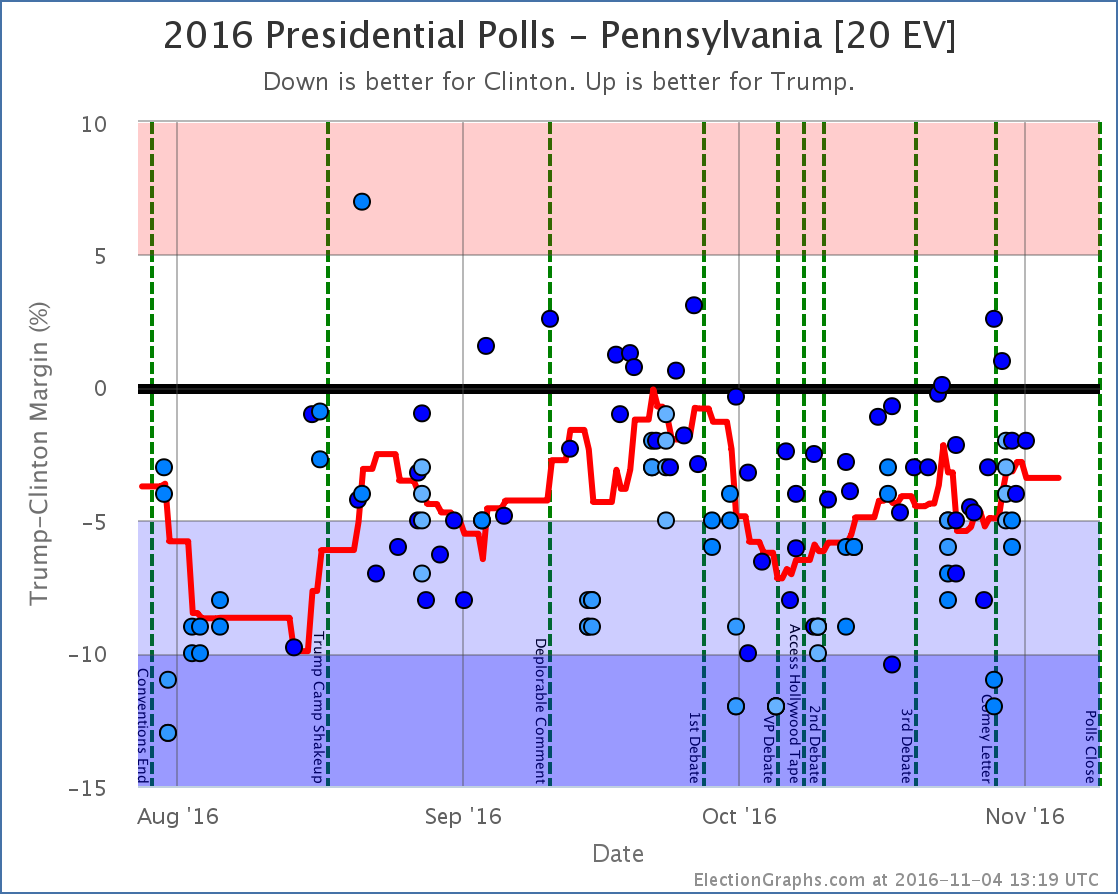
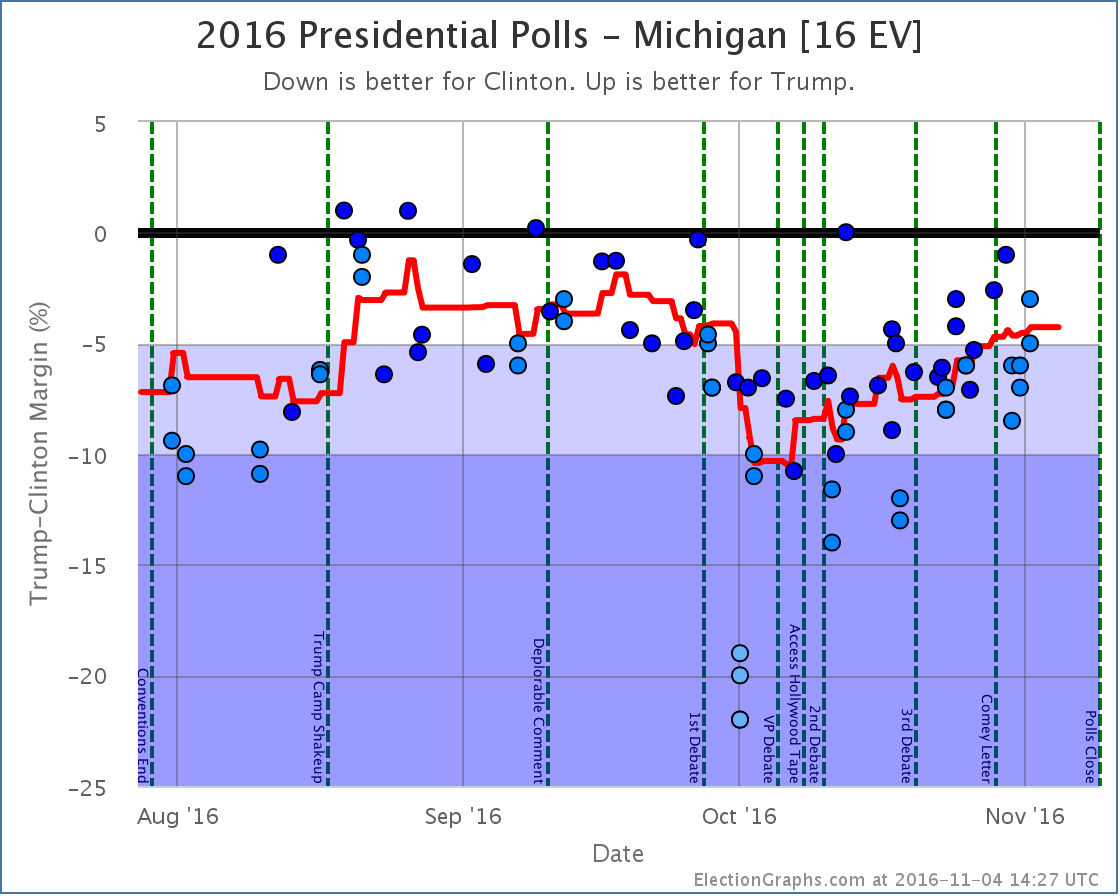
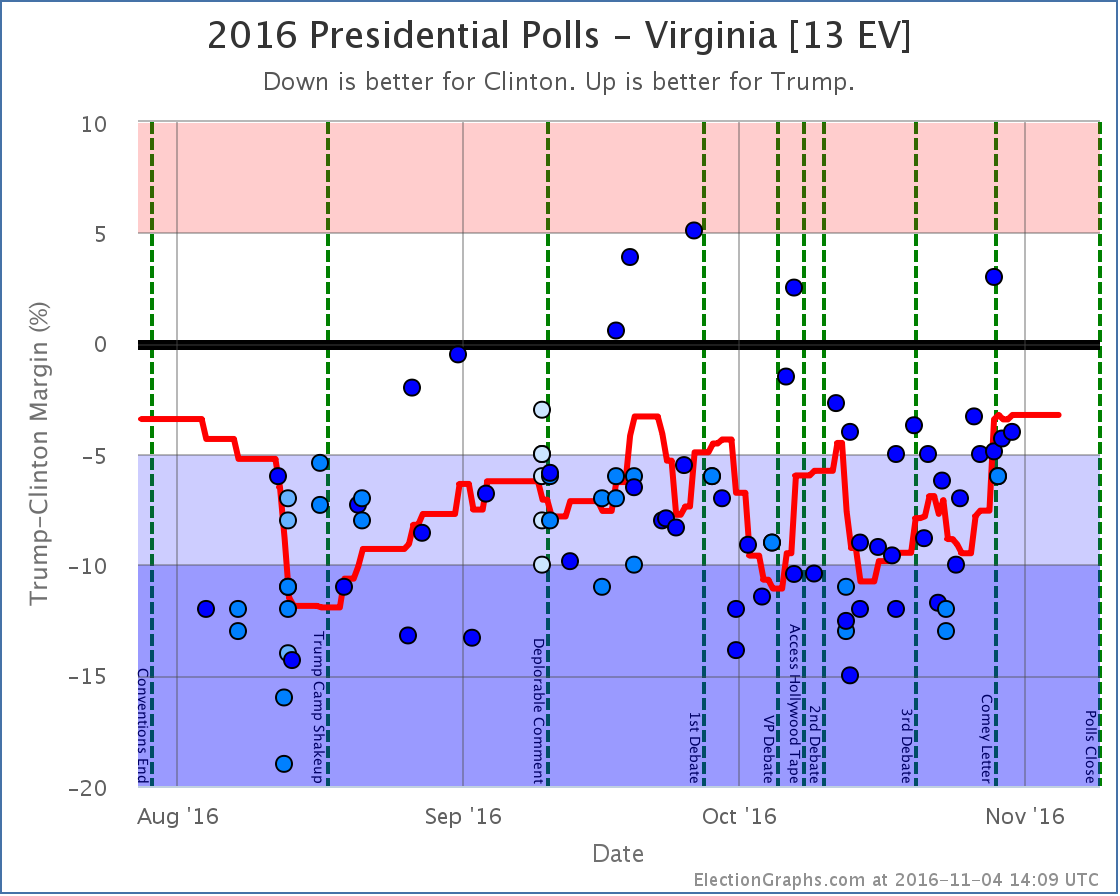
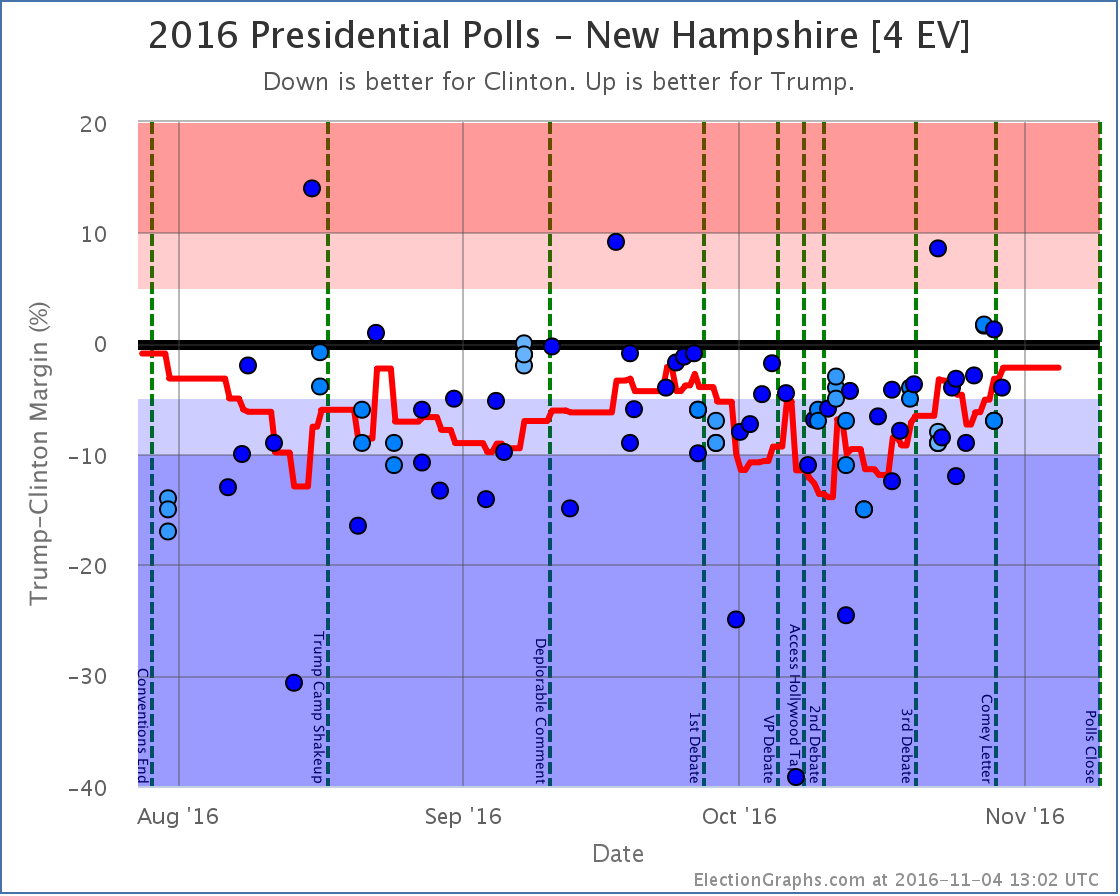
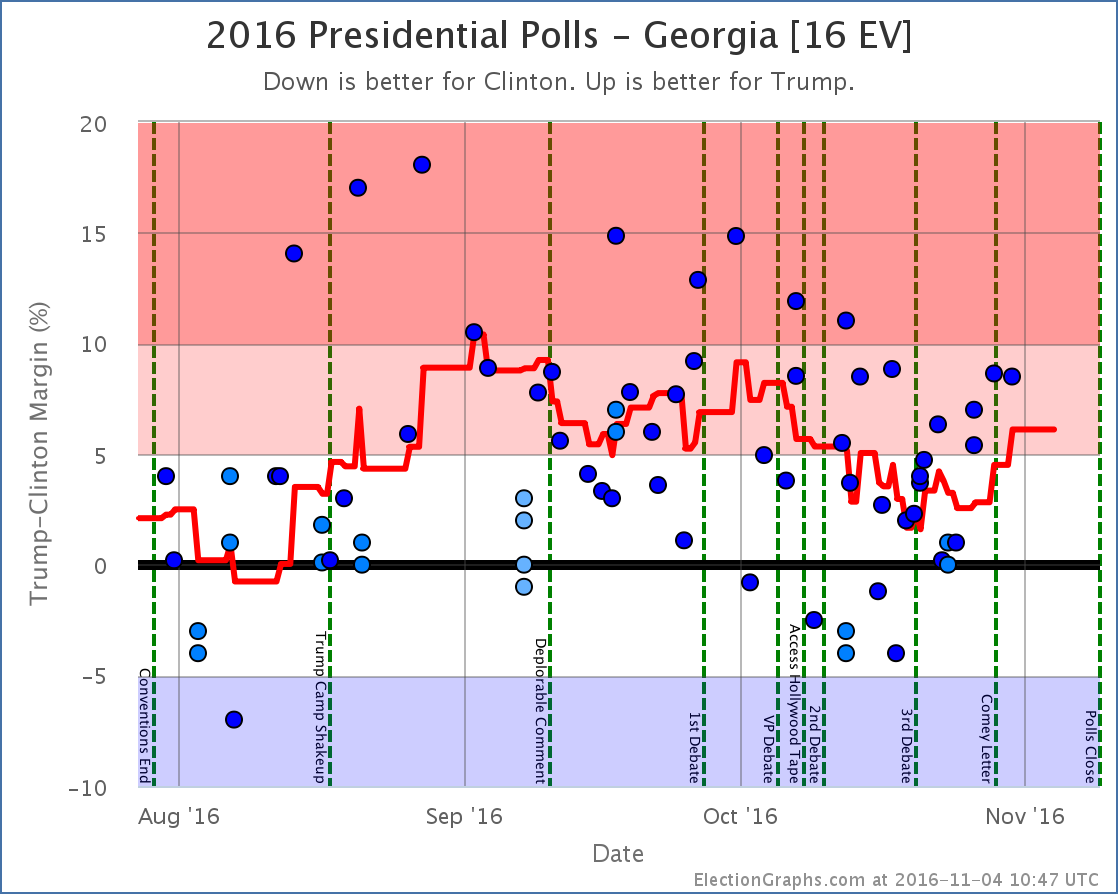
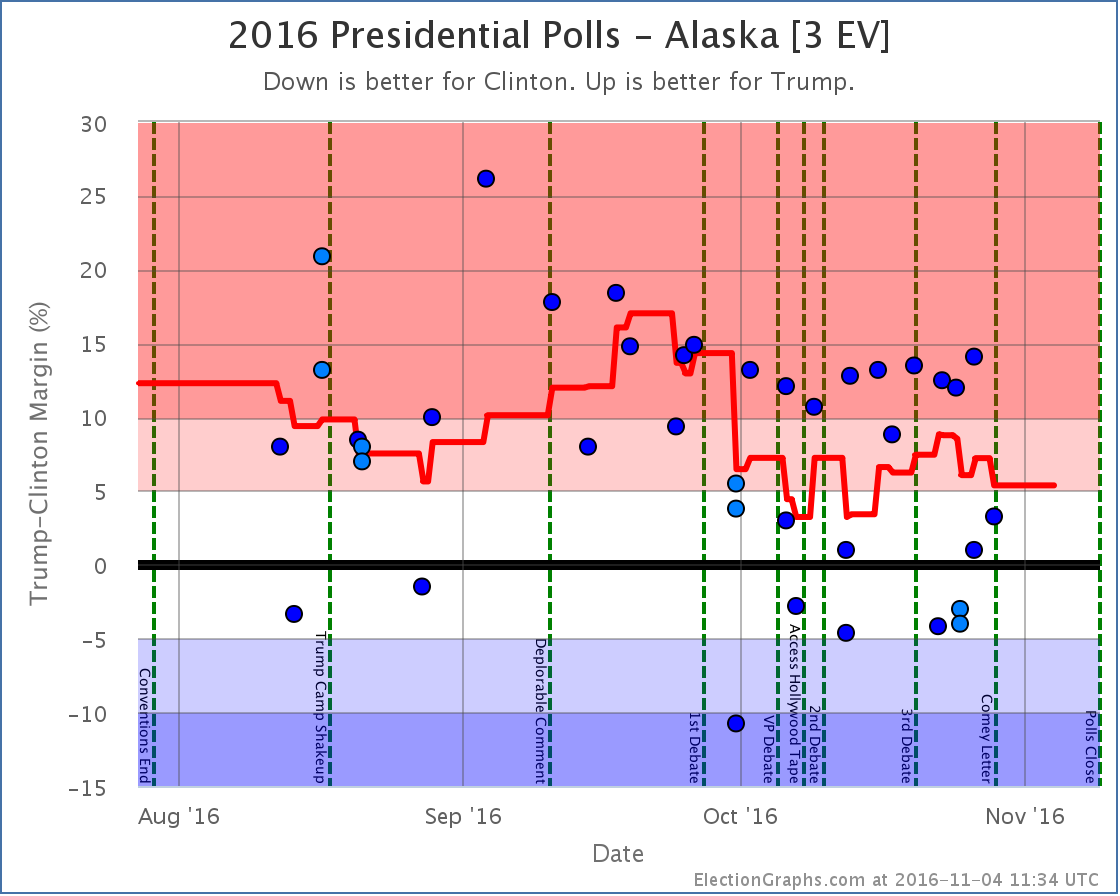
Notable changes in: Pennsylvania (20), Georgia (16), Michigan (16), North Carolina (15), Virginia (13), New Hampshire (4), Alaska (3), and the tipping point.
With the current pace of polling, there are already a number of new polls out since the line was cut for this update. They will of course be included in the next update.
National Summary
It has been about four days since the last update. Since then the movement has all been towards Trump. Some of this has been movement from polls taken primarily after the Comey letter, but a some of it also represents movement that was already happening when that news broke.
Good for Trump:
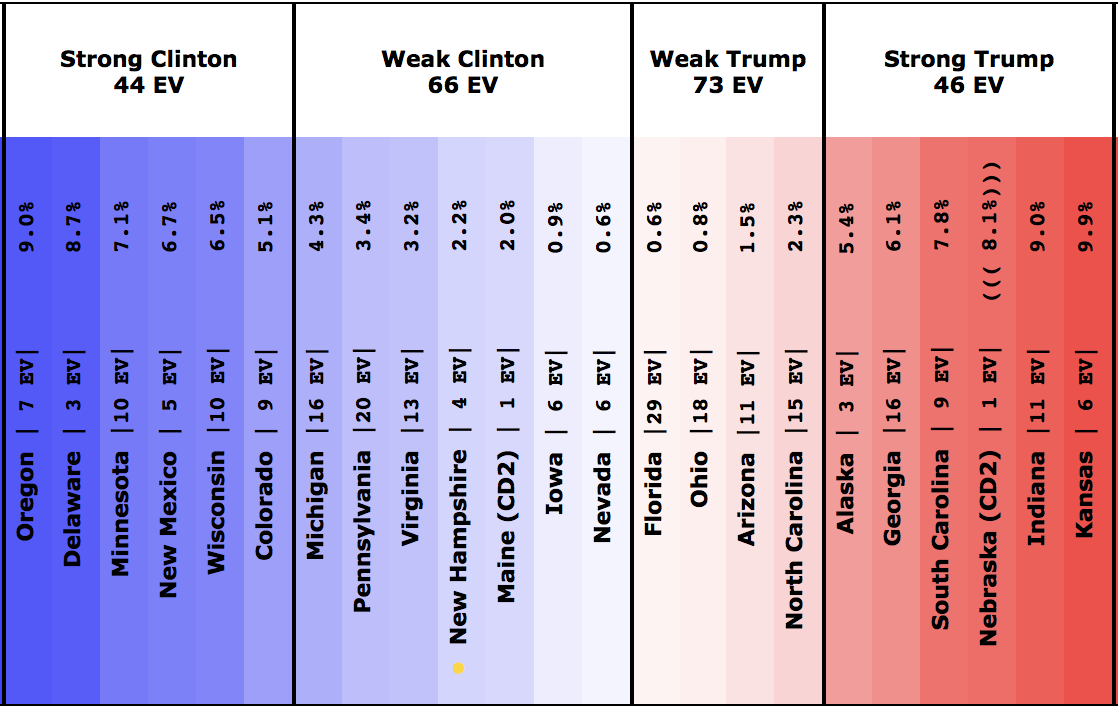
- The expected result has moved from a 62 EV Clinton win to only a 32 EV Clinton win
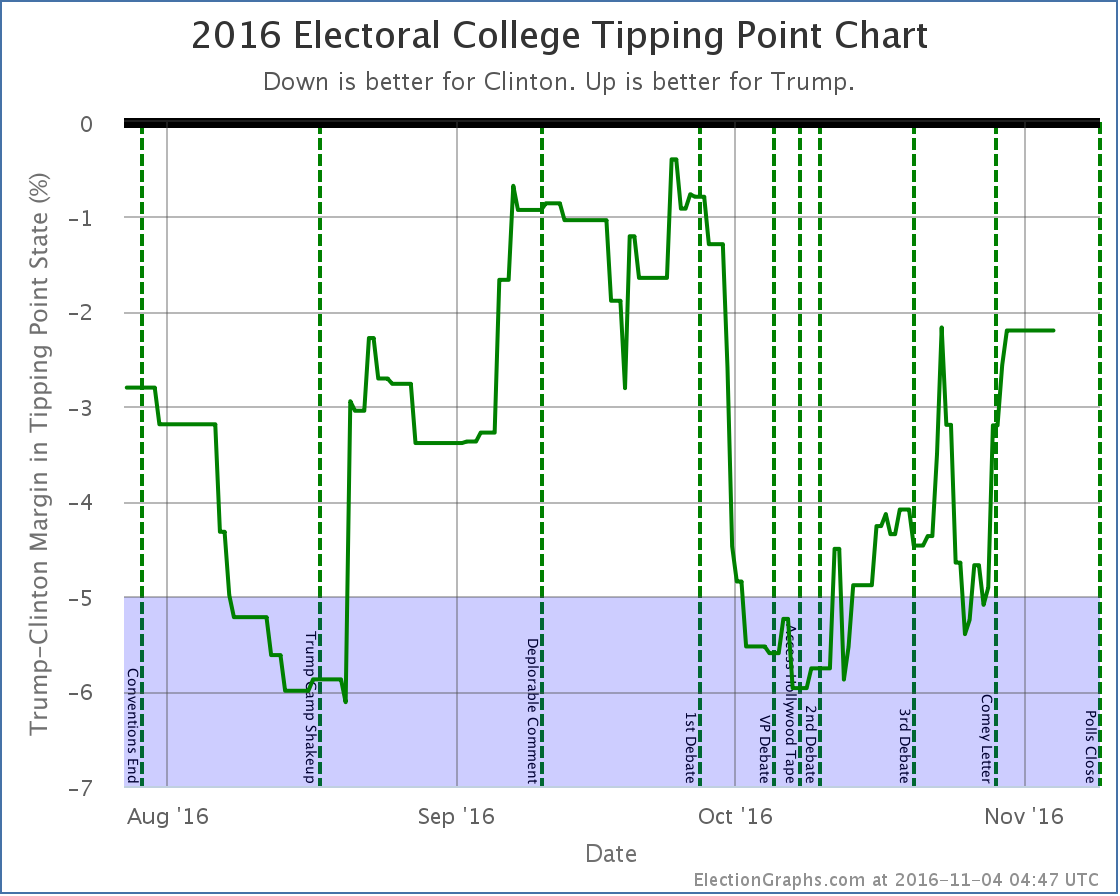
- The tipping point has moved from Clinton by 5.3% in PA to Clinton by only 2.2% in NH
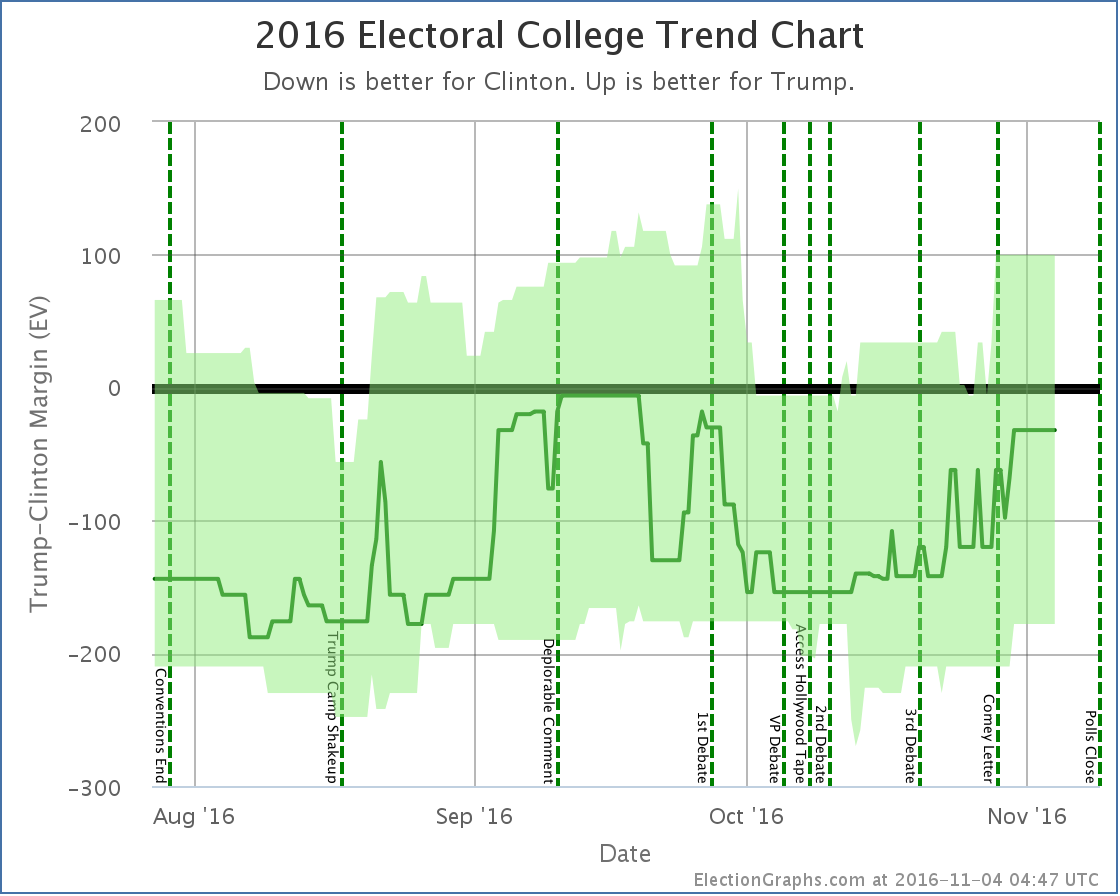
- Clinton’s best case has declined from a 216 EV win to only a 178 EV win
- Trump’s best case has shifted from a 6 EV loss to a 100 EV win
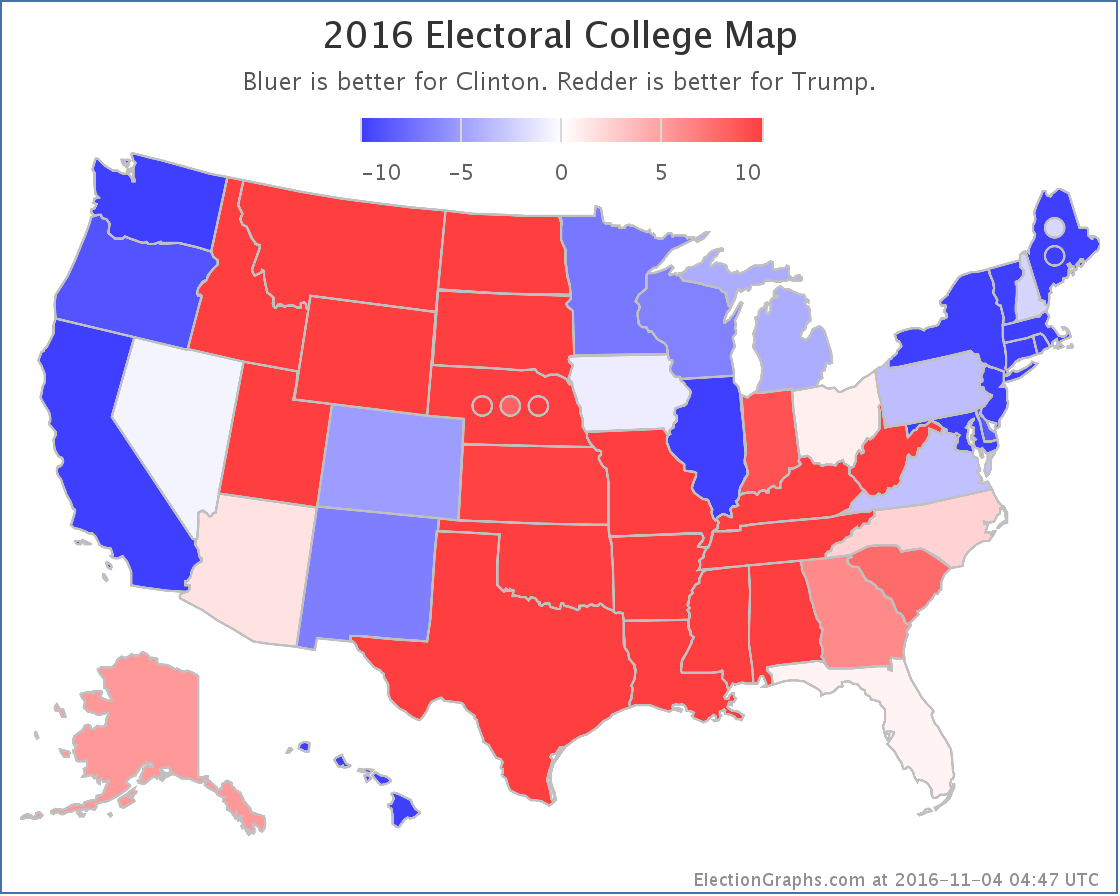
Charts
Discussion
Four days ago Trump had tightened the expected electoral college case, but critical states like Pennsylvania were moving against him, so the job of getting to 270 electoral votes was actually getting harder despite the electoral college gap narrowing.
Not so any more. In the last few days, which added lots of post-Comey polls (as well as some covering the pre-Comey period too) the movement has ALL been toward Trump. There is no mixed message this time. No bright side for Clinton. In the last few days almost all of the polling news has been good for Trump and bad for Clinton.
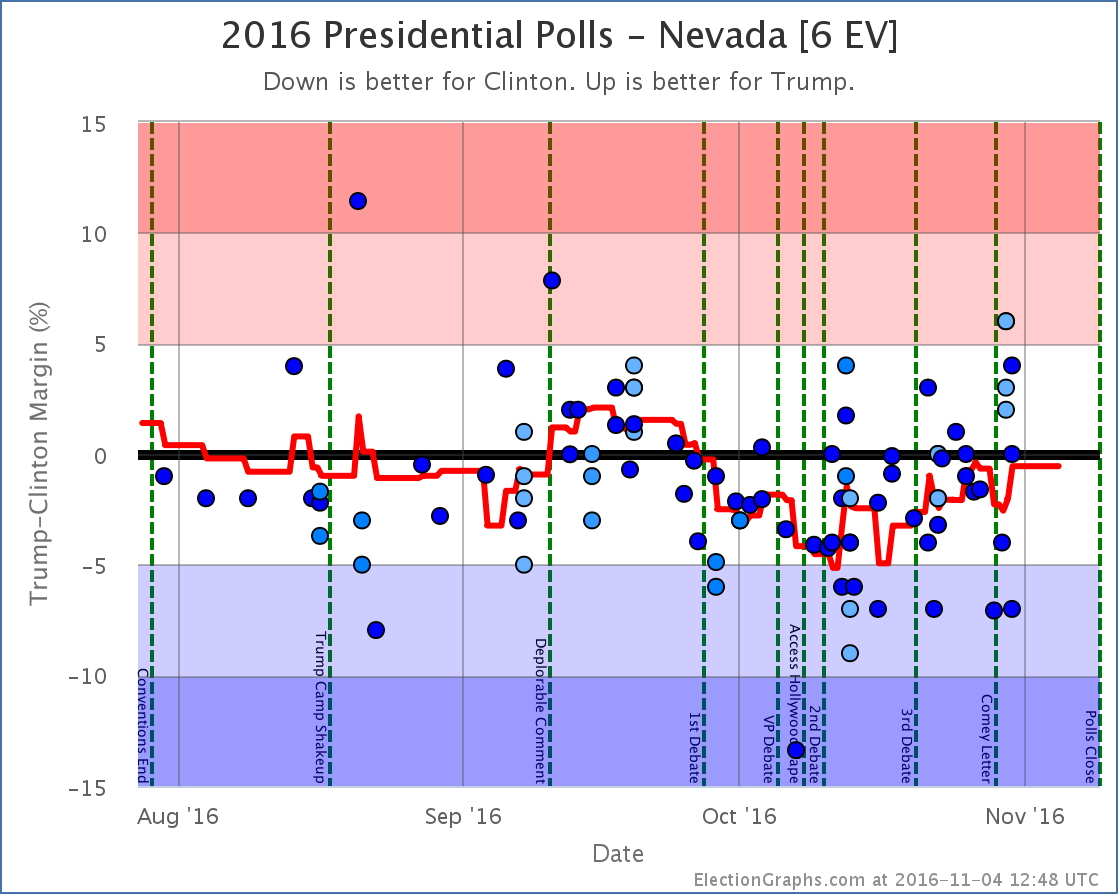
Now, she is still ahead. But Trump once again has a path. The “easiest” path at this point would be to win all the states he is currently leading, then pull in Nevada (0.6% Clinton lead), Iowa (0.9% Clinton lead) and New Hampshire (2.2% Clinton lead). Or he could get any one of those states, plus Virginia (3.2% Clinton lead). Or just Pennsylvania (3.4% Clinton lead). Or just Michigan (4.3% Clinton lead).
All of these states are ones where a few days ago Clinton’s lead was much stronger. Trump has been making gains all over the map.
How much of this is Comey? Some for sure, but as I’ve pointed out before, the expected electoral college been moving slowly toward Trump for weeks. But that did seem to have somewhat stalled out. The tipping point was moving back toward Clinton. With the Comey letter the move toward Trump came back with a vengeance.
We’re not quite at Trump’s highs from September, but we are getting near there. Now, even at his best point in September, Trump was still losing to Clinton. But it was close. And it is close again now. The Trump surge is real, and he has made this a race again.
The tipping point is at 2.2%. That is within the zone where a systematic polling error or a last minute news event that happens too late to be captured in polls could reverse the result. A Trump win COULD happen. This is not impossible.
Clinton is still heavily favored though.
This site does not produce “odds”, just the range of “you shouldn’t be completely shocked” outcomes, which is intentionally pretty wide. Right now, a Clinton win is expected, but a Trump win is not out of the question.
Lots of places do produce odds though. Here is the current rundown in terms of percentage chance of Trump winning:
- 32% – FiveThirtyEight
- 24% – Election Betting Odds
- 16% – New York Times
- 14% – PredictWise
- 9% – Daily Kos
- 6% – HorsesAss
- 2% – Huffington Post
- 1% – Princeton Election Consortium
I was asked on Twitter yesterday for my odds. Given that my model does not produce a number for this, I was reluctant to give an exact number. But I gave a range and said between 5% and 10%. With a few additional polls added since then, I’d go toward the higher end of that range. Maybe 7% to 10%.
Why that range?
Trump is getting very close to Clinton, but in all the prior polling movement in the campaign Trump has never been able to actually pull into the lead. It seems like he reaches a ceiling and gets to the point where to gain any further he has to not just convince the wishy-washy undecideds, but he has to start getting actual Clinton supporters to flip, which seems like a much harder job.
But until September I thought Trump’s ceiling was matching Romney’s performance in 2012. With current polling, Trump wins every state Romney won, then adds Florida and Ohio. So levels that look like ceilings can indeed be broken. Another bad news cycle for Clinton, or even some systematic error in the polling could easily put us there.
So 7% to 10% seems reasonable.
If a Trump win does happen, surprise is warranted, because he would have beaten the odds, but not shock, because he IS close.
If Trump was a hurricane that was four days out, we would be “within the cone”. Toward the edge of the cone to be sure. We are not directly on the projected path. We expect it to miss us. But we would be making preparations just in case the storm swerves and hits us.
4.3 days until we stop looking at polls and start looking at actual election results.
State Details
The following are the detailed charts for all the states that influenced the national changes outlined above.
Moving from Clinton to Trump
Moving into reach for Trump
Moving out of Clinton’s reach
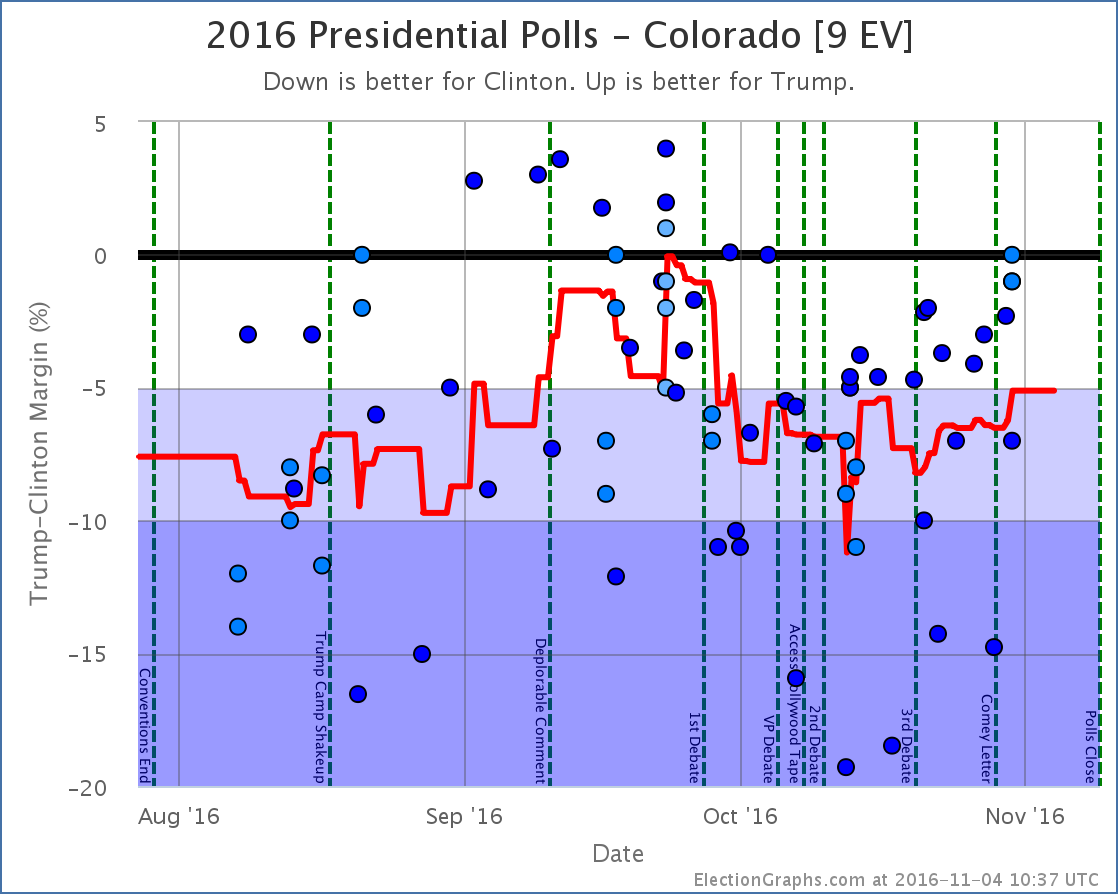
Other states that helped move the tipping point
A note about McMullin
Election Graphs is designed around showing the Republican – Democrat margin, and there is not enough time before the election to revamp the site to properly account for 3rd parties that are strong enough to have a shot at winning electoral votes.
Right now the Real Clear Politics average in Utah has McMullin 12.0% behind the lead. The 538 average in Utah has him 10.3% behind the lead. Although McMullin was a lot closer than anyone expected, he never got closer than 5% to the lead in Utah in these averages and now appears to be fading. 538 still has him in second place, but it doesn’t seem likely at this point that he will win electoral votes.
If that changes, I will of course note it in these updates and on the Election Graphs site.
For more information…
This post is an update based on the data on ElectionGraphs.com. Election Graphs tracks a state poll based estimate of the Electoral College. All of the charts and graphs seen in this post are from that site. Additional graphs, charts and raw data can be found there. Follow @ElectionGraphs on Twitter or like Election Graphs on Facebook to see announcements of updates or to join the conversation. For those interested in individual general election poll updates, follow @ElecCollPolls on Twitter for all the polls as they are added. If you find the information in these posts interesting or useful, please consider visiting the tip jar.
Edit 17:45 UTC to fix some wording in the hurricane comparison paragraph.
Edit 19:53 UTC to fix a Comey/Comet autocorrect.
[Blog Post] Electoral College: Trump Surge https://t.co/EeFTryIk2O
RT @ElectionGraphs: [Blog Post] Electoral College: Trump Surge https://t.co/EeFTryIk2O
RT @ElectionGraphs: [Blog Post] Electoral College: Trump Surge https://t.co/EeFTryIk2O
.@AmyNotAmy @carl_diggler My thoughts are in my latest update: Trump Surge (@ElectionGraphs) https://t.co/J2ZoRjBYJy
There are reports that black turnout is down from 2012 due to a lack of high enthusiasm for Clinton among black voters. This could make a big difference in Pennsylvania. In addition, the transit strike in Philadelphia could also have an impact. Democrats are worried about this. In other words, even if Trump does not win over many undecideds in Pennsylvania, voter turnout could favor him enough to provide a victory. In addition, there have been reports of voter fraud in Pennsylvania which might, after investigation, cancel some Clinton votes. Of course this assumes Trump will contest a close race, which I think is almost a certainty.
RT @ElectionGraphs: [Blog Post] Electoral College: Trump Surge https://t.co/EeFTryIk2O
.@hacker4u2k15 See my post from earlier today. I have added a few polls since then, but overall picture the same. https://t.co/uVqKpuJdbW
https://t.co/cQVuSznk4b
Honestly these ‘reports’ of fraud are nothing but twaddle, one side reportedly has dead men voting and the other side are putting cameras in polling places and engaging in voter suppression…
Truth is there has been only one case of fraud so far anywhere that has led to an arrest. A Trump supporter in Iowa voted twice and got caught.
Now I know the USA is not a Democracy per se, but it is at least supposed to be democratic. If an election was run like this in Africa, Asia or South America there would be questions and poll watchers from other countries to oversee the process.
The accusations, counter accusations, gerrymandering, disenfranchising and attempts at legal voter suppression have no place in a country that’s supposed to be an example of how to do things properly.
Any thoughts on why campaign internal polling (on both sides as I understand reports) hasn’t shown the same volatile results as public polling?
Presumably it’s done the same way, same or similar companies and so on. What would the difference be? Is it something in the LV screen?
I can understand a natural tightening of the race (undecided voters historically breaking, on average, 2:1 in favour of the challenger, swings away from third parties etc). Evidence also suggests that this hasn’t been HRC losing support, but DT gaining some of his soft support back.
I think I’m going to stick with my prior prediction, even though it looks less likely. Strong win for Clinton, possibly as high as 400EV, but realistically nearer the 350 or thereabouts mark (330+ certainly). I can see IA or OH flipping, just as I can see NC going the other way. I can also see there being one or two surprises, AK, GA, AZ or UT looking most likely to do that.
Anyone else care to make an (equally vague) prediction?
Richard: according to the guy who runs predictwise, a lot of volatility in polls is from “partisan non-participation”. For example, after the Comey letter, Clinton supporters were less likely to want to talk to a pollster. But they are still going to vote for her. Perhaps the internal polls have some way of compensating for that effect?
I won’t make any predictions, other than Trump will not concede.
[Confidential to abulsme: I think I finally figured out what “abulsme” means. One question though. Is the “b” meaningful or just to throw people off track?]
Ben,
I’ve seen similar explanations but it doesn’t make sense to me because they would still be talking to a pollster – be it a campaign, partisan, sponsored poll, tracking poll or university department.
But if campaign people can filter for this, then why can’t others?
We know that screens are in place for LV, and that tweaks are made for demographic weight (although some overcompensate, like the 19 year old black trump supporter in IL who skews the LA Times poll) and we know all pollsters use their own models that can have inherent bias.
With the exception of extremely partisan pollsters, I was under the impression that campaign polling was generally quite accurate and generally in agreement – enough that states/areas/demographic groups could be targeted, or given up as lost causes and usually in tandem.
So how come the average ‘pollsters on the street’ can’t be so accurate?
Yeah, I’m not sure how you could accurately correct for partisan non-participation. I mean, you might be able to measure it, if for example, the percentage of Democrats responding to your poll suddenly dropped, but I don’t see how you could compensate for it without making up numbers out of thin air. Perhaps when participation drops abruptly they average in the new data more cautiously?
Like I said, this is an idea from the guy who runs PredictWise (David Rothschild); apparently, it was his thesis, so he’s rather fond of the theory. There’s a live video on his site talking about it. (Again, I’d post a link, but I don’t want to put abulsme to extra work.)
In terms of internal polling, I really don’t know. My assumption is that they spend a lot more money and have constantly running polls with a larger number of interviews, concentrating heavily in the states they think matter.
As for my own prediction, obviously I officially have to agree with whatever my model says, but at the moment I think I was really happy with where the model was on Sunday (Clinton 323, Trump 215), while I’m really dubious of the moves in the averages included in the last update. I expect to do an update in the next couple hours that will move Nevada back to blue (I think, peeking ahead at the handful of polls that came out since late last night when I cut off additions for the current update), but my gut tells me that Florida is blue too. North Carolina more of a tossup I think, but I might bet blue. Unofficially of course. Officially my predictions are wherever my site ends up when I do my last update a little later today.
Ben,
A better explanation (and one I may have read elsewhere) is if it’s voter enthusiasm rather than participation. If a number of supporters of a candidate go from being ‘very likely to vote’ to being ‘somewhat likely’ then they may be cut off by the likely voter screen.
If the internal screens are less aggressive with enthusiasm then that might explain some of the lack of volatility.
Heh. Well, when I made up that pattern in 6th grade, I added letters in alphabetical order to make things more easily pronounceable in English. Abulsme sounded more natural than “Aulsme”. It started as something I made up to make nicknames and such. “Ben in Seattle” would be “Enba ni Etlasat”. But remove the adding letters part, and I rapidly discovered there was an interesting connection to looking at cycles in permutations, and an interesting related mathematical function. Over a few years this developed: http://www.abulsme.com/function.html and resulted in a few things being added to the OEIS: http://oeis.org/A105272
Please feel free to post links. I may be slow sometimes in noticing that a comment needs moderation, but I will get to it eventually…
Abulsme,
I think I’d agree that all three of those are blue, possibly just, but still blue.
A lot may depend on how undecided voters break, apparently there are a historic amount of them (some 12%).
I don’t know if you gave seen it but
http://www.slate.com/votecastr_election_day_turnout_tracker.html
Is quite interesting (note that it’s a exit poll estimated figure, not an actual result)
It may give an indication of how the polls are doing for accuracy, assuming it’s accurate itself.
Yeah, I have seen that was out there, but haven’t had much time to look at it. Speaking of which, have to get back to identifying and adding the last minute polls… I think I am only missing a handful from an outfit called Insights West, but going through all my sources just in case.
The additional Tuesday polls from Insight West didn’t change the status of Nevada (or any other state) after all. I’ll keep an eye out for new polls for about another hour, then I’ll lock things down and prepare to track (through a post, not changes to the main election graphs charts) the actual changes as the states get called through the night.
From the votecaster totals it looks like HRC is running quite well in the states they are monitoring. 4 point leads in FL and PA and more in CO and WI. OH and IA look closer than expected, it may be that she takes OH and just loses IA.
Best guess, from their data, is that HRC is running a couple points ahead of polls maybe a touch more in some places.
Certainly enough to have a shot at all the Weak Trump states, even though the GA may prove a bridge too far in the end it looks plausible that the results could be closer to Clinton best case if this is replicated nationwide.
[…] To be fair though, 7 days out from the 2016 election we didn't know this yet. Her tipping point number at the 7-day mark as we look back at it today is influenced by polling that was in the field at this point, but not actually released until the last few days before the election. The first Election Graphs post noting the final Trump surge in 2016 came at the 4-day mark. […]