This is the website of Abulsme Noibatno Itramne (also known as Sam Minter).
Posts here are rare these days. For current stuff, follow me on Mastodon
|


Map and chart from the Abulsme.com 2012 Electoral College Prediction page. Both assume Obama vs Romney with no third party strong enough to win states. On the Map Red is Romney, Blue is Obama, Gold States are too close to call. Lines on the chart represent how many more electoral votes a candidate has than is needed to tie under several different scenarios. Up is good for Obama, Down is good for Romney.
At some point things have to stop getting worse for Romney, right? As he pivots from the primaries to the general election, he’ll start pulling back support from the middle and start gaining ground again, right? Well, probably. But not yet. In today’s update the 5 poll average for Michigan moves to Obama having more than a 10% lead in that state. So we color the state dark blue. Essentially this means it is a state Romney probably shouldn’t bother putting any resources into at all. The situation may change later, but for the moment, it is out of reach.
Since Michigan isn’t moving in or out of Swing State status, the overall summary remains the same with Obama clearly the favorite by a large margin, but Romney still being able to squeak by with a win if he manages to sweep all of the too close to call swing states:
|
Romney |
Obama |
| Romney Best Case |
278 |
260 |
| Current Status |
210 |
328 |
| Obama Best Case |
170 |
368 |
One thing to keep in mind at this stage is that state polling is still sparse. So the “five poll averages” I use for this analysis can cover a lot of time. For instance, in Michigan my five poll average currently has polls that were done all the way back through January. (Specifically it includes one from January, two from February, one from March and one from April.)
There are still just a handful of state polls per week. Some states actually haven’t even been polled at all and I’m extrapolating based on the 2004 and 2008 elections. I’m also doing a straight average, not a recency weighted average. Because of this, this analysis will react more slowly to changes in the political situation.
At least that is the situation here in April. As we get closer and closer to November, we’ll have a faster and faster pace of polls. By the time we get to October we will have many new state polls every week, and changes in this analysis will be much more frequent and catch changes faster.
Edit 2012 May 30 15:49 UTC: It turns out that between the last update on Mar 30 and this one New Hampshire should have moved from Weak Romney to Lean Romney on Mar 31. At that time however, I was missing some polls and thought New Hampshire was already Lean Romney, so no update was posted. This is corrected in the historical charts starting on May 30.


Charts from the Abulsme.com 2012 Republican Delegate Count Graphs page. When a candidate gets down to 0%, they have cinched the nomination. If they get up past 100%, they have been mathematically eliminated. The first chart is by date, the second is by “% of Delegates Already Allocated”. These numbers include estimates of the eventual results of multi-stage caucus processes which will be refined as the later stages occur.
You’d think the remaining superdelegates would be rushing in a mob to get on the Romney bandwagon at this point, but not so far. We have an additional super from Massachusetts today. Well, actually DCW identified the new super on Saturday, but it took Green Papers a few days to update their Massachusetts numbers. Since we go by Green Papers here, we waited. :-)
In any case, this is only one delegate, so only very minor changes to the “% of remaining needed to win” numbers:
- Romney: 42.54% -> 42.49%
- Santorum: 77.49% -> 77.56%
- Gingrich: 87.47% -> 87.54%
- Paul: 94.62% -> 94.70%
And now we continue to yawn and wait in the lull before the next actual contests. Not that there is much contest left anyway, but Romney still does need to mop up the rest of the 1144 delegates he needs.


Charts from the Abulsme.com 2012 Republican Delegate Count Graphs page. When a candidate gets down to 0%, they have cinched the nomination. If they get up past 100%, they have been mathematically eliminated. The first chart is by date, the second is by “% of Delegates Already Allocated”. These numbers include estimates of the eventual results of multi-stage caucus processes which will be refined as the later stages occur.
So… remember yesterday when I removed three delegates from Romney’s column because Green Papers decided the three super delegates in Wisconsin were not bound by the primary results? Well, in today’s update they put them back. They are now officially “uncommitted” in their hard count, but are Romney in the soft count (which we use for these charts). The soft count indicates not just the official status, but other indicators of the ways the delegates are likely to vote.
In any case, this reverts things to how they were a couple days ago on our charts.
I’m sure Romney will breathe a lot easier with these three delegates back in his column. :-)


Charts from the Abulsme.com 2012 Republican Delegate Count Graphs page. When a candidate gets down to 0%, they have cinched the nomination. If they get up past 100%, they have been mathematically eliminated. The first chart is by date, the second is by “% of Delegates Already Allocated”. These numbers include estimates of the eventual results of multi-stage caucus processes which will be refined as the later stages occur.
So, Green Papers updated their Wisconsin numbers. They had been 33 Romney, 9 Santorum. They are now 30 Romney, 9 Santorum, 3 still available. Green Papers’ latest update commentary indicates that they had previously thought these superdelegates were bound by the primary results, but it turns out they are not. DCW still says however that those superdelegates are bound by the election results and don’t have independent free choice here, in which case they probably really should be in the Romney column. In fact DCW only made that change on the 4th. So I’m not really sure who is right here.
For purposes of our counts, we go with Green Papers though, so Romney loses the three delegates from his count. If information is found that these superdelegates are bound after all, Green Papers will update accordingly.
The changes to the “% of remaining delegates needed to win” number:
- Romney: 42.5% -> 42.7%
- Santorum: 77.5% -> 77.3%
- Gingrich: 87.5% -> 87.2%
- Paul: 94.6% -> 94.4%
So bad for Romney (since he loses 3 delegates for now) and good for everybody else since these delegates are theoretically now up for grabs again.
But really, this changes nothing.
Romney is the nominee.
Edit 2012 Apr 6 07:07 UTC to refer to both GP and DCW’s views on the 3 superdelegates being bound after I found GP’s comments on this.

We’d last talked about this after Louisiana. But at that point in terms of % of delegates allocated the 2012 progress in the race still hadn’t gotten to where we were in 2008 immediately after Super Tuesday. We were in the 2008 “gap” caused by the large number of delegates allocated on Super Tuesday in 2008. At this point in the race, on April 4th, we are STILL not quite past where we were once all the 2008 Super Tuesday delegates were counted. But we are close…
And once again, we see that, yes, Romney is behind where McCain was at the corresponding place in the delegate hunt. But it is very close. It is not a big substantial difference. Right now we have 50.4% of the delegates allocated and Romney has 29.0% of them. On the day in 2008 we finally had all the results from Super Tuesday (February 9th) we had 52.1% and McCain had 30.0% of the delegates.
So Romney is 1.0% or so behind McCain’s pace from 4 years ago once you are looking at an even scale based on % of delegates determined so far. These lines fairly neatly track each other. There is NOT a substantial gap where Romney was underperforming McCain.
The perception certainly has been that there was. Romney having problems wrapping it up and such. But this is 100% due to the stretched out calendar. It is not due to winner take all vs proportional. It is just about the calendar. The fact that here on April 4th, we STILL haven’t allocated as many delegates as were allocated on February 9th back in 2008 is extraordinary. This is why it SEEMS like it has taken a lot longer to wrap things up… because it has! But in terms of the calendar only. The Republicans stretched out the whole race by spreading the contests out, so of course it takes more calendar time for the winner to consolidate their win. Duh.
But this doesn’t support the conclusion that Romney was somehow less able to consolidate Republican support than McCain was. They really have moved through the process at a remarkably similar rate.
It just doesn’t seem like it because the process is so stretched out this time.


Charts from the Abulsme.com 2012 Republican Delegate Count Graphs page. When a candidate gets down to 0%, they have cinched the nomination. If they get up past 100%, they have been mathematically eliminated. The first chart is by date, the second is by “% of Delegates Already Allocated”. These numbers include estimates of the eventual results of multi-stage caucus processes which will be refined as the later stages occur.
So… this is it. Long ago any realistic possibility for any non-Romney to win the nomination disappeared. With today’s update the already long odds for the non-Romneys to keep Romney from getting to 1144 essentially drop to zero. This is over. Romney wins. Without any sort of brokered convention. For something else to happen now we’d need some event that was so earth shaking that Romney dropped out. This is extremely unlikely.
Details below.
We have updates from four contests. In alphabetical order:
- DC: DC is winner take all, Romney gets all 16 delegates.
- Maryland: Maryland is not actually winner take all, you get some delegates for winning the state, and then more delegates go to the winner of each congressional district. But Romney not only won the state, but every congressional district. So Romney gets all 37 delegates.
- North Dakota: North Dakota had the first round of its process in March. At that time the delegate estimate was Santorum 11, Paul 8 , Romney 7 , Gingrich 2. But the state Republican Convention happened last weekend, and Romney supporters owned the parliamentary process, taking the lion’s share of the delegates despite coming in third in March. That’s how it works in caucus states sometimes. It took a couple days for Green Papers to confirm a new estimate, but it now looks like Romney 20, Santorum 6, Paul 2. So the net today is Romney +13, Gingrich -2, Santorum -5, Paul -6.
- Wisconsin: Wisconsin also allocates some delegates based on both state and CD winners. Romney won the state. Romney won 5 CDs. Santorum won 3 CDs. So overall we have a delegate count of Romney 33, Santorum 9
Add those up and we have a net total for today of Romney +99, Santorum +4, Gingrich -2, Paul -6 Obviously Romney completely dominated the day.
In terms of “% of remaining delegates needed to win” we have this:
- Romney: 47.3% -> 42.5%
- Santorum: 71.8% -> 77.5%
- Gingrich: 80.5% -> 87.5%
- Paul: 86.8% -> 94.6%
The also-rans who left the race early on… Bachman, Huntsman and Perry… are mathematically eliminated after today. Paul, Gingrich and Santorum will inevitably join them soon.
The blocking Romney option? At this point the non-Romneys collectively would need to get 57.5% of the remaining delegates. So far they have managed 42.6% of the delegates. A change of this sort, while not mathematically impossible, would be unprecedented, especially since we are in the phase of the campaign where it is clear Romney is winning and the others are losing. People just stop voting for losers. As things go on, the % of delegates the non-Romneys get will probably actually decline. A major increase is just not going to happen.
It is over.
(We will of course continue to update these charts until Romney actually gets to 1144 however.)
Sometime a few weeks ago I looked at the upcoming states and misread something and got it stuck in my head that DC, MD and WI were all winner take all states. I then repeated that a number of times on this blog and in my podcast.
BUZZZ!!
DC is indeed winner take all, but MD and WI are only “Winner take all by State and Congressional District”. So some delegates are chosen winner take all by the state results, and then additional delegates are allocated for the winners of each congressional district. So not really WTA.
Oops. Sorry about that. In any case, when I post delegate updates they will of course reflect the actual delegate distributions, not my imaginary winner take all results. This does mean that today will probably not be quite as much of a knockout punch for Romney as I expected, but it is looking to still be a pretty decisive victory, certainly more than he needs to be on pace for 1144.
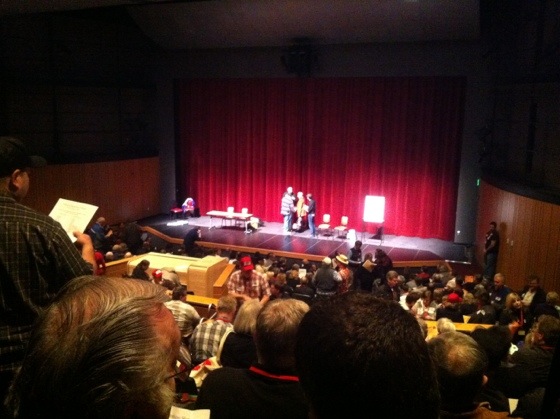
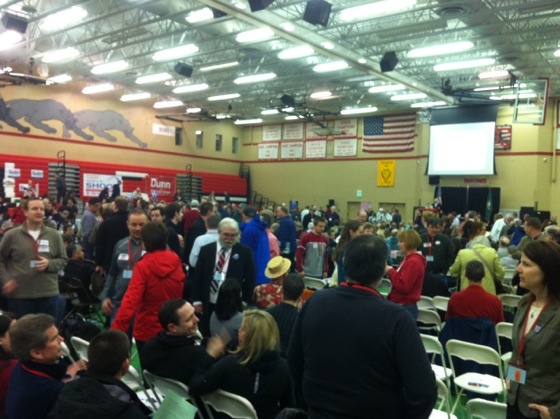
As I did with the Precinct Caucuses on March 3rd, I’ll be attempting to Live Tweet the Snohomish County Republican Convention today.
Follow me @Abulsme.
For those who remember my tweets on March 3rd only three people showed up for my precinct and given there were three delegate slots available to the county convention, all three of us became delegates to the next level. Although it is non-binding, I had expressed my preference for Ron Paul. (The other two supported Santorum.) Last weekend I attended an orientation meeting for the Ron Paul delegates. For those interested, I talked a little about that meeting on the last episode of Curmudgeon’s Corner.
I should have left home already to get all settled at the convention before the crowds arrive. But a few notes before I go…
According to the orientation I had last week, in my legislative district, the 44th, almost half of the delegates are Romney supporters, about 25% are Ron Paul Supporters, 15% or so did not have a stated preference, and Santorum and Paul split the rest. There are a little over 260 delegates expected for our LD (I forget the exact number). For anybody to get elected as a delegate to the next level they need more than 50% of the vote of all of the delegates in the LD. This means that if every body shows up and all the Romney folks just vote for each other (and are disciplined and vote for the SAME Romney people), and just a small number of the uncommitted delegates also vote for Romney’s folks, then Romney will end up with 100% of the delegates to the next level, even though he got just under 50% of the delegates from the first round.
Meanwhile, if all the Ron Paul folks (for instance) just vote for each other, then none of them gets over 50% of the total vote, and they get no delegates to the next level despite the 25% showing in the first round.
Interesting how these things work.
For the non-Romney campaigns, the hope is that basically:
- A bunch of the Romney delegates don’t bother showing up (and disproportionately so compared to their own delegates)
- Discipline among the Romney delegates to vote for a consistent slate is low, allowing others to sneak in
- The three non-Romney’s delegates will vote for each other to stop Romney, even though they don’t necessarily like each other.
It will be fun. Oh, and we’ll get to hear speeches from a ton of local Republican politicians. Woo!
Oh, and for the record once again, I am supporting Ron Paul in the Republican caucus process because I think he is the best of the four Republicans currently running. I completely reserve judgement on who I will support in the fall. I’ll think about that once it is completely clear who all the people are on the ballot (not just the Republican and Democrat, which is pretty clear at this point absent some sort of seismic event).
OK. Off I go…
|
|