Trump did very well yesterday in PA/MD/CT/RI/DE.
In pledged delegates the results were Trump 110, Kasich 5, Cruz 3.
That is a crushing win, but that is not why I say everything is falling into place. Trump did a little better than expected in pledged delegates, but a massive Trump win had been expected for awhile. This was not a surprise, and was already baked into people’s projections for the rest of the race.
Even with this built into the expectations, as of my post last week we were looking at odds between about 40% on the low side and 64% on the high side for Trump actually getting to 1237 delegates and having an outright majority before the convention. A week later, several things change that and make an outright Trump win look far more likely, and a multi-ballot convention much less likely. If it isn’t the pledged delegate results from last night, then what is it?
The first thing is the officially uncommitted delegates from Pennsylvania. In past contests Trump has done a horrible job getting his loyalists into the slots that are nominally uncommitted, or for that matter even into the slots that are bound to him on the first ballot. It was plausible to expect that Trump would do similarly poorly with Pennsylvania’s uncommitted delegates which are elected by name on the ballot… without any indication on the ballot of who they support.
But Trump appears to have gotten his act together, making sure delegate slates were available to Trump supporters and such. Between delegates that explicitly said they support Trump, and those who said they would vote the way their district went (and all of them went for Trump), Trump ends up with 45 of the 54 uncommitted delegates by my estimates. There is some ambiguity in the statements made by some of these uncommitted delegates and some other folks have estimated the number of Trump votes slightly lower. But all the estimates have Trump winning most of these delegates.
This was unexpected, and also gives more confidence of Trump’s delegate wrangling abilities going forward. (Although Pennsylvania was the biggest pot of uncommitted delegates.)
Add in the uncommitted delegates that have expressed a preference (45 Trump, 3 Cruz, 3 Kasich, 3 TBD) and 2 additional uncommitted Cruz delegates from North Dakota that I logged in the last week, and the net change since New York ends up as:
Trump +155, Cruz +8, Kasich +8.
The new raw totals look like this:
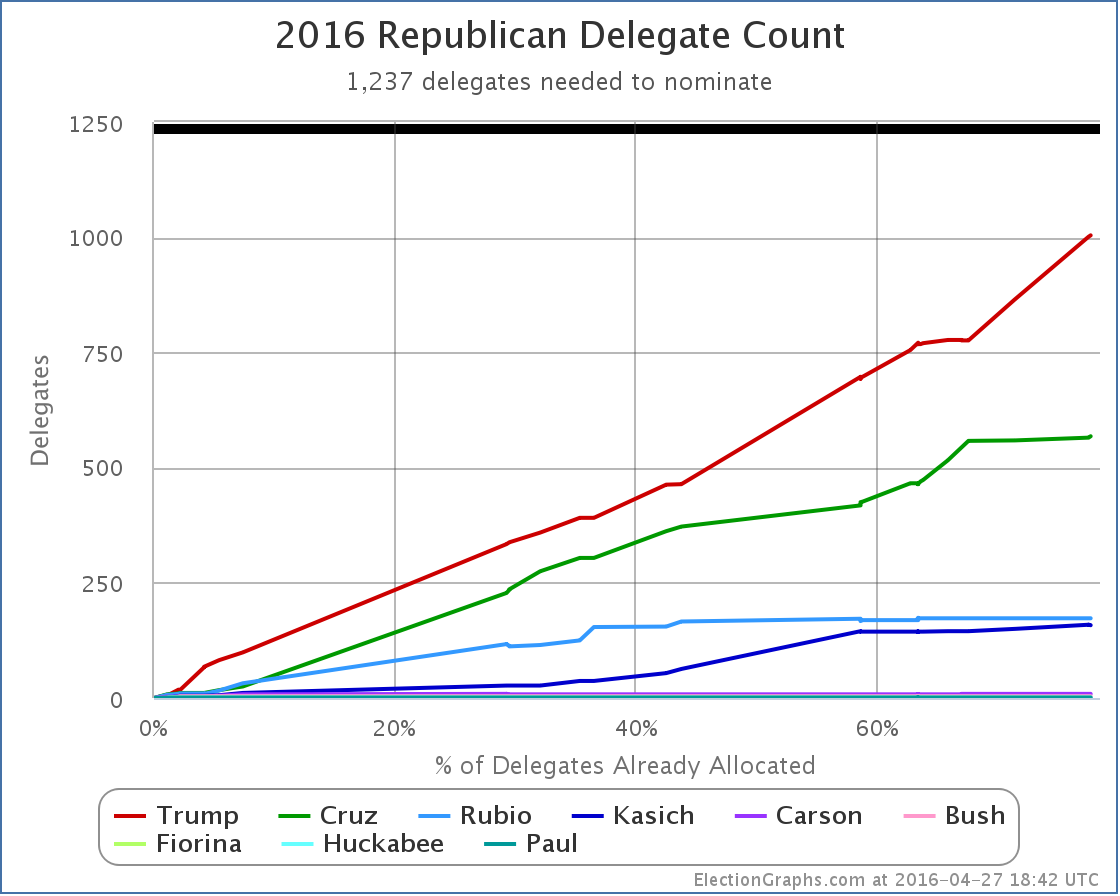
The finish line is in sight. Trump only needs 233 delegates to win this thing directly. No multi-ballot convention, just a straight up win on the first ballot.
For the first time since Super Tuesday at the beginning of March, Trump also actually has a majority of the delegates so far… 52.32% of the delegates.
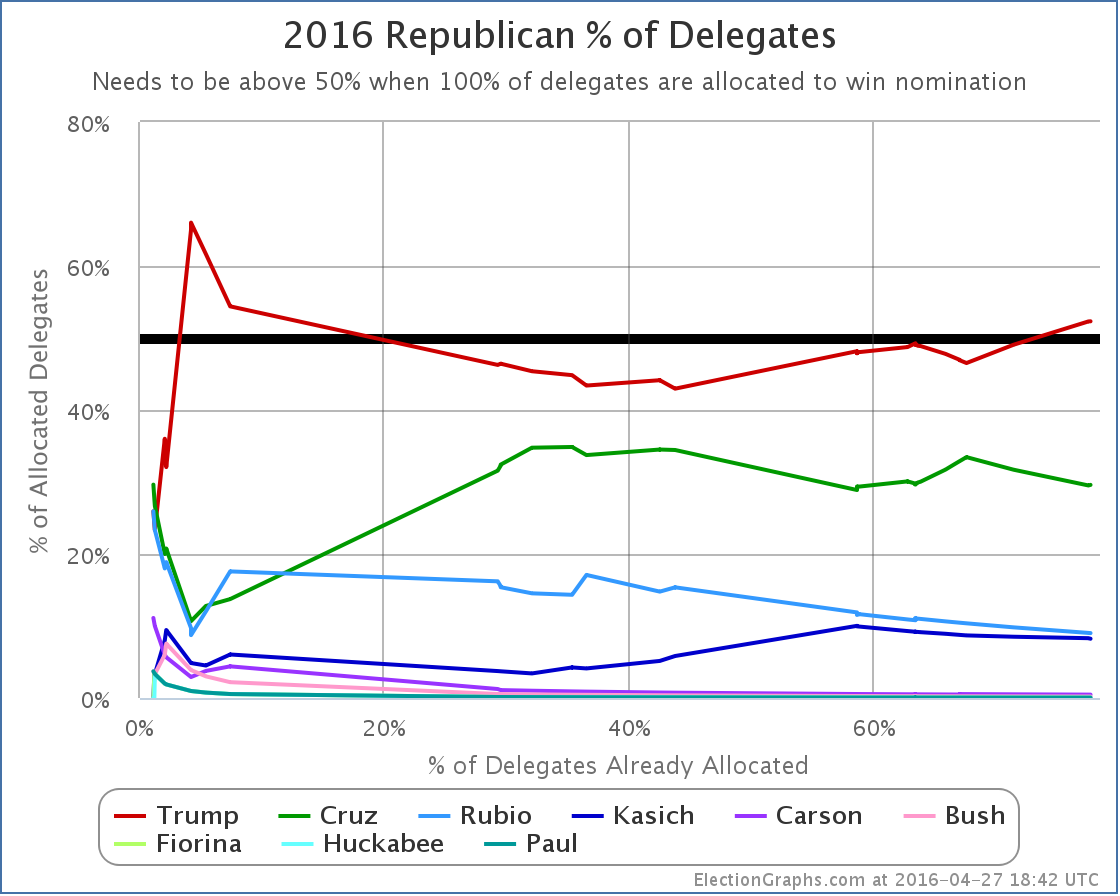
But what does it take to keep that? Time for the “% of remaining delegates needed” graph:
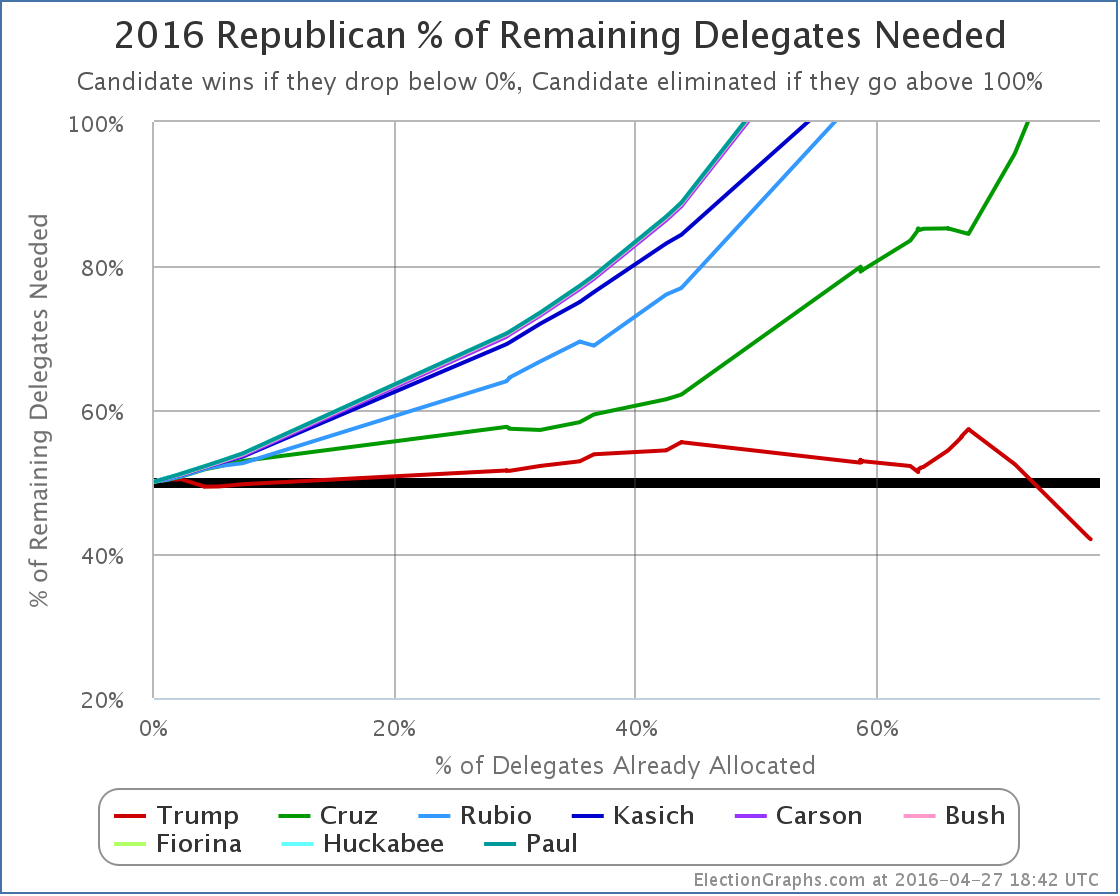
First note that with yesterday’s results Cruz has been mathematically eliminated from the possibility of a first ballot victory. Trump is now the ONLY candidate that can win on a first ballot. Everybody else is done unless there is a brokered convention… or I suppose unless Trump drops out or something crazy like that.
Looking directly at Trump’s line… Trump needed 53.52% of the delegates to improve his position. Since New York he actually got 90.64% of the delegates. This obviously means his position improved a lot. He now only needs 42.06% of the remaining delegates to win.
That means he could do 20% worse at delegate gathering in all the remaining contests than he has so far and still win.
If the Republicans allocated delegates proportionately everywhere like the Democrats do, this would clearly be over. It would be Trump’s nomination, and we’d be done.
Because of how so many Republican states tilt the delegate results to the winner though, if the anti-Trump’s were strong, there would still be a path to block Trump.
The anti-Trump scenarios that gave us odds of a multi-ballot convention relied on three things.
The first we mentioned above… Trump’s failure to win delegates when they were selected individually instead of being bound to primary results. Trump dispensed with that in Pennsylvania.
The second was Indiana. Until the last week, Indiana had not been polled. The anti-Trump contested convention scenarios all relied on Trump losing Indiana. Well, last week Indiana was finally polled. Three times. The results? The RCP average has Trump +6.3%. Given Indiana’s delegate rules, a win like that would get Trump most of Indiana’s 57 delegates… possibly all of them. Oops. And Trump now only needs to be getting 42% of the delegates to be on pace to win.
The third was California. Trump has been ahead in the polls in California forever. But the anti-Trump folks were hoping to keep him from winning by too much and to hold down his delegate total. But in the last week of polling, Cruz has been falling and Trump has been rising, so Trump’s margins have just been growing. RCP now has a 17.4% Trump lead in their California average. Assuming Trump wins Indiana and some of the other remaining states, Trump will very likely only need 30% or less of the delegates in California in order to wrap things up. If he is winning by almost 20%, that is going to be very easy to achieve.
The simulator at The Upshot using default assumptions now shows an almost certain Trump win.
The FiveThirtyEight simulator “follow the experts” model shows Trump 27 votes short of the magic number… but they don’t include ANY of the officially uncommitted delegates that have said they support Trump. Add those in… there are just under 50 of them now depending how you count… and you are easily over 1237.
Finally, Sam Wang’s numerical simulations of the rest of the race have moved from a 64% chance of a Trump win a little over a week ago to a 94% chance today.
I see no reason to disagree with this estimate.
We are no longer on a knife’s edge between a contested convention and an outright Trump win.
#NeverTrump is now hanging on by a thread. They maybe aren’t quite as far gone as Sanders is on the Democratic side, but it is getting close. Their last hope is to try to start turning things around with a surprise win in Indiana. Even with that though, Trump’s odds look very good.
Between yesterday’s results, polls in Indiana, and polls in California, this now looks like an almost certain outright Trump win.
This is now Trump’s to lose. Given everything he has done so far that pundits thought would sink him but in fact only strengthened him, it is hard to see how exactly that would happen.
So… time to start paying more attention to Clinton vs Trump. Right now that looks like Clinton 338 to Trump 200, a 138 electoral vote win for Clinton. But things are still early, and that will change…
Update 2016-05-02 17:52 UTC: Uncommitted delegate update plus adjustment in Rhode Island. Net change: Trump +1, Cruz -2.
Update 2016-05-03 03:53 UTC: Uncommitted delegate update checking multiple sources. Net change: Cruz +2, Kasich -2, Trump -4. (See my wiki for my current best estimates of uncommitted delegate preferences.)
Update 2016-05-04 08:11 UTC: Updates (including uncommitted) in Nevada, Wyoming and North Dakota. Net change: Cruz +6, Carson -2.
Note: This post is an update based on the data on ElectionGraphs.com. Election Graphs tracks both a poll based estimate of the Electoral College and a numbers based look at the Delegate Races. All of the charts and graphs seen in this post are from that site. Additional graphs, charts and raw data can be found there. All charts above are clickable to go to the current version of the detail page the chart is from, which may contain more up to date information than the snapshots on this page, which were current as of the time of this post. Follow @ElectionGraphs on Twitter or like Election Graphs on Facebook to see announcements of updates or to join the conversation. For those interested in individual general election poll updates, follow @ElecCollPolls on Twitter for all the polls as they are added.