This is the website of Abulsme Noibatno Itramne (also known as Sam Minter). Posts here are rare these days. For current stuff, follow me on Mastodon

Categories

Calendar

March 2024
S M T W T F S
 12
3456789
10111213141516
17181920212223
24252627282930
31  

Curmudgeon’s Corner: Attack on the Capitol

On this week’s Curmudgeon’s Corner, Sam and Ivan throw the previous plan out the window, and spend the entire show talking about the January 6th attack on the Capitol and all the ramifications of that attack. There really was no other possible topic this week. They’ll circle back around and do the review of their 2020 predictions some other time.

Click below to listen and subscribe!

1-Click Subscribe in iTunes
View Podcast in iTunes
View Raw Podcast Feed
Download MP3 File
Follow the podcast on Facebook
patreon-30x30 Support us on Patreon

Show Details:

Recorded 2021-01-08
Length this week – 1:34:28

  • (0:00:22-1:34:07) Attack on the Capitol
    • 2020 Review delayed
    • Could have been worse
    • Security / Use of force / Arrests
    • Administration responsibility?
    • Counting the Electoral Votes
    • MAGAworld Reaction
    • What about the Inauguration?
    • Fleeing rats
    • 25th Amendment?
    • 2nd Impeachment?
    • Resignation?
    • Emotional impact
    • Not out of danger
    • Consequences
The Curmudgeon’s Corner theme music is generously provided by Ray Lynch. Our intro is “The Oh of Pleasure” (Amazon MP3 link) Our outro is “Celestial Soda Pop” (Amazon MP3 link) Both are from the album “Deep Breakfast” (iTunes link) Please buy his music and support his GoFundMe.

Democrats: Clinton closes out the primary season with a win

Clinton clinched the nomination last week, but DC still hadn’t voted. Now they have.

Clinton got 16 delegates, Sanders got 4.

Since last week when I posted the CA/NJ/NM/MT/SD/ND results, we had updates from CA/NJ/SD as well as many to superdelegate preferences. The net result of all of these was Clinton +7, Sanders +5.

So net change since last week: Clinton +23, Sanders +9.

All the caucuses and primaries are now over. There are still 116 superdelegates who have not expressed a preference publicly, but what they do at this point no longer matters to the nomination. Similarly, while it is possible that the superdelegates who have already supported someone could change their minds, it is unlikely to happen in significant numbers absent an earthshaking surprise.

So we are done.

Lets look at the updated graphs:

chart-169

The delegate count is now: Clinton 2768, Sanders 1881, with 116 TBD.

chart-170

Clinton now has 59.54% of the delegates, Sanders has 40.46%.

chart-171

It didn’t change with the DC results since the race was already won, but here again is the “% remaining needed to win” chart.

There isn’t much else to see here absent unexpected craziness. I gave my thoughts wrapping up the Democratic race last week. If there are any additional developments you will see them here. But aside from straggler superdelegates revealing their preferences, nothing of significance is expected.

The Republicans are done too of course.

We have Clinton vs Trump. It is time to settle down and get comfortable for the general election coverage.

146.4 days until the polls start to close on Election Day 2016. Buckle up!

Update 2016-06-18 16:19 UTC – Superdelegate update: Clinton +12, Sanders -1.

Update 2016-06-22 15:47 UTC – Superdelegate update: Clinton +3.

Update 2016-06-22 15:48 UTC – Update from California: Clinton -8, Sanders +8.

Update 2016-06-24 17:06 UTC – Superdelegate update: Clinton +2.

Update 2016-06-28 06:39 UTC – Superdelegate update: Some shuffles, but zero net change.

Update 2016-06-30 06:00 UTC – Update from California. Net change: Clinton -1, Sanders +1

Update 2016-07-01 05:00 UTC – Update from California. Net change: Clinton -1, Sanders +1

Update 2016-07-10 16:00 UTC – Update from California and the Virgin Islands. Net Change: Clinton -1, Sanders +2

Update 2016-07-12 03:33 UTC – Superdelegate update: Clinton +2

Update 2016-07-13 03:56 UTC – Superdelegate update: Net change Clinton +1, Sanders -1. This is Sanders endorsing Clinton.

Update 2016-07-17 15:30 UTC – Superdelegate update: Clinton +3. Update from Puerto Rico: Clinton +1, Sanders -1

Update 2016-07-18 14:25 UTC – Superdelegate update: Clinton +1.5, Sanders -1.5

Update 2016-07-20 07:27 UTC – Superdelegate update: Clinton +2, Sanders -1

Update 2016-07-21 15:56 UTC – Superdelegate update: Clinton -1. This was due to Rep Takai (HI) dying, so total number of delegates also -1.

Update 2016-07-26 07:27 UTC – Final superdelegate update: Net change Clinton +1. This makes the final totals Clinton 2782.5, Sanders 1889.5. Next update will be the convention roll call.

Update 2016-07-28 15:34 UTC – Actual convention roll call results were Clinton 2842, Sanders 1865, DNV 56. So Clinton gained 59.5 delegates while Sanders lost 24.5 delegates compared to the last estimates here.

Note: This post is an update based on the data on ElectionGraphs.com. Election Graphs tracks both a poll based estimate of the Electoral College and a numbers based look at the Delegate Races. All of the charts and graphs seen in this post are from that site. Additional graphs, charts and raw data can be found there. Follow @ElectionGraphs on Twitter or like Election Graphs on Facebook to see announcements of updates or to join the conversation. For those interested in individual general election poll updates, follow @ElecCollPolls on Twitter for all the polls as they are added. If you find the information in these posts interesting or useful, please consider visiting the tip jar.

Republicans: A look back at Saturday, forward at Tuesday, and back again at Romney and McCain

Saturday brought Republican results for DC, Guam and Wyoming. The number of delegates coming out of this was small, turnout was tiny, and there had been no polling. But the results were surprisingly bad for Trump. Between these three we ended up with:

Rubio +11, Cruz +10, Kasich +9, Trump +1

This by the way is much worse for Trump than the model in my last post predicted, since it used national polls in the absence of actual polls for these three places.

There were also 9 “uncommitted” delegates selected yesterday. These people essentially become like the Democratic superdelegates, in that they are free agents at the convention. If I find out their preferences, I’ll assign them to the candidate they support, but for now they remain TBD. With all the contests so far there are actually 22 of these now. It will be interesting to see if they make a difference.

In any case, with only 1 of 30 delegates from Saturday, or 3.33%, Trump fell very far short of the 54.39% of the delegates he needed to be on the path to an outright win instead of a contested convention.

chart-76

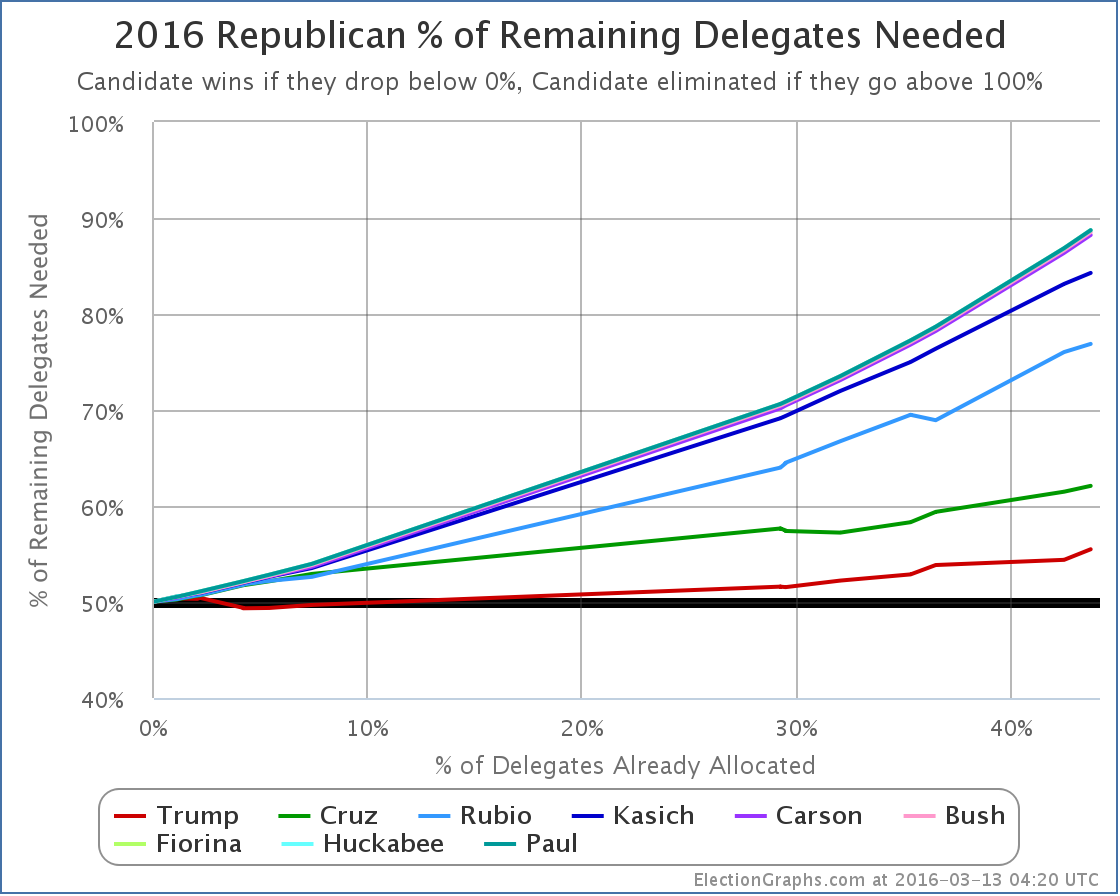
Trump now needs 55.49% of the remaining delegates to win outright. This number is getting high. And the gap between what Trump has done so far (42.96% of delegates) is getting larger. Nobody else got what they needed either of course, so everybody’s numbers got worse, not just Trump’s.

Of course, we still have some big winner take all and winner take most states coming up, so time to refresh the poll based predictions for Tuesday and see what they look like now. As usual, using RCP poll averages and delegate distribution rules from Green Papers.

Florida – 99 delegates – March 15th:

  • Poll averages: Trump 41.4%, Rubio 23.3%, Cruz 19.7%, Kasich 9.6%
  • Delegate estimate: Trump 99

North Carolina – 72 delegates – March 15th:

  • Poll averages: Trump 35.6%, Cruz 23.8%, Rubio 13.0%, Kasich 10.4%
  • Delegate estimate: Trump 31, Cruz 21, Rubio 11, Kasich 9

Illinois – 69 delegates – March 15th:

  • Poll averages: Trump 34.3%, Cruz 25.3%, Kasich 18.3%, Rubio 14.8%
  • Delegate estimate: Trump 35, Cruz 15, Kasich 11, Rubio 8

Ohio – 66 delegates – March 15th:

  • Poll averages: Kasich 35.3%, Trump 33.3%, Cruz 20.0%, Rubio 5.8%
  • Delegate estimate: Kasich 66

Missouri – 52 delegates – March 15th:

  • Using only recent poll: Trump 36.0%, Cruz 29.0%, Rubio 9.0%, Kasich 8.0%
  • Delegate estimate: Trump 52

Northern Marianas – 9 delegates – March 15th:

  • No polls, using national avg: Trump 36.0%, Cruz 21.8%, Rubio 18.0%, Kasich 12.0%
  • Delegate estimate: Trump 9

The main difference from the estimate a few days ago is that now Kasich is ahead in Ohio, and wins the 66 delegates there. This makes a big difference.

Adding these up:

Trump +226, Kasich +86, Cruz +36, Rubio +19

Trump would get 61.6% of the delegates on Tuesday. Which even without Ohio would be above the 55.49% he needs to be tracking toward a clean win.

The new totals would be:

Trump 690, Cruz 408, Rubio 185, Kasich 149, Others 15

Trump would have 47.7% of the delegates. Still not a majority.

When you do all the math at the end of all that, Trump would need 53.37% of the remaining delegates to cleanly win a majority of the delegates. That would still be a substantial improvement from what he had been doing so far.

But there would be more winner take all states coming up. And Cruz, Rubio and Kasich would be so far behind that the scenarios where they would catch up would be extremely far fetched. None of them can win outright. At best they can block Trump. Do all three of them stay in? Do their donors continue to support them in a bid where the only real goal is a contested convention? Can they really keep blocking him from getting a majority of the delegates through a long slog from now until June 7th?

The “Trump wins Florida, but loses Ohio” scenario is the one where it would be premature to say either “Trump will win this outright”, or “Contested Convention”. Instead, we’ll still be hovering between those possibilities, waiting for more states to weigh in.

This might go on awhile.

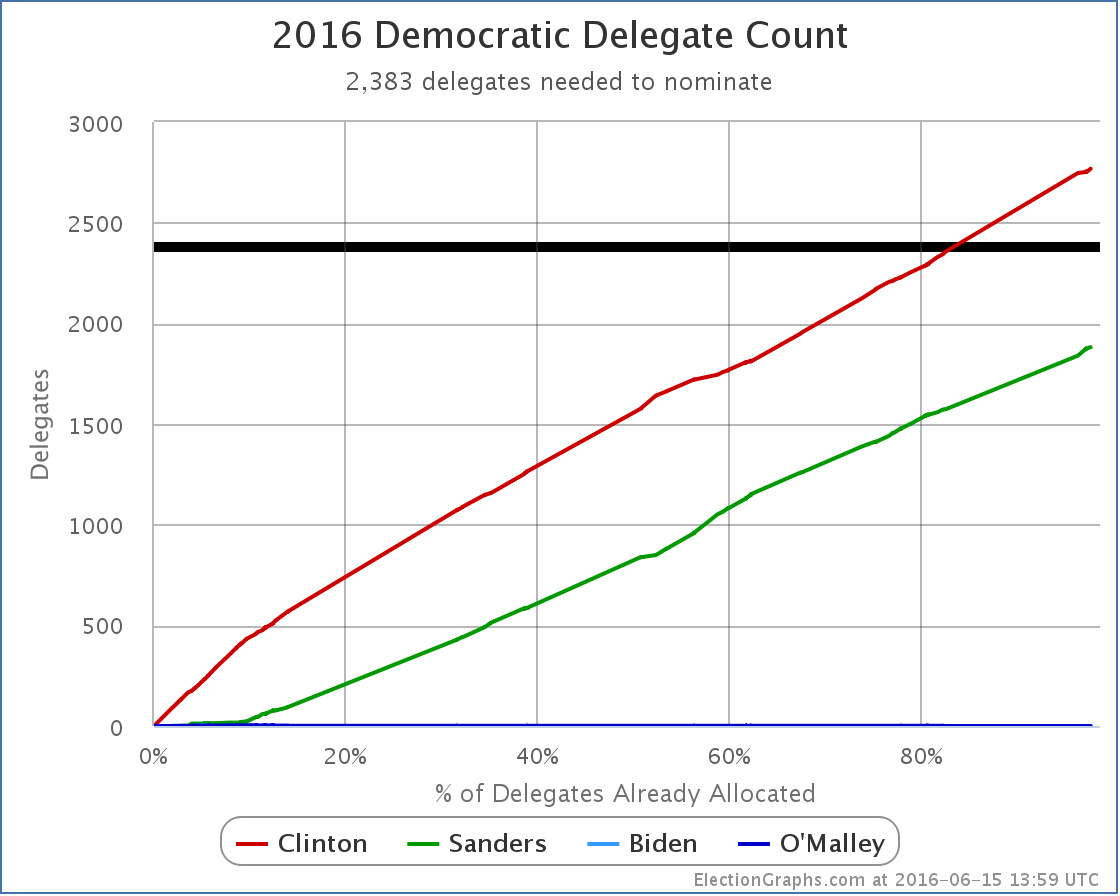
Finally, as I did with the Democrats earlier, a quick look back, comparing Trump today with Romney in 2012 and McCain in 2008.

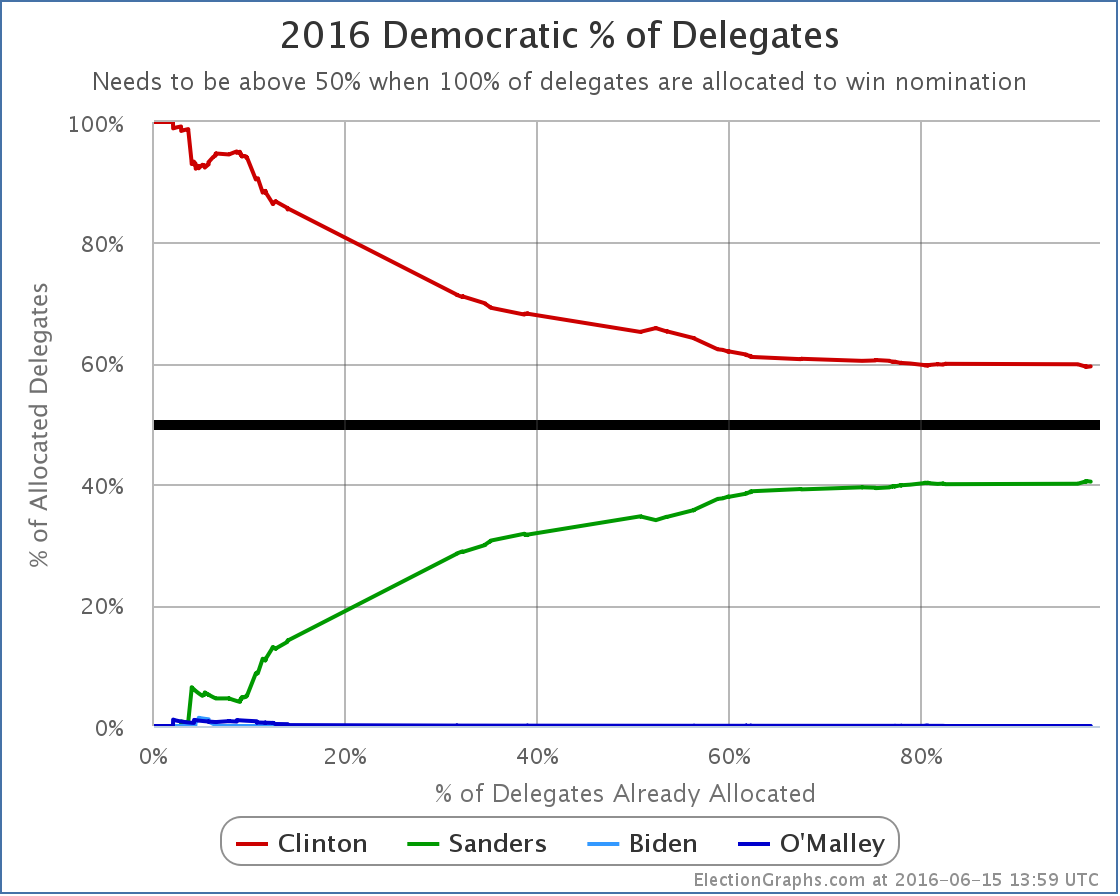
First, just looking at the percent of delegates they had as the race progressed:

Screen Shot 2016-03-13 at 21.47.49043

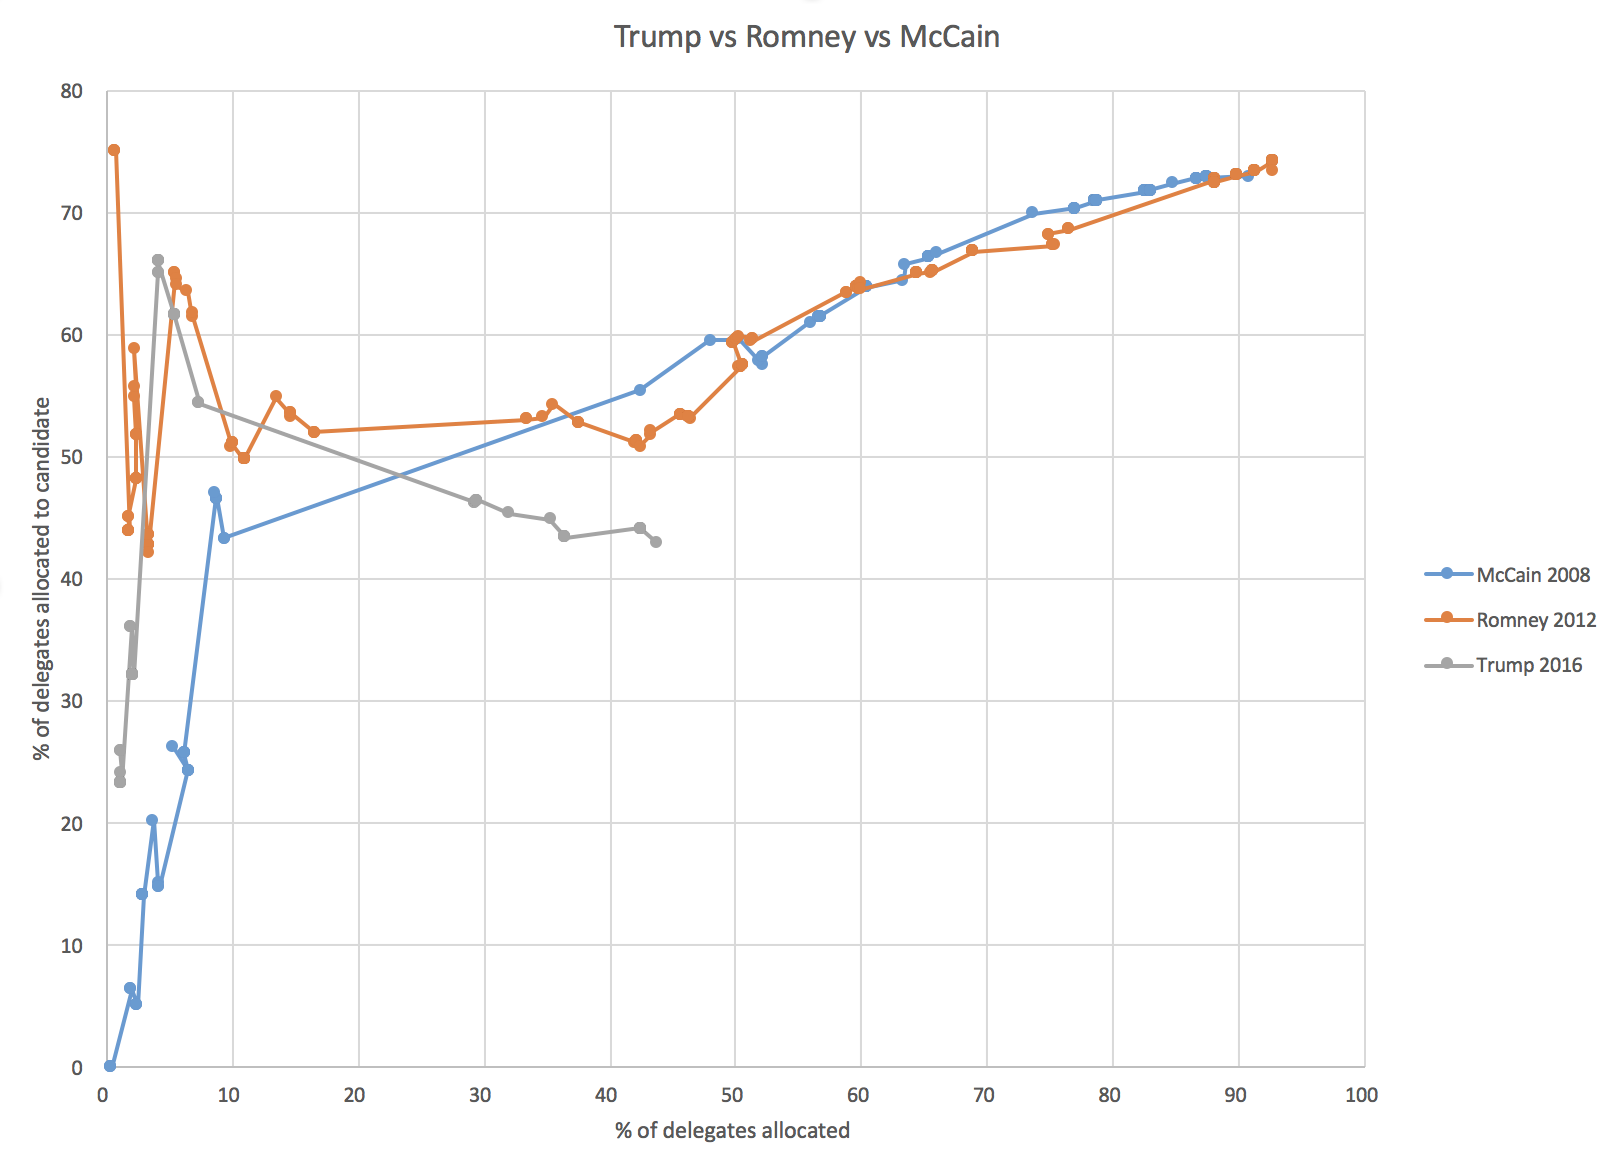
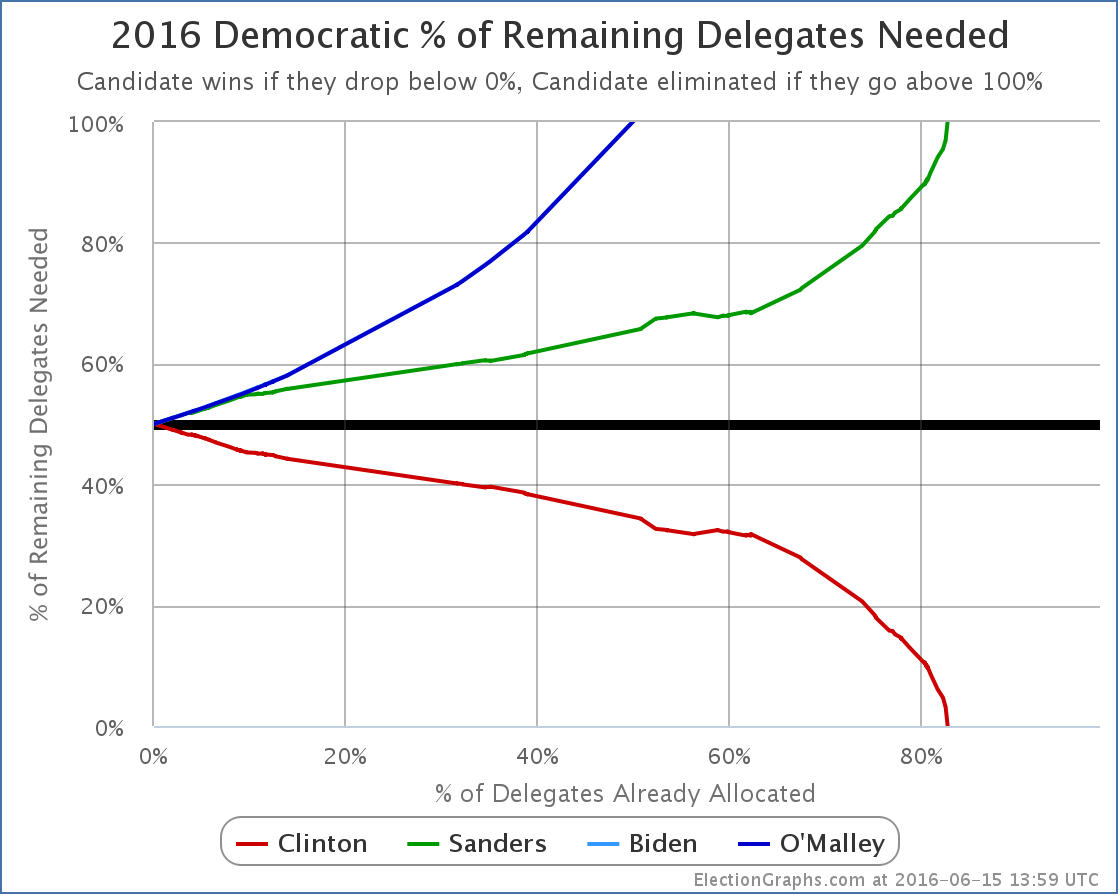
You can see that Trump is behind where either McCain or Romney were at about the same point in the race. But as I’ve said many times, percentages of delegates so far is the wrong way to look at things. Instead, you want to look at the % of the remaining delegates that are needed:

Screen Shot 2016-03-13 at 21.49.32027

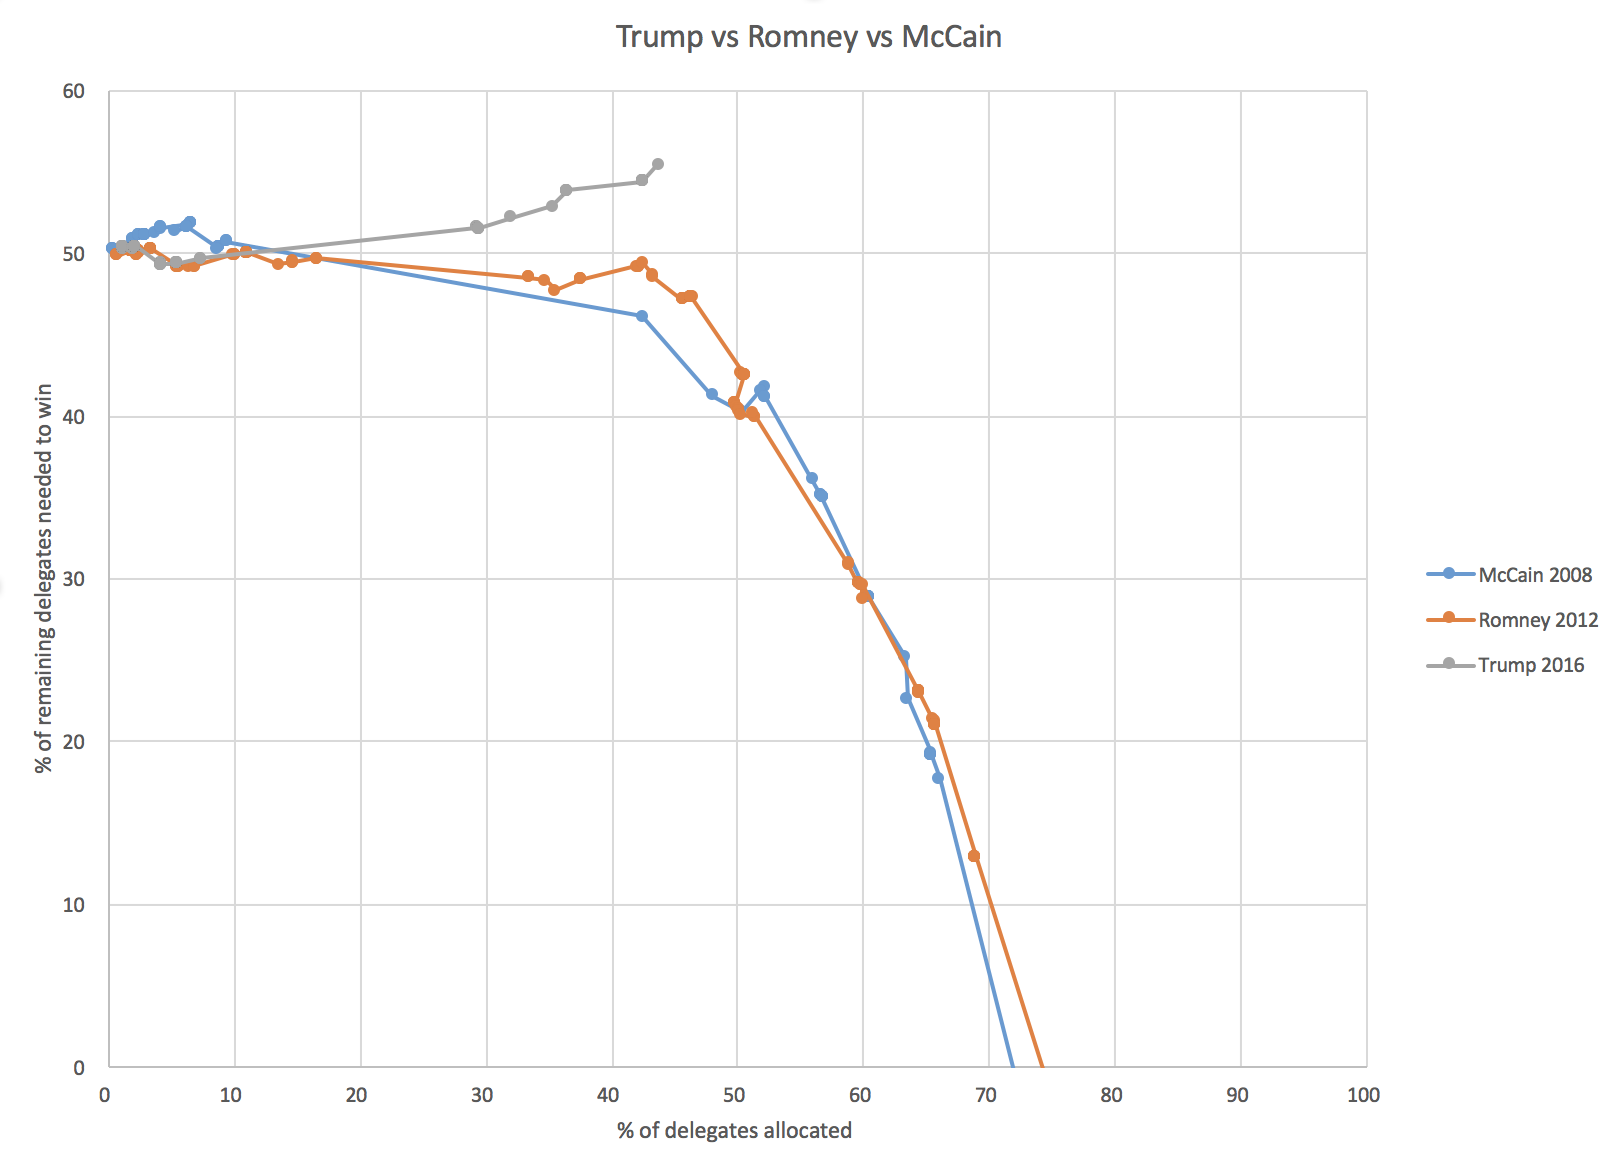
You can see that at this point in the race, both Romney and McCain needed less than 50% of the remaining delegates to win. Trump is way behind that pace. But it was also not until right around now in the races that McCain and Romney really started to pull away. Trump has a harder road here, but with a handful of big winner take all states it is not too late for him to start a downward dive to a flat out win.

But if his line doesn’t manage a full on turn downward, eventually it will curve up, and we’ll end up at the contested convention.

Ohio is close. We will have to wait until Tuesday to see how this thing is going…

Note: This post is an update based on the data on ElectionGraphs.com. Election Graphs tracks both a poll based estimate of the Electoral College and a numbers based look at the Delegate Races. All of the charts and graphs seen in this post are from that site. Additional graphs, charts and raw data can be found there. All charts above are clickable to go to the current version of the detail page the chart is from, which may contain more up to date information than the snapshots on this page, which were current as of the time of this post. Follow @ElectionGraphs on Twitter or like Election Graphs on Facebook to see announcements of updates or to join the conversation. For those interested in individual general election poll updates, follow @ElecCollPolls on Twitter for all the polls as they are added.

[Edit 22:17 UTC to add sentence about other candidate’s numbers getting worse, not just Trump’s.]

[Edit 22:32 UTC to add link to the post on the Democrats.]

Curmudgeon’s Corner: Stronger Duct Tape

In the latest Curmudgeon’s Corner Sam and Ivan talk about:

  • Banking Woes
  • NSA Feedback
  • Govt Shutdown and Debt Limit Standoffs
  • Twitter IPO / Samsung Watch
  • DC Car Shooting Incident

Recorded on 7 Oct 2013

Length this week – 1:22:52

1-Click Subscribe in iTunes Download MP3 File
View Podcast in iTunes View Raw XML Feed

Electoral College: 01:15 – Lots of states, All expected

Romney Obama
Romney Best Case 310 228
Current Status 206 332
Obama Best Case 190 348

There were no states called between 00:45 UTC and 01:00 UTC so there was no 01:00 update.

But there were tons of states called between 01:00 and 01:15 though.

  • Obama: CT, DE, DC, IL, MD, MA, ME-All, ME-1, RI
  • Romney: OK, GA

I also corrected the light blue line in the chart, which I’d neglected to decrement when Romney won South Carolina. That line represents the states where Romney was ahead by more than 5%, but less than 10%.

The three scenarios remain the same though, as no close states have been called. In 2008, since McCain’s best case was still to lose, I also tracked a “McCain SuperBest” case on election night, the case where he would have won all the states he was behind by less than 10% in. That was to keep it interesting in a race that wasn’t close. No need for that this time.

This time we wait for the states that are actually close.

2012 Republican Delegate Count: It Is Over (DC, MD, WI and ND Update)

Charts from the Abulsme.com 2012 Republican Delegate Count Graphs page. When a candidate gets down to 0%, they have cinched the nomination. If they get up past 100%, they have been mathematically eliminated. The first chart is by date, the second is by “% of Delegates Already Allocated”. These numbers include estimates of the eventual results of multi-stage caucus processes which will be refined as the later stages occur.

So… this is it. Long ago any realistic possibility for any non-Romney to win the nomination disappeared. With today’s update the already long odds for the non-Romneys to keep Romney from getting to 1144 essentially drop to zero. This is over. Romney wins. Without any sort of brokered convention. For something else to happen now we’d need some event that was so earth shaking that Romney dropped out. This is extremely unlikely.

Details below.

We have updates from four contests. In alphabetical order:

  • DC: DC is winner take all, Romney gets all 16 delegates.
  • Maryland: Maryland is not actually winner take all, you get some delegates for winning the state, and then more delegates go to the winner of each congressional district. But Romney not only won the state, but every congressional district. So Romney gets all 37 delegates.
  • North Dakota: North Dakota had the first round of its process in March. At that time the delegate estimate was Santorum 11, Paul 8 , Romney 7 , Gingrich 2. But the state Republican Convention happened last weekend, and Romney supporters owned the parliamentary process, taking the lion’s share of the delegates despite coming in third in March. That’s how it works in caucus states sometimes. It took a couple days for Green Papers to confirm a new estimate, but it now looks like Romney 20, Santorum 6, Paul 2. So the net today is Romney +13, Gingrich -2, Santorum -5, Paul -6.
  • Wisconsin: Wisconsin also allocates some delegates based on both state and CD winners. Romney won the state. Romney won 5 CDs. Santorum won 3 CDs. So overall we have a delegate count of Romney 33, Santorum 9

Add those up and we have a net total for today of Romney +99, Santorum +4, Gingrich -2, Paul -6 Obviously Romney completely dominated the day.

In terms of “% of remaining delegates needed to win” we have this:

  • Romney: 47.3% -> 42.5%
  • Santorum: 71.8% -> 77.5%
  • Gingrich: 80.5% -> 87.5%
  • Paul: 86.8% -> 94.6%

The also-rans who left the race early on… Bachman, Huntsman and Perry… are mathematically eliminated after today. Paul, Gingrich and Santorum will inevitably join them soon.

The blocking Romney option? At this point the non-Romneys collectively would need to get 57.5% of the remaining delegates. So far they have managed 42.6% of the delegates. A change of this sort, while not mathematically impossible, would be unprecedented, especially since we are in the phase of the campaign where it is clear Romney is winning and the others are losing. People just stop voting for losers. As things go on, the % of delegates the non-Romneys get will probably actually decline. A major increase is just not going to happen.

It is over.

(We will of course continue to update these charts until Romney actually gets to 1144 however.)

Stupid Self-Correction on MD and WI

Sometime a few weeks ago I looked at the upcoming states and misread something and got it stuck in my head that DC, MD and WI were all winner take all states. I then repeated that a number of times on this blog and in my podcast.

BUZZZ!!

DC is indeed winner take all, but MD and WI are only “Winner take all by State and Congressional District”. So some delegates are chosen winner take all by the state results, and then additional delegates are allocated for the winners of each congressional district. So not really WTA.

Oops. Sorry about that. In any case, when I post delegate updates they will of course reflect the actual delegate distributions, not my imaginary winner take all results. This does mean that today will probably not be quite as much of a knockout punch for Romney as I expected, but it is looking to still be a pretty decisive victory, certainly more than he needs to be on pace for 1144.