This is the website of Abulsme Noibatno Itramne (also known as Sam Minter). Posts here are rare these days. For current stuff, follow me on Mastodon

Categories

Calendar

April 2024
S M T W T F S
 123456
78910111213
14151617181920
21222324252627
282930  

Democrats: Clinton Clinches the Democratic Nomination

By the Election Graphs count, Clinton now has 2745 delegates, which puts her well over the 2383 require to clinch the nomination.

As they did with the Republicans, AP went out and called many still publicly uncommitted superdelegates and was able to get the winning candidate to the magic number in their count a little earlier than those of us only using public commitments. In this case AP made their announcement Monday. The count here went over the magic number within minutes of the polls closing in New Jersey Tuesday night.

As of the writing of this post, all but 4 straggling delegates from New Jersey out of the 694 delegates up for grabs last night seem to be reasonably determined, so lets run down then numbers.

After Puerto Rico, Clinton only needed 5.05% of the remaining delegates to win. Sanders needed 95.19% of the remaining delegates. Clinton needed 43 delegates, Sanders needed 811.

In CA/NJ/NM/MT/SD/ND Clinton got 391 delegates while Sanders got 299. (As mentioned, there are still 4 TBD from NJ as of this writing.)

In the days between Puerto Rico and the June 7th results coming in, superdelegate changes yielded a net change of: Clinton +14, Sanders +1, O’Malley -1. Yes, that lone O’Malley superdelegate finally flipped… to Clinton.

Total change since Puerto Rico: Clinton +405, Sanders +300, O’Malley -1

That is Clinton 57.53%, Sanders 42.61%. (Adds to more than 100% because Clinton took the one delegate from O’Malley.)

So Clinton met her target, Sanders did not.

405 delegates is significantly more than the 43 delegates Clinton needed to go over the top.

She clinches. She is the presumptive nominee.

Lets check out the updated graphs:

chart-162

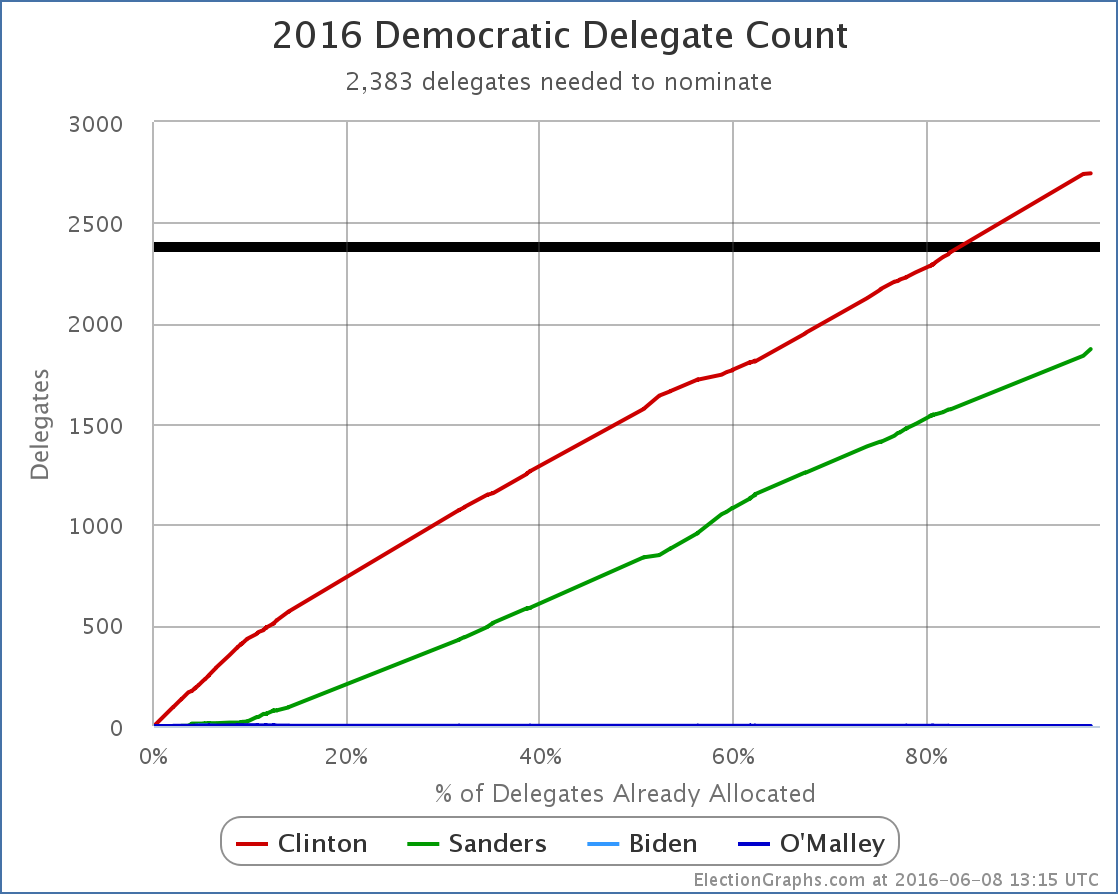
New delegate totals: Clinton 2745, Sanders 1872. Clinton blows past 2383 and is now well beyond where she needed to get.

There are 148 delegates left. Washington DC has 20 up for grabs next week. There are those 4 from New Jersey too. The other 124 are superdelegates who have not yet stated a preference. Clinton needs none of these delegates. Sanders could get every single one of these delegates, and would still lose decisively.

chart-163

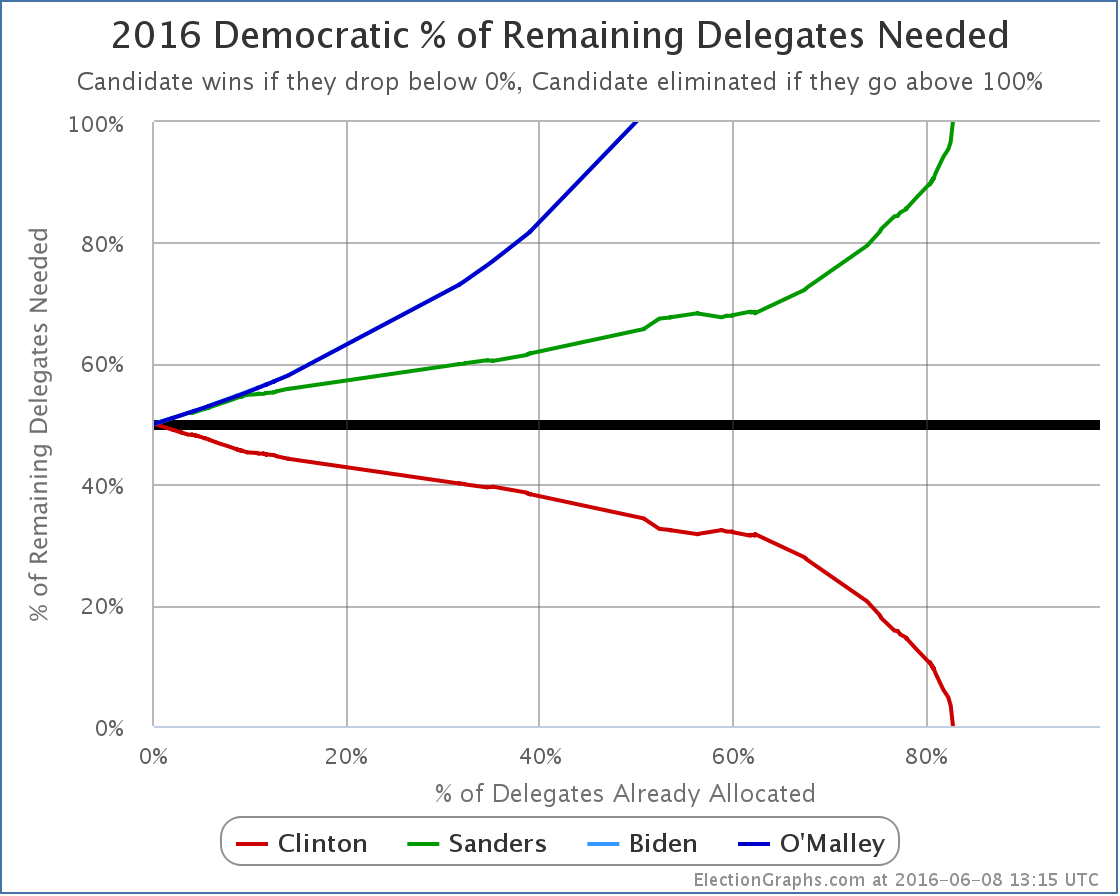
The “% of delegates needed to win” chart is complete. Clinton dropped below 0%, Sanders went above 100%.

One more graph:

chart-164

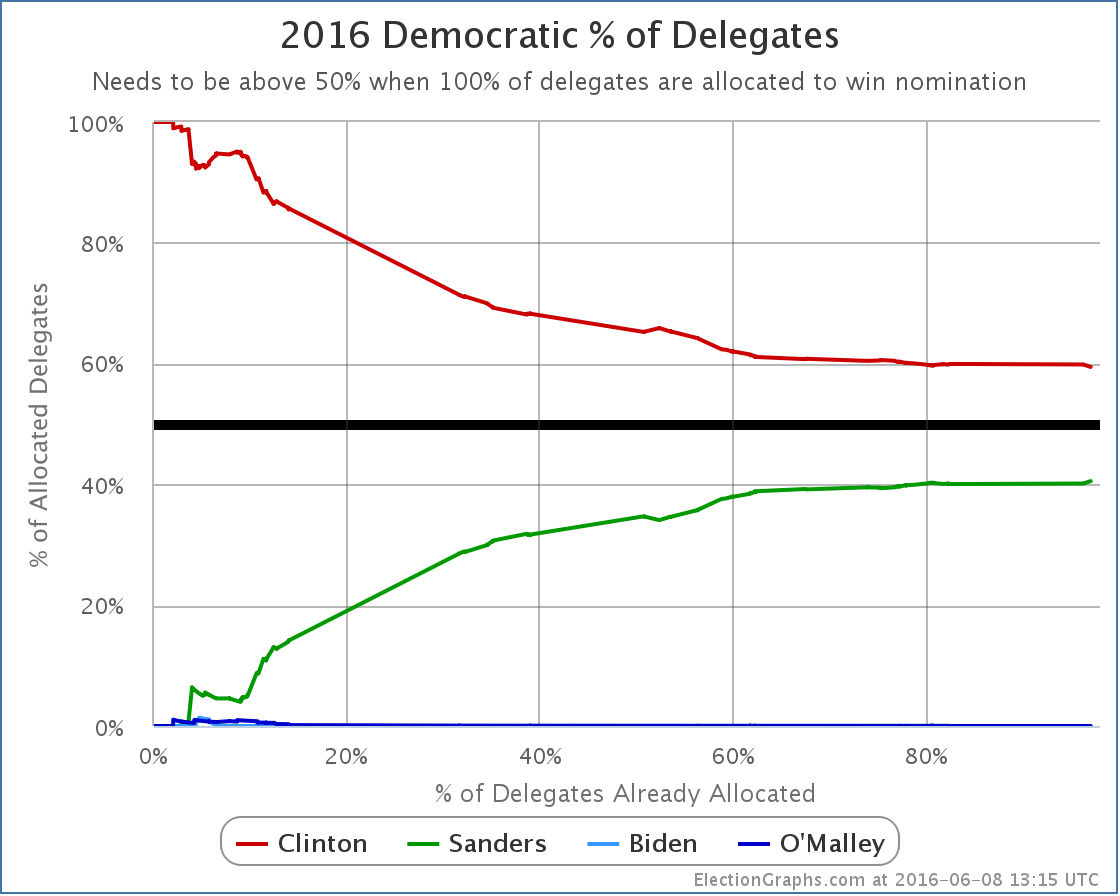
Since she started at 100% of the delegates by getting superdelegates before the first primaries or caucuses even happened, Clinton’s “% of delegates” number of course trended downward through most of the cycle. But for quite some time now the delegate race has stuck pretty close to being a 60% to 40% split in Clinton’s favor. As of now, it sits at Clinton 59.45%, Sanders 40.55%.

OK, now to step back a little…

Clinton dominated this race from the beginning. There were only a handful of moments where Sanders even managed to close the gap a little bit. Sanders was never even close. It was clear since the beginning of March… at the latest… that is being generous… it was fairly clear even before that… that Sanders catching up would take a miracle. The one thing that has been amazing throughout the primary process is the ability of many Sanders supporters to be in complete denial about this in the face of overwhelming evidence. It is one thing to be enthusiastic about your candidate and even to hope for that miracle, but it is another thing to not even recognize that you are losing and that it would indeed take that miracle to win.

And yes, some of those Sanders folks are still in denial even now. Because superdelegates. So a quick look. Right now we have Clinton 2745, Sanders 1872. There are 124 remaining superdelegates. Lets give them all to Sanders. For fun give Sanders all 20 DC delegates and the 4 from New Jersey too. Now we have Clinton 2745, Sanders 2020. All delegates are now allocated. Sanders is still short. To get to 2382 he would need at least 182 delegates who have committed to Clinton to change their minds and vote for Sanders instead. Clinton has 532 superdelegates by the latest count. So that means 34.2% of the superdelegates currently committed to Clinton would have to flip.

They would have to do that flip in the face of Clinton having won the popular vote (even if you include estimated popular vote for caucus states), Clinton having won the pledged delegate count, and Clinton having won the most states. Not to mention significant numbers of the superdelegates not simply being lukewarm Clinton supporters, but being people who she has actively cultivated for many years, a good number of which have actually been active in her campaign.

Is it mathematically possible? Yes. Of course it is. Is it going to happen absent something catastrophic happening to Clinton? No.

Some Sanders folks are still holding out the “What if Clinton is indicted?” scenario. My guess is most superdelegates would consider it an unfair and unjust indictment and stick by their candidate. It probably wouldn’t be enough. Perhaps I suppose. It is a stretch though. More realistically it would take a debilitating health issue or some brand new scandal so serious it dwarfs everything that has come up so far. Can you imagine these sorts of things? Of course. But they are all unforeseen unpredictable types of event, not things you decide to continue a campaign based on. After all, there are ways Martin O’Malley can still win the nomination too!

You can conjure similar scenarios on the other side too of course, but absent that kind of craziness, we now have our nominees in both parties.

So we have Clinton vs Trump. Time to start focusing on the general election analysis!

153.4 days until polls start to close on election day!

Update 2016-06-12 17:16 UTC – Superdelegate update. Net Change: Clinton +11

Update 2016-06-12 17:43 UTC – Missed one change in the superdelegate update above. Additional Change: Clinton -1. (So Clinton +10 for this day’s scan.)

Update 2016-06-12 18:02 UTC – Updates from California, New Jersey, and South Dakota (including the remaining 4 TBD delegates from New Jersey). Net change: Sanders +4.

Update 2016-06-15 01:40 UTC – Superdelegate update. Net Change: Clinton -3, Sanders +1.

Note: This post is an update based on the data on ElectionGraphs.com. Election Graphs tracks both a poll based estimate of the Electoral College and a numbers based look at the Delegate Races. All of the charts and graphs seen in this post are from that site. Additional graphs, charts and raw data can be found there. Follow @ElectionGraphs on Twitter or like Election Graphs on Facebook to see announcements of updates or to join the conversation. For those interested in individual general election poll updates, follow @ElecCollPolls on Twitter for all the polls as they are added. If you find the information in these posts interesting or useful, please consider visiting the tip jar.

Edit 15:19 UTC to mention the 4 delegates from New Jersey in the list of remaining delegates and the calculations for superdelegates flipping.

Electoral College: 02:15 – First Close State Called! Michigan Goes Blue

Romney Obama
Romney Best Case 294 244
Current Status 206 332
Obama Best Case 190 348

No states were called between 01:45 UTC and 02:00 UTC, but a ton were called between 02:00 UTC and 02:15 UTC:

  • Romney: KS, LA, NE-All, NE-1, ND, SD, TX, WY, MS
  • Obama: MI, NY, NJ

All of these were no brainer expected states, except for Michigan. Michigan is the first state of the night to be called where the margin was less than 5% in the polls, so winning this state made a difference between the “best cases” that I present. Obama was ahead here by 4.5%, so a win here was predicted, but it was a close state and one that Romney really needed.

As of the final update I made on election day, Michigan was the tipping point state. That means Romney had to win all the states he was doing better in than Michigan PLUS Michigan in order to win. He just lost Michigan, which means he now needs a state he was further behind in that Michigan in order to win.

This is very bad news to Romney. His path to victory is now not quite impossible, but very close. Let’s look:

With all the states he has already won, plus the uncalled states where Romney was ahead by more than 5%, he had 190 electoral votes. Then the areas he was ahead in:

  • Nebraska 2nd (1): 3.8% Romney lead
  • North Carolina (15): 1.4% Romney lead

That gets Romney to 206. He needs 63 more electoral votes. Looking at the remaining states that haven’t yet been called:

  • Iowa (6): 2.0% Obama lead
  • Florida (29): 2.3% Obama lead
  • Colorado (9): 2.4% Obama lead
  • New Hampshire (4): 2.8% Obama lead
  • Maine 2nd (1): 2.8% Obama lead
  • Virginia (13): 3.6% Obama lead
  • Pennsylvania (20): 4.8% Obama lead
  • Nevada (6): 4.8% Obama lead

If Romney wins all of those through Pennsylvania, it gets him to 288 electoral votes, which wins him the Presidency. If he doesn’t win Pennsylvania to win, he needs every other one of those states, including Nevada, which would get him to 274. If he does win Pennsylvania, then he could afford to lose Virginia, New Hampshire and Maine’s 2nd (and Nevada).

But that is a very tall order! And there will be another update coming soon…

2012 Republican Delegate Count: It Is Over (DC, MD, WI and ND Update)

Charts from the Abulsme.com 2012 Republican Delegate Count Graphs page. When a candidate gets down to 0%, they have cinched the nomination. If they get up past 100%, they have been mathematically eliminated. The first chart is by date, the second is by “% of Delegates Already Allocated”. These numbers include estimates of the eventual results of multi-stage caucus processes which will be refined as the later stages occur.

So… this is it. Long ago any realistic possibility for any non-Romney to win the nomination disappeared. With today’s update the already long odds for the non-Romneys to keep Romney from getting to 1144 essentially drop to zero. This is over. Romney wins. Without any sort of brokered convention. For something else to happen now we’d need some event that was so earth shaking that Romney dropped out. This is extremely unlikely.

Details below.

We have updates from four contests. In alphabetical order:

  • DC: DC is winner take all, Romney gets all 16 delegates.
  • Maryland: Maryland is not actually winner take all, you get some delegates for winning the state, and then more delegates go to the winner of each congressional district. But Romney not only won the state, but every congressional district. So Romney gets all 37 delegates.
  • North Dakota: North Dakota had the first round of its process in March. At that time the delegate estimate was Santorum 11, Paul 8 , Romney 7 , Gingrich 2. But the state Republican Convention happened last weekend, and Romney supporters owned the parliamentary process, taking the lion’s share of the delegates despite coming in third in March. That’s how it works in caucus states sometimes. It took a couple days for Green Papers to confirm a new estimate, but it now looks like Romney 20, Santorum 6, Paul 2. So the net today is Romney +13, Gingrich -2, Santorum -5, Paul -6.
  • Wisconsin: Wisconsin also allocates some delegates based on both state and CD winners. Romney won the state. Romney won 5 CDs. Santorum won 3 CDs. So overall we have a delegate count of Romney 33, Santorum 9

Add those up and we have a net total for today of Romney +99, Santorum +4, Gingrich -2, Paul -6 Obviously Romney completely dominated the day.

In terms of “% of remaining delegates needed to win” we have this:

  • Romney: 47.3% -> 42.5%
  • Santorum: 71.8% -> 77.5%
  • Gingrich: 80.5% -> 87.5%
  • Paul: 86.8% -> 94.6%

The also-rans who left the race early on… Bachman, Huntsman and Perry… are mathematically eliminated after today. Paul, Gingrich and Santorum will inevitably join them soon.

The blocking Romney option? At this point the non-Romneys collectively would need to get 57.5% of the remaining delegates. So far they have managed 42.6% of the delegates. A change of this sort, while not mathematically impossible, would be unprecedented, especially since we are in the phase of the campaign where it is clear Romney is winning and the others are losing. People just stop voting for losers. As things go on, the % of delegates the non-Romneys get will probably actually decline. A major increase is just not going to happen.

It is over.

(We will of course continue to update these charts until Romney actually gets to 1144 however.)

2012 Republican Delegate Count: First Round of Super Tuesday Results

Chart from the Abulsme.com 2012 Republican Delegate Count Graphs page. When a candidate gets down to 0%, they have cinched the nomination. If they get up past 100%, they have been mathematically eliminated. Rather than the date on the x-axis, we show the “% of Delegates Already Allocated” as this better represents the progress through the race. Note that these numbers include estimates of the eventual results of multi-stage caucus processes which will be refined as the later stages occur.

So, Super Tuesday happened. As of this update, Green Papers has “called” 385 of the 419 delegates available from the Super Tuesday contests. There are 34 delegates that haven’t been determined yet that will result in updates later, but of the ones we do know, the estimates for Super Tuesday contests are: Romney 208, Santorum 84, Gingrich 72, Paul 21. Romney also picked up a Superdelegate, bringing the total for the day to Romney 209, Santorum 84, Gingrich 72, Paul 21.

Compared to the Sabato Crystal Ball projections which we used to game out Super Tuesday over the weekend, Romney performed better than expectations, as did Gingrich. Santorum and Paul underperformed compared to those predictions. In any case, where does this put us…

Bottom line, Romney is the big winner today, and this may be the start of him actually pulling away and heading toward the nomination, but he is still not out of the woods in terms of the danger of being blocked from 1144. Lets look at the details.

The situation for Santorum, Gingrich and Paul is essentially what I mapped out in the gaming Super Tuesday post. To paraphrase what I said there, it is now absolutely undeniably clear (although the trend was obvious even before today) that none of these three guys are on a path to the nomination. Of the three, Santorum is doing the best, but with today’s numbers, to be on a path to win, he would need to now get 64.5% of the remaining delegates, compared to the 21.1% he has gotten so far. For this to even come into the realm of possibility, Gingrich and Paul would both have to stop getting delegates, Santorum would have to pick up all of their support, AND something would need to happen to cause support for Romney to plummet. This is a very unlikely sequence of events. It isn’t going to happen.

Oh, I guess I should also note that Gingrich pulled back ahead of Paul for 3rd place.

The remaining question is: “Are the non-Romney’s collectively still in a position to potentially block Romney from getting to 1144?” If after today, Romney was under 50% of the total delegates, and his “% of remaining needed to win” was heading upward or flat, this is a possibility that would be looking like it was still very much in play. But Romney exceeded the 49.7% of delegates he needed in order to be on track toward 1144, and did it by a decent margin. Of the delegates in today’s total, he picked up 209 of 386, or 54.1%. This reduced his “% of remaining needed to win” from 49.7% to 48.5%. That means to block, the non-Romney’s collectively need to be getting 51.5% of the delegates, compared to the 46.9% they have managed so far. So they have to do better than they have been so far, and by a non-trivial margin. And they have do do this even though it is obvious none of them can win outright. It has to be about stopping Romney.

Now, the rest of March has a bunch of states that are supposed to be relatively good for the non-Romneys. So the non-Romney’s managing to get 51.5% in the next few state is very much within the realm of possibility. After that we hit more Romney friendly states in April. The thing to watch for in the upcoming states is not who wins the popular vote, or even the delegate count. The question will be: “Is Romney continuing to get enough delegates to avoid being blocked?” Right now, that magic number is 48.2%. As long as he is getting 48.2% of the delegates (or more) then he is marching his way toward the nomination. If he gets less than that, then blocking will remain possible a little bit longer. If the rest of March really is friendly to the non-Romneys, we may see that Romney’s “% needed to win” starts heading back up a bit before Romney hits friendly states again and starts fully pulling away. As long as we see that happening, blocking Romney is still a possibility. And indeed, if Romney is damaged by the contests in March and his April states start looking not so good after all, then blocking starts looking more real again.

But Romney’s “% of remaining needed to win” is the smallest it has been so far, and none of the other candidates have realistic shots at winning, only a shot at blocking that relies on them continuing to win delegates even though it is obvious they can’t win, so Romney is in a pretty good position right now. Watch that line though. Until it starts heading downward decisively, Romney hasn’t got it wrapped up just yet.

So what is next? Well, first, the last 34 delegates from Super Tuesday (they are from Georgia, Ohio and Tennessee). Then on Sunday we have Kansas (40), Guam (9), Northern Marianas (9), Virgin Islands (9). Then Tuesday we have Alabama (50), Mississippi (40), Hawaii (20), American Samoa (9). And then it goes on and on…