This is the website of Abulsme Noibatno Itramne (also known as Sam Minter).
Posts here are rare these days. For current stuff, follow me on Mastodon
|
I added some recent results from PPP in Pennsylvania today. PPP polled 13 candidate combinations. Of these only one resulted in a change worth noting in one of our top five best polled candidate combinations. (I consider it a change worth noting if the expected electoral result changes, or the “best case” of one of the two candidates changes, or the tipping point changes.)
Clinton vs Christie
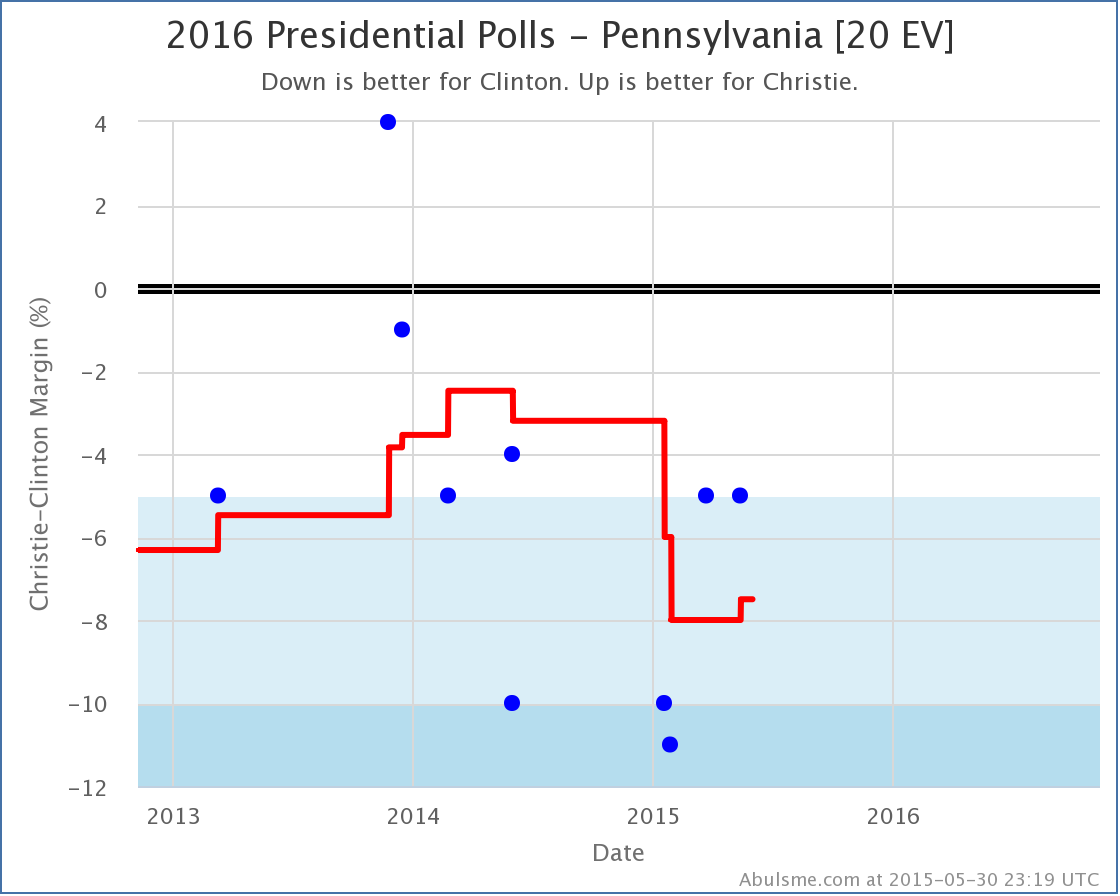
The polling average (which actually contains 6 polls right now rather than the usual five since there is a tie for fifth oldest poll by middate) still shows Clinton with a “Strong” lead, but slightly less of a lead than before. The state doesn’t change categories though, it isn’t close to a “Weak Clinton” state. But it turns out that in Clinton vs Christie, Pennsylvania was the tipping point state, so the topping point changes.
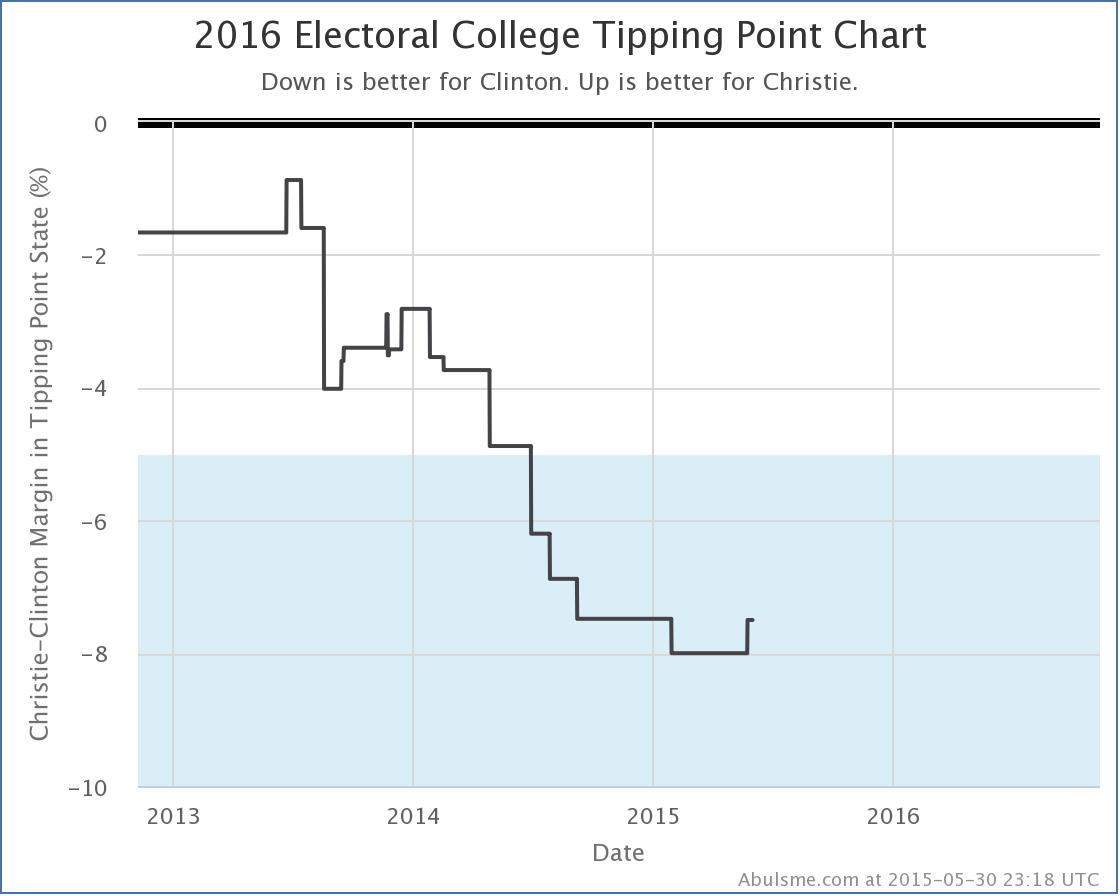
For those who don’t remember, the tipping point is determined by sorting the states by the support level of the candidates, and then seeing which state is the one that would put the winning candidate over the edge. By then looking at the margin in that state, you see how far ahead polls would have to swing on a national basis to change the outcome of the election. In other words, this is a bit like looking at national popular vote numbers, but taking into account the structure of the electoral college. More than most of the other numbers I look at, this represents how far ahead (or behind) a candidate is.
In this case, the tipping point was Pennsylvania, where Clinton was ahead by 8.0%. With the new poll added, the tipping point is still Pennsylvania, but Clinton’s lead is down to 7.5%.
This is the first improvement for Christie in ANY of the metrics I track for Clinton vs Christie since February of last year. Is this the sign of a resurgence for Christie? I kind of doubt it. That ship may have sailed. But it may represent him getting to the point where he won’t get any lower.
The Others
It is worth looking at how some of the other candidates are doing in Pennsylvania though. Here are the Pennsylvania trends for the five best polled candidate combinations at the moment:
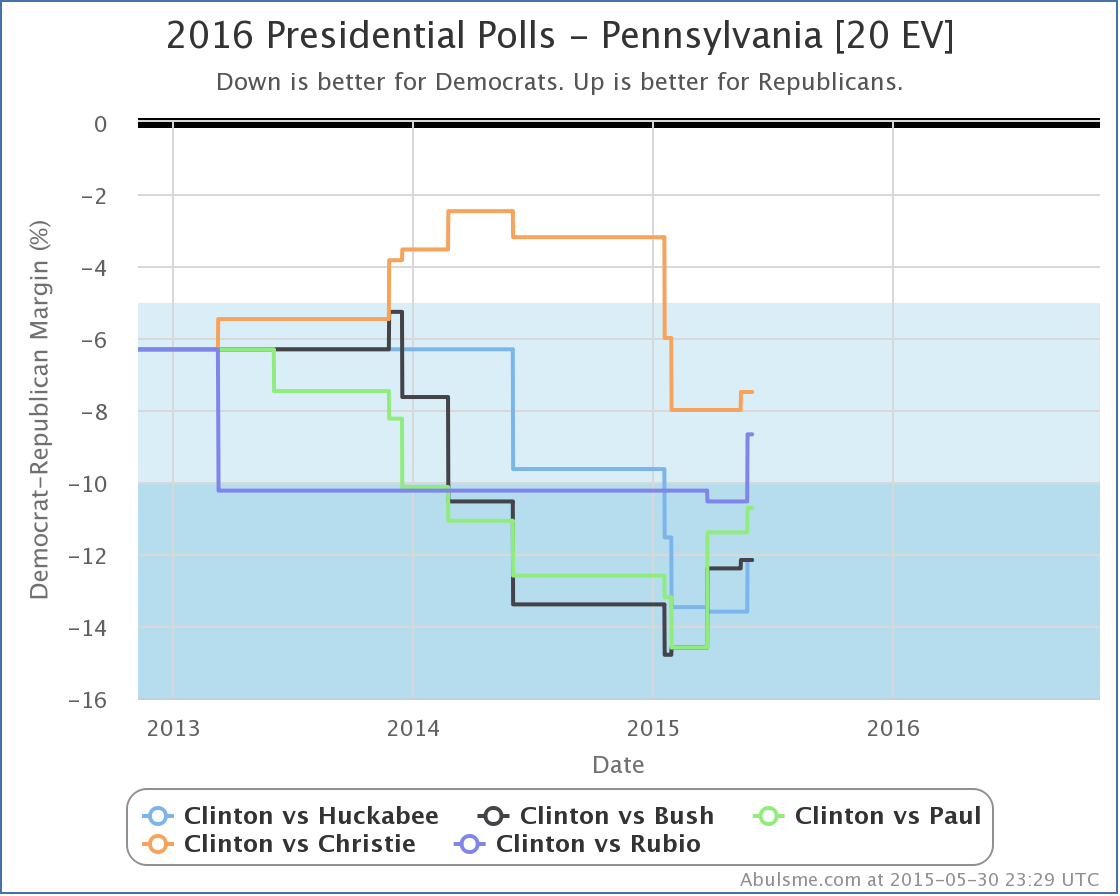
With Christie now enjoying an upward tick of his own, all five Republicans have been improving in Pennsylvania in the last month or so. Bush, Paul and Rubio are all better off than they were at the November elections as well. (Huckabee and Christie are still down from where they were at that point despite the bump in the last month.)
Some of the most recent individual polls in Pennsylvania actually have the state close for some of these candidates against Clinton, but the average isn’t there yet. It is showing movement though. So it is certainly possible we will see further polls confirm Pennsylvania getting closer. Pennsylvania is a big state (20 electoral votes). If Pennsylvania is in play, it opens up a lot more possibilities for the Republicans. So keep an eye on the polls here.
Note: This post is an update based on the data on my 2016 Electoral College Analysis Site. All of the charts and graphs seen here are from that site. Graphs, charts and raw data can be found there for the race nationally and in each state for every candidate combination that has been polled at the state level. In addition, comparisons of the best polled candidate combinations both nationally and each in each state are available. All charts above are clickable to go to the current version of the detail page the chart is from, which may contain more up to date information than the snapshots on this page, which were current as of the time of this post.
Today there were tons of new polls added to my tracking site. The new polling once again put Clinton vs Paul as the “best polled” candidate pair combination, once again swapping places with Clinton vs Bush to be the default displayed on election2016.abulsme.com. But in the end there were only three status changes on the five candidate pairs with the best polling. Today all three of these changes favor Clinton.
Clinton vs Bush
A new Gravis poll in Iowa increases Clinton’s lead once again to over 5%:
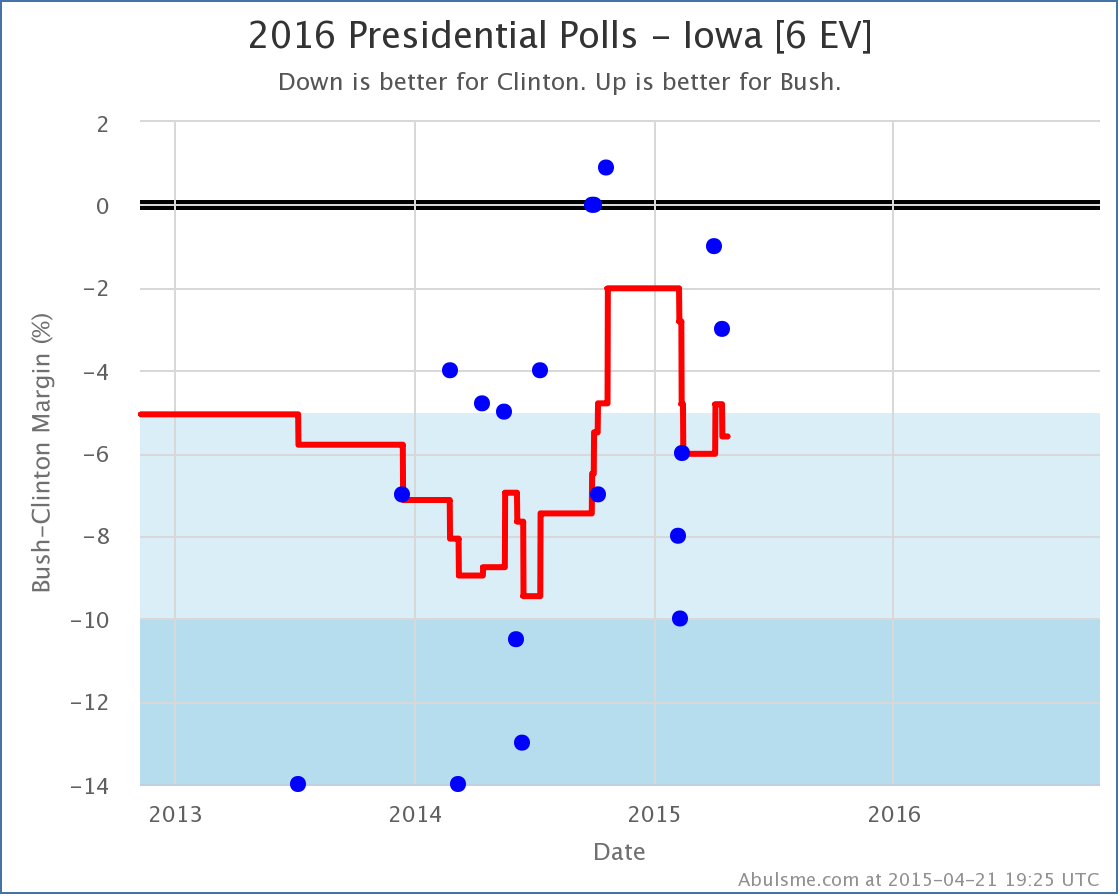
This in turn lowers Bush’s best case from losing to Clinton by 38 electoral votes, to losing by 50 electoral votes:
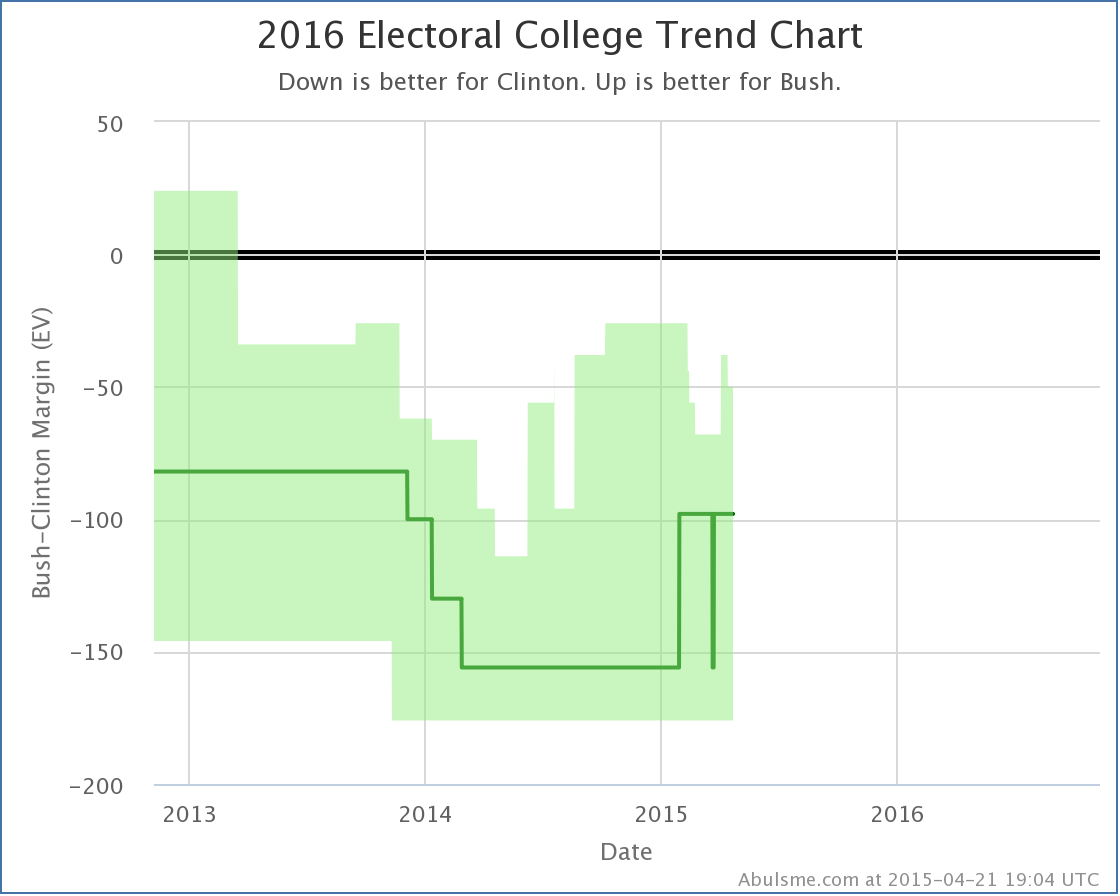
Iowa has been bouncing back and forth over the line between Weak Clinton and Strong Clinton though, so don’t be surprised for this to change again as new polling comes out.
Clinton vs Christie
A new PPP poll in New Hampshire shows Christie trailing Clinton by 15%. Before this poll, the worst Christie had done in New Hampshire against Clinton was being behind by 5%. So this certainly looks like a potential outlier:
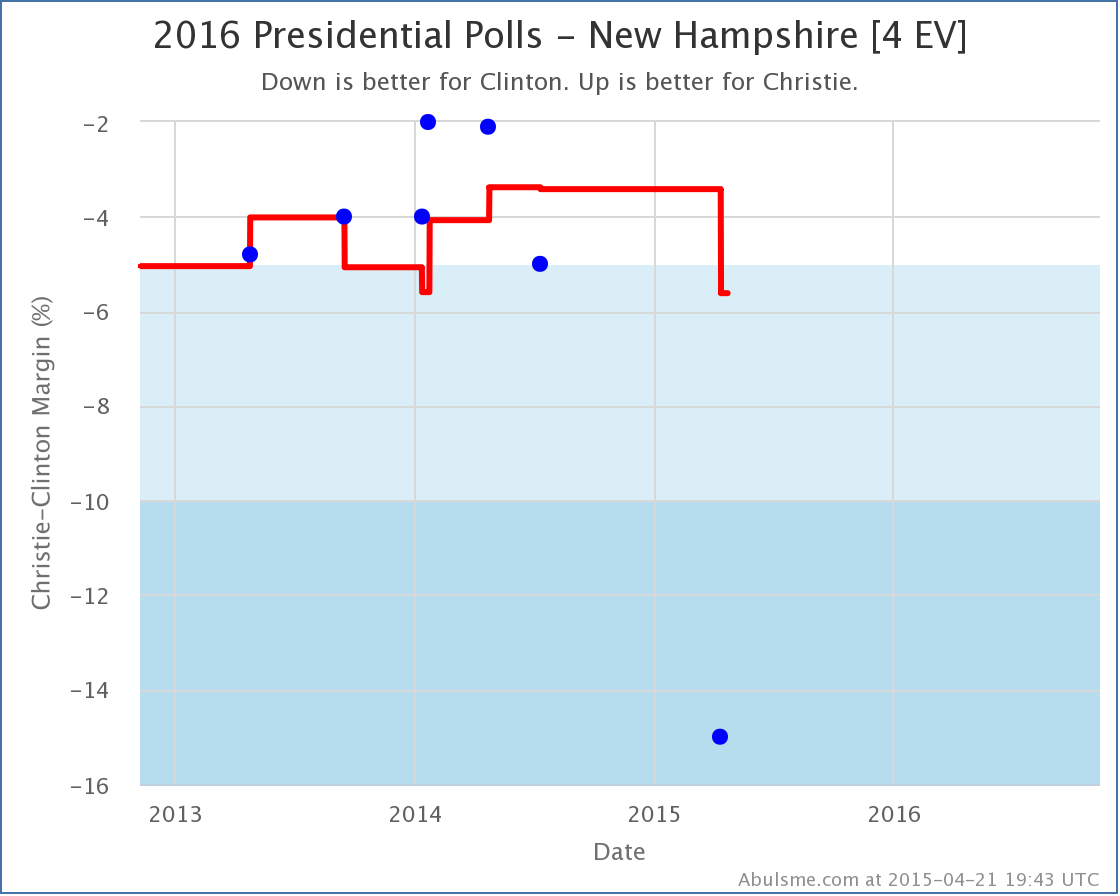
On the flip side, the last polling for Clinton vs Christie in New Hampshire was way back in July, and Christie has been slipping in almost every poll he appears in. So this may also be indicative of a real movement. As usual, the only way to confirm will be with additional polls.
For the moment, with the poll average showing a 5.6% Clinton lead, I remove New Hampshire from the “possible” list for Christie, which moves his best case from losing to Clinton by 100 electoral votes, to losing by 108 electoral votes:
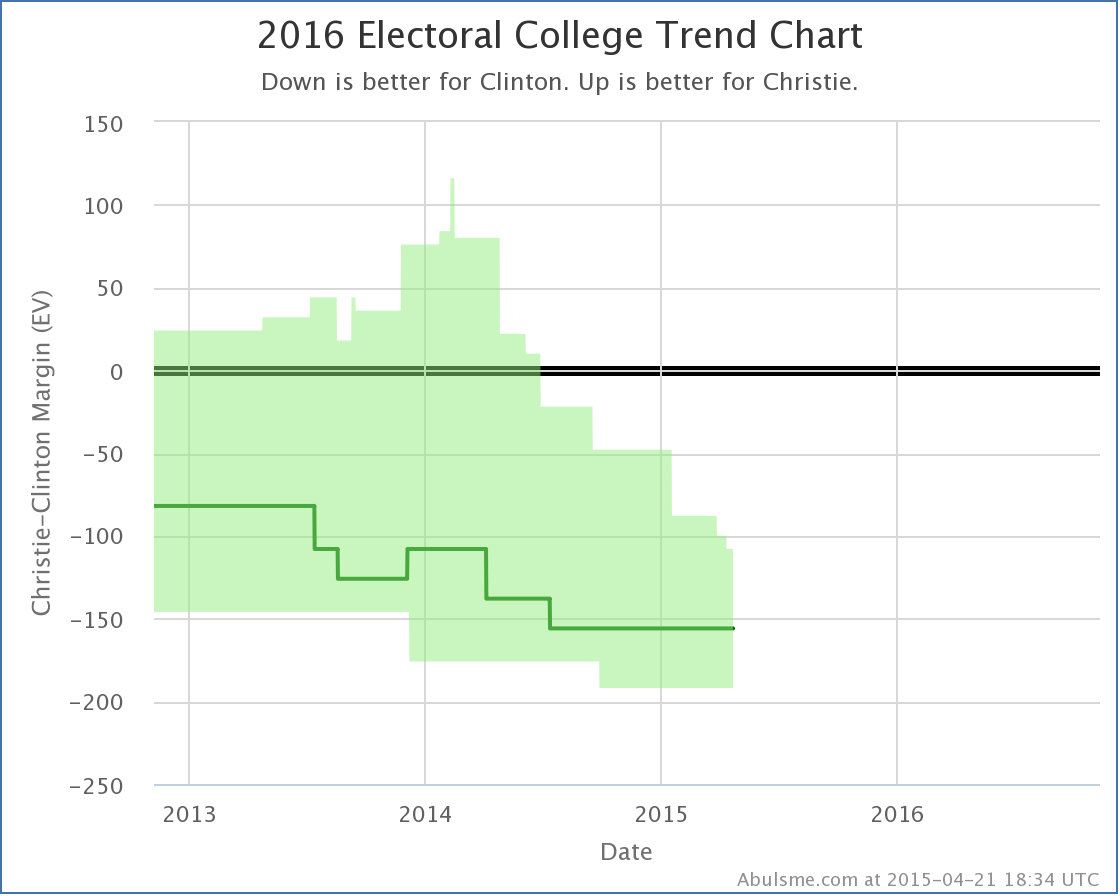
The last time Christie saw any state change categories in his direction vs Clinton was more than a year ago in February 2014. Christie’s general election prospects seem dimmer and dimmer as time goes on. Of course, although I won’t track the nomination races until there are actual delegates to count, if you look at polling for the Republican nomination, you’ll note that the trends look the same there, so Christie may not have to worry that much about his general election prospects.
Clinton vs Huckabee
The same PPP poll in New Hampshire mentioned above is only the second Clinton vs Huckabee poll conducted in New Hampshire, but it is enough to move the average to a greater than 5% Clinton lead:
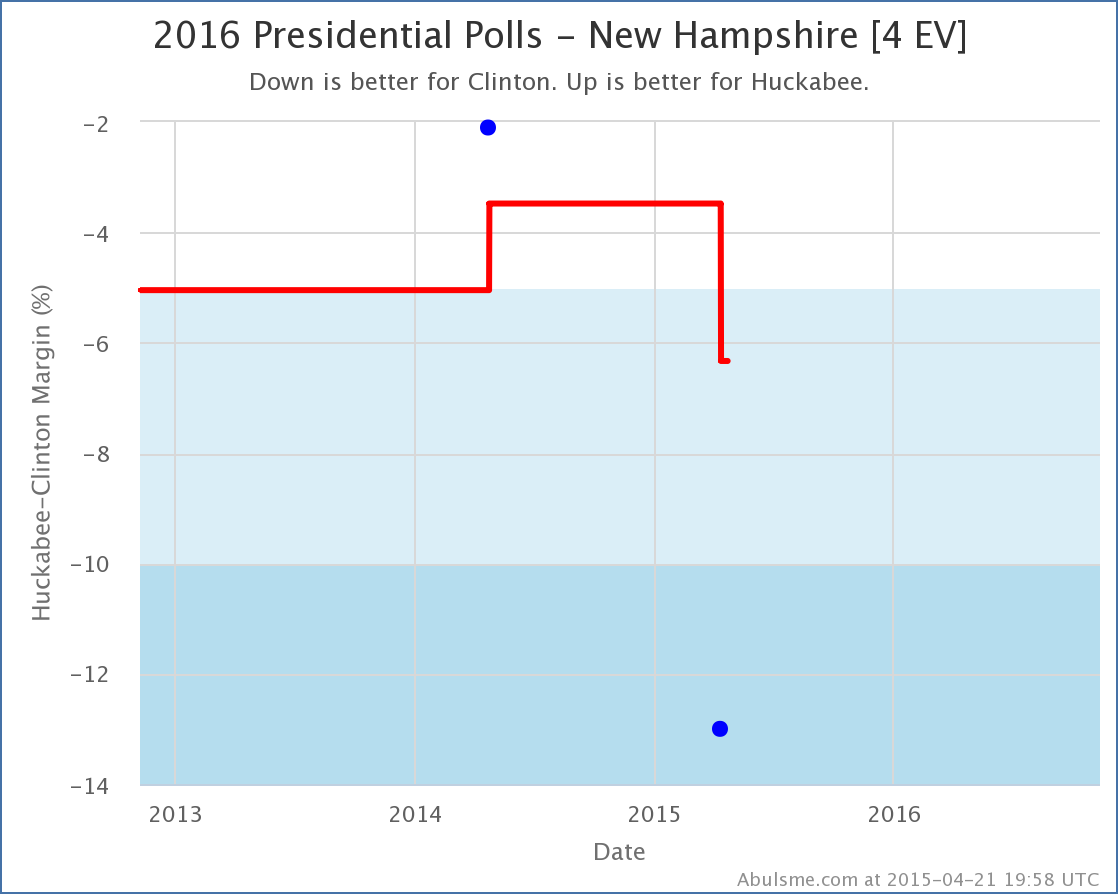
And this moves Huckabee’s best case against Clinton from losing by 76 electoral votes, to losing by 86 electoral votes:
Comparison
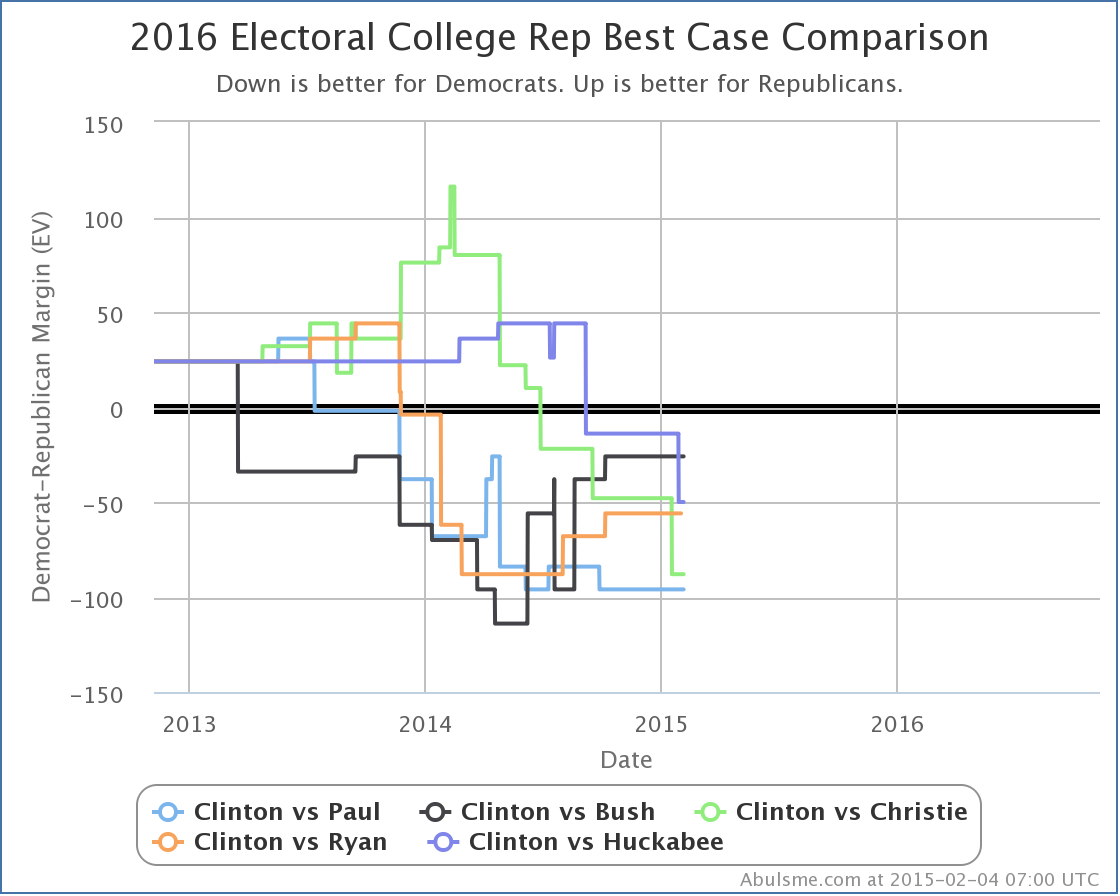
Looking at the “best case” of each of the five “best polled” challengers to Clinton over time:
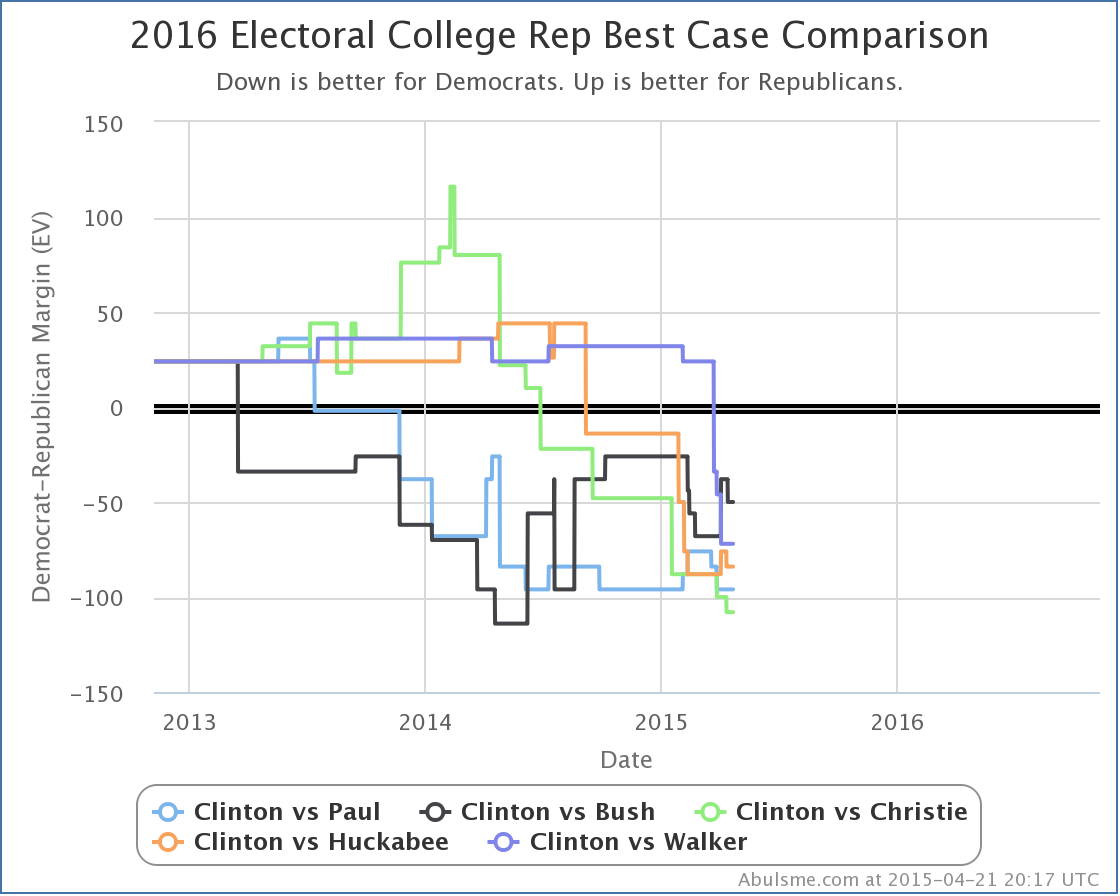
Since the 2014 elections, Paul is flat. Bush, Christie, Huckabee and Walker are all down. Which means that so far, NONE of these candidates have actually been expanding the list of states that are actually in contention. Now, some other metrics have shown some movement toward some of these candidates, but this is a critical one. The Republicans can’t win without first making more currently blue states close.
Clinton vs Ryan, Clinton vs Rubio, and Clinton vs Cruz are the #6, #7 and #8 best polled candidate combinations. They are way behind the five above in polling quality by my metric, but feel free to take a look if any of those candidates are of interest… just interpret the results with caution.
Note: This post is an update based on the data on my 2016 Electoral College Analysis Site. All of the charts and graphs seen here are from that site. Graphs, charts and raw data can be found there for the race nationally and in each state for every candidate combination that has been polled at the state level. In addition, comparisons of the best polled candidate combinations both nationally and each in each state are available. All charts above are clickable to go to the current version of the detail page the chart is from, which may contain more up to date information than the snapshots on this page, which were current as of the time of this post.
In my update today I added polling data from Quinnipiac (7 candidate combinations in Florida, Ohio and Pennsylvania), Gravis (5 candidate combinations in Nevada), and Saint Leo (5 candidate combinations in Florida). This resulted in a variety of status changes, but only a handful that meet my threshold for talking about here, which is that either the electoral college summary or the tipping point needs to change for one of the five best polled candidate pairs.
First off, there has been very little polling in Nevada thus far, but the new polling in Nevada moved both Clinton vs Paul and Clinton vs Christie from “Weak Clinton” to “Strong Clinton” as the polling average moved to a greater than 5% Clinton lead. They join Clinton vs Bush, which was already in that zone. (Clinton vs Huckabee and Ryan, the other two of the top five best polled candidate combinations, have not been polled at all in Nevada.)
So here’s what Paul’s electoral college trends look like at the moment vs Clinton:
And here’s Christie vs Clinton:

In both of these, you can see the slight dip at the top right of the “envelope of possibility” representing Nevada no longer being included in the “best case” for the Republican.
The moves mentioned above for Nevada are the only two cases in today’s updates where the actual electoral college summaries changed. (Well, of the top five best polled candidate combinations anyway.)
But we’ll also mention it here if there are changes to the tipping point margin. As a reminder, the tipping point margin is basically how much you would have to shift the results in ALL states in order to change the electoral college winner. Basically, it is like looking at the national popular vote, but taking into account the structure of the electoral college, so you’re looking at how much things have to move to change the electoral college outcome, not just the winner of the popular vote. (Which as 2000 showed, do not necessarily go together.)
So, those changes…
First off Clinton vs Bush. With today’s added polling and Nevada getting bluer, the tipping point moves from Clinton by 6.2% in Virginia, to Clinton by 6.8% in Minnesota.
Then Clinton vs Huckabee. Ohio moves further toward Clinton, and the topping point shifts from Clinton by 8.0% in Virginia, to Clinton by 8.1% in Ohio.
Finally, the one move in the directions of the Republicans today. Ohio moved in Paul’s direction with todays update… the poll average went from a 9.2% Clinton lead to a 7.6% Clinton lead, which was enough to move the tipping point from Clinton by 8.8% in Virginia to Clinton by 8.5% in Wisconsin.

Lets look a second at the comparison of the tipping point for all five of the best polled candidate pairs:
Since the November elections, we have Bush and Paul up while Christie and Huckabee are down. (No movement on Ryan, but there has been sparse polling on him since he said he was not running… we still have better polling on Ryan than on Cruz, Rubio or Walker though.)
So, there has been some press lately on how Clinton’s email issues have hurt her at the polls. There has also been press saying it hasn’t had any significant effect. National polls would of course register short term changes much much more quickly that the state polling I look at here, where even the best polled states only get polled a little more than once a month. It really is too soon for effects of that particular thing to show strongly in the kind of analysis I do here. Until we get to the last few months before the election, you’ll be able to see long term trends here, but not short term reactions to individual events in the news cycle. For the moment, there aren’t any strong trends here to call out. There has been movement, but not a whole lot, and it depends on which Republican you look at.
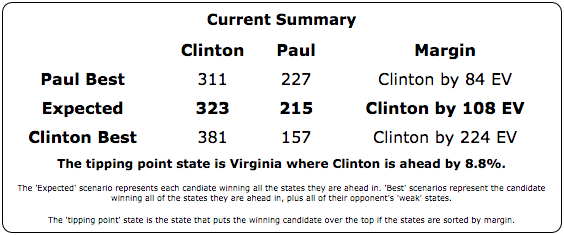
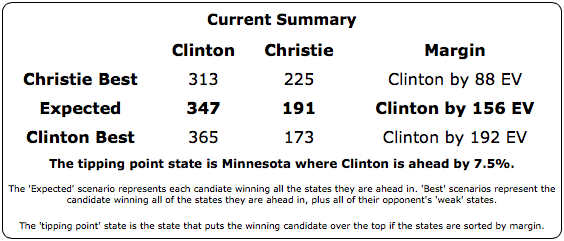
For the top five candidate pairs, the overall situation now looks like this:
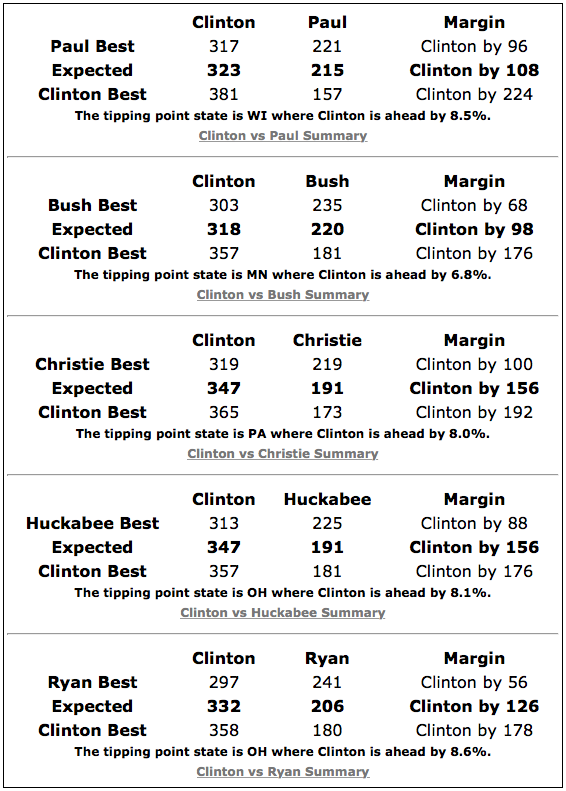
One comparison that I haven’t done in awhile here is looking at these numbers vs 2012. The final result in 2012 was Obama 332 to Romney 206, or Obama by 126.
So while all five Republicans here are currently well behind Clinton in the expected electoral college outcome, both Bush and Paul are doing better against Clinton than Romney did against Obama!!
So while Clinton still has a healthy lead here, we’re nowhere near landslide territory or anything like that. Remember that a 10% tipping point margin (a relatively huge lead) still means the results of the election can be flipped if just 5% of the people change their minds (or don’t turn up to vote, or whatever).
If this was a few days before the election and Clinton had these kinds of numbers, it would be foolish to bet against her winning. But it is 587 days until the election. There is a long long way to go. Polls at this stage are NOT predictive of the results at the end of the process. They are only a snapshot of what things look like TODAY, which gives you an idea how much work the candidate that is behind would have to do to win. (Or alternately, how much the candidate who is ahead can afford to screw up.)
As I mentioned in my last update there is a lot of interest in a few other candidates too. Right now Clinton vs Cruz is the 6th best polled combo, Clinton vs Rubio is at #7, and Clinton vs Walker is at #8. You can click through on those links if you want to see what those look like at the moment. But the amount of state level polling on those guys still isn’t that great (although they are catching up), so take what you see there with a big lump of salt.
Note: This post is an update based on the data on my 2016 Electoral College Analysis Site. All of the charts and graphs seen here are from that site. Graphs, charts and raw data can be found there for the race nationally and in each state for every candidate combination that has been polled at the state level. In addition, comparisons of the best polled candidate combinations both nationally and each in each state are available. All charts above are clickable to go to the current version of the detail page the chart is from, which may contain more up to date information than the snapshots on this page, which were current as of the time of this post.
A bunch of new polls were added to my site today, but there was only one notable change. With a new Gravis Poll, Clinton’s lead in New Hampshire against Paul once again goes over 5%.
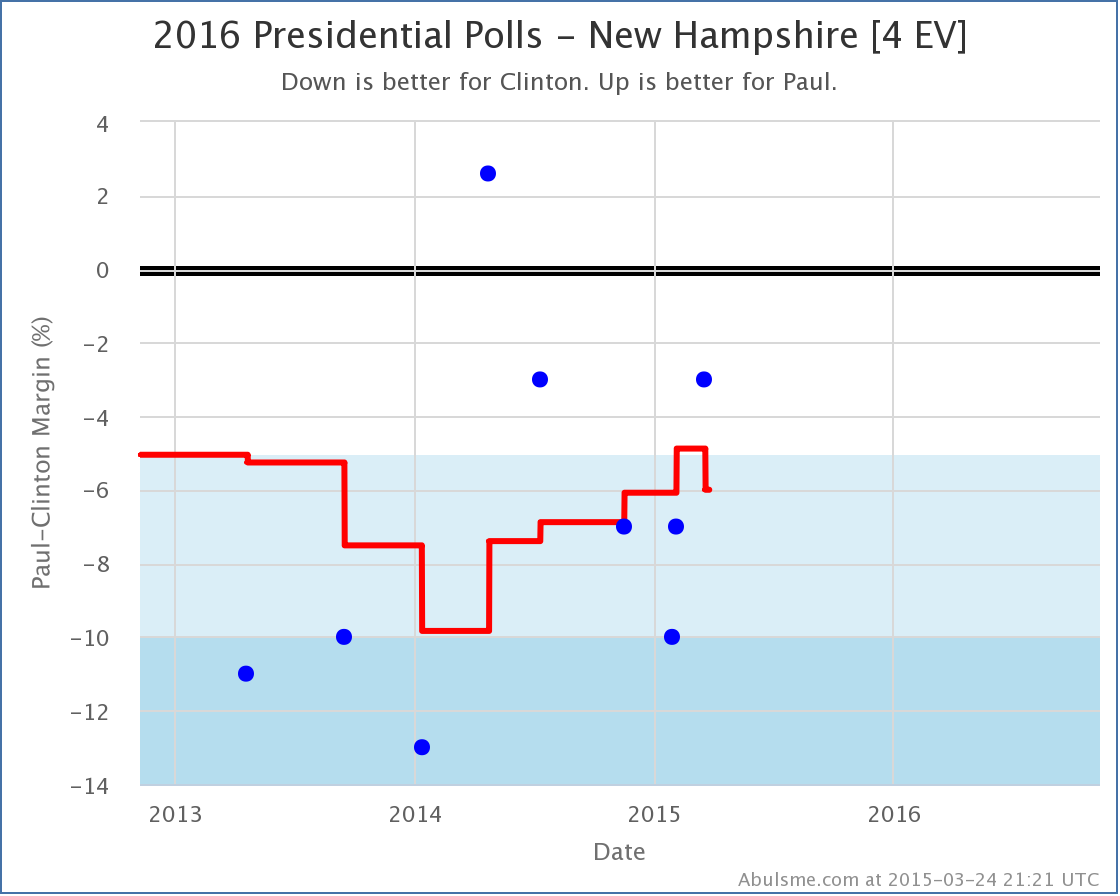
Easy come, easy go I guess. This decline happens as the only poll so far showing Paul in the lead here falls off the average. That poll is looking more like an outlier at this point. Even without that one poll though, if you squint there does seem to be a general trend in Paul’s direction over the last year or so. As usual, we’ll have to wait for more polls to see if Paul resumes closing the gap in the average, or if this is actually a reversal of the trend.
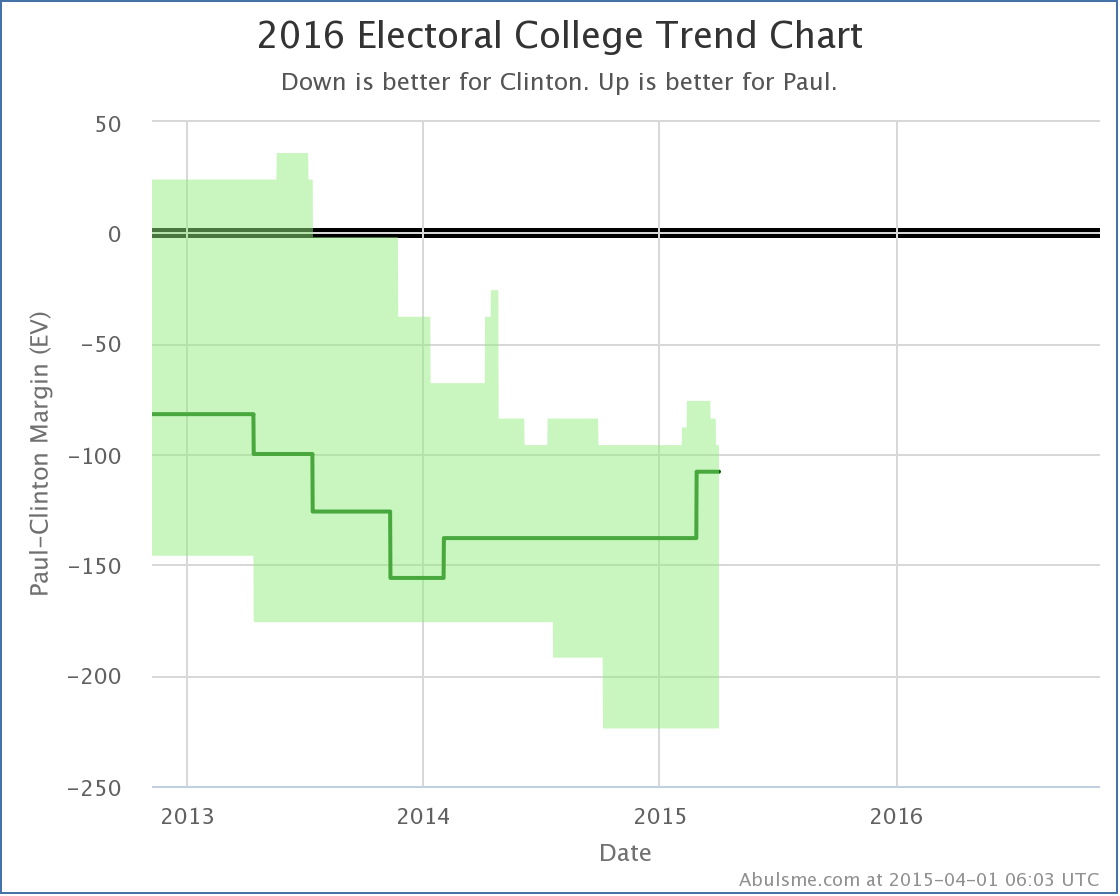
With New Hampshire now at a 6.0% Clinton lead in the average, it gets taken out of Paul’s “best case” scenario…

Looking at Paul’s “best case” as compared to the rest of the “5 best polled” combinations tracked here:
Since the November elections, Paul has improved his “best case” position from losing by 96 electoral votes, to losing by only 84 electoral votes. Bush, Christie and Huckabee meanwhile have actually all had their best cases get worse in this timeframe. (Ryan has held steady, but has said he isn’t running and hadn’t been polled much.)
What about Cruz you say? Didn’t he just announce? And Walker? He’s still getting lots of buzz! Or maybe even Rubio? Well, the polling on those combinations still isn’t that great and don’t make my top five. But they are improving. Right now Clinton vs Cruz is the 6th best polled combo, Clinton vs Rubio is at #7, and Clinton vs Walker is at #8. You can click through on those links if you want to see what those look like at the moment. But the amount of state level polling on those guys still isn’t that great, so take what you see there with a big lump of salt.
(And if you go even deeper and look at combos with non-Clinton Democrats, bring a whole wheelbarrow of salt.)
Note: This post is an update based on the data on my 2016 Electoral College Analysis Site. All of the charts and graphs seen here are from that site. Graphs, charts and raw data can be found there for the race nationally and in each state for every candidate combination that has been polled at the state level. In addition, comparisons of the best polled candidate combinations both nationally and each in each state are available. All charts above are clickable to go to the current version of the detail page the chart is from, which may contain more up to date information than the snapshots on this page, which were current as of the time of this post.
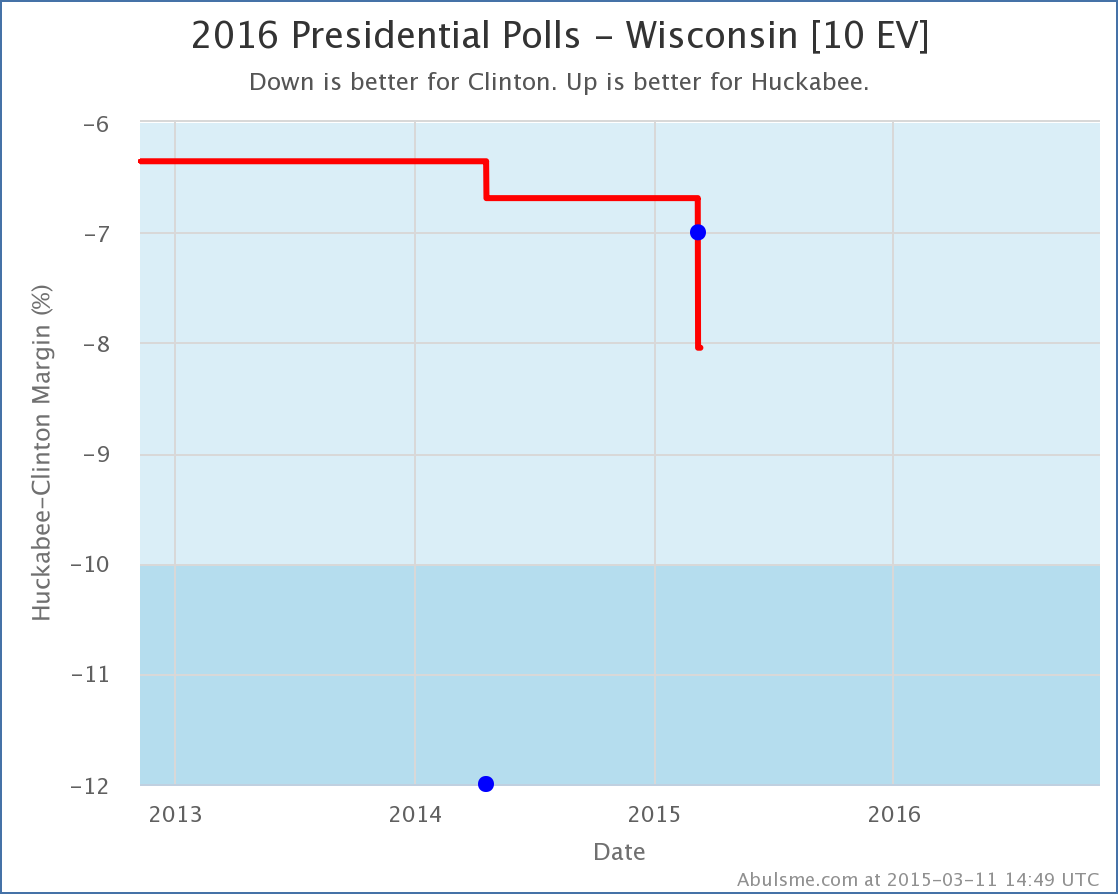
Today’s update was new PPP polling in Wisconsin. PPP polled 11 candidate combinations. Of these only one produced a notable change in one of the “5 best polled candidate pairs” I track most closely here.
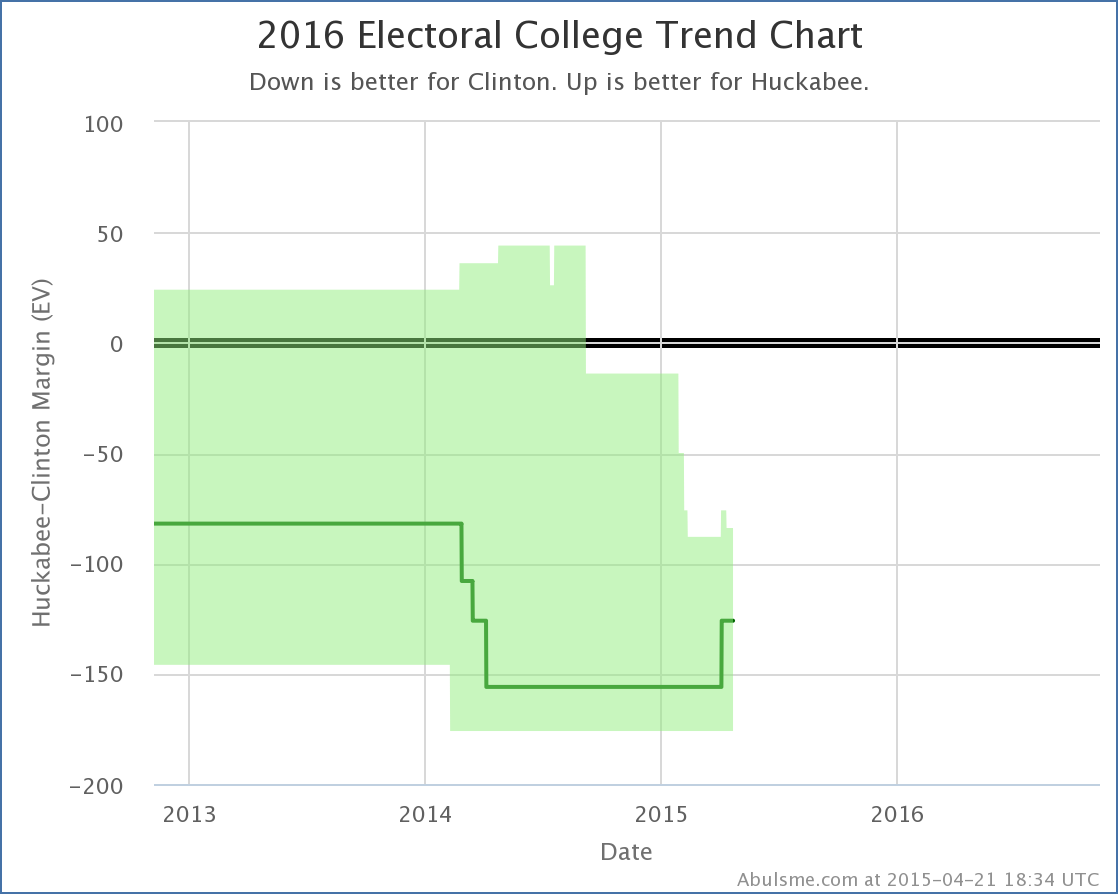
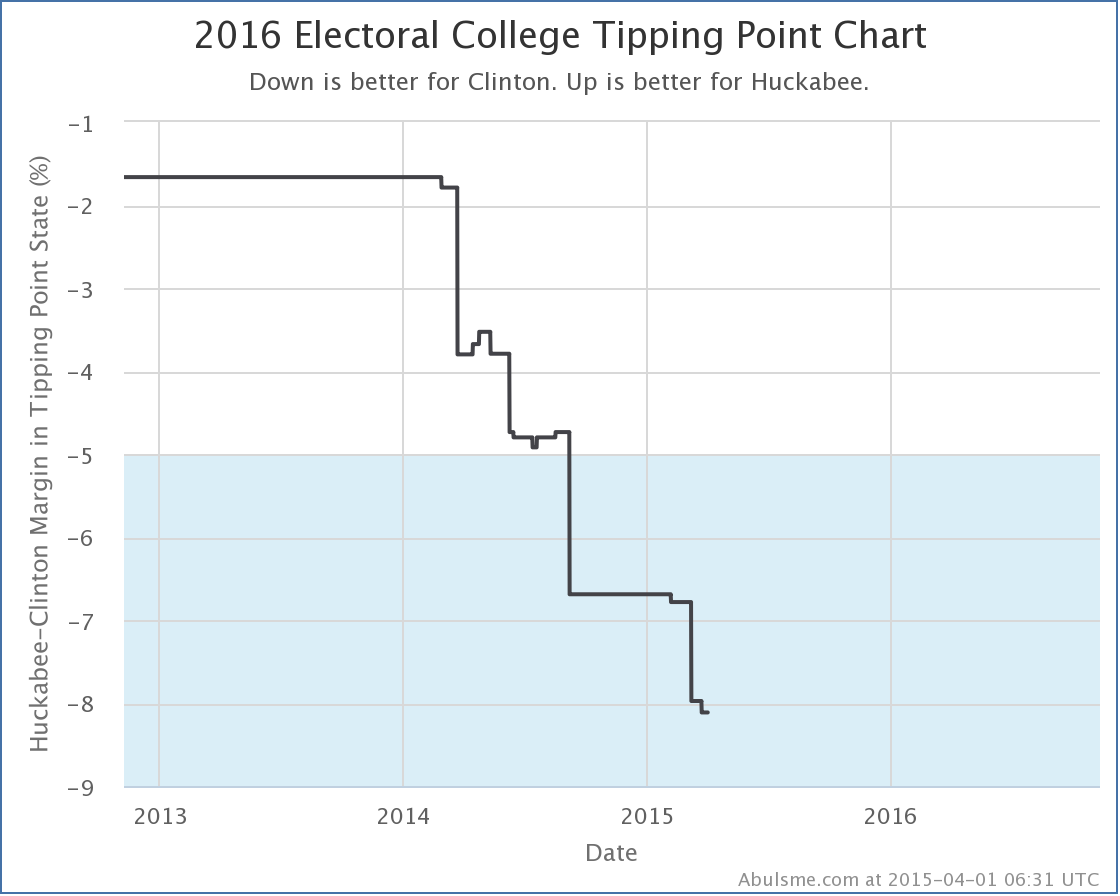
Specifically, this was the second poll of Clinton vs Huckabee in Wisconsin (the last was also by PPP, back in April 2014). This poll did not cause a category change in the average, it was Strong Clinton before, and it is Strong Clinton now:
So with no category change, why am I bothering with a post?
Well, Wisconsin slipping further into Clinton territory (from a 6.7% Clinton lead to a 8.0% Clinton lead) reshuffled the ordering of the states when sorted by margin and Wisconsin slipped past Minnesota (where Clinton leads by 6.8%). Minnesota had been the tipping point state. So Clinton doesn’t necessarily need Minnesota any more, because it is easier to get Wisconsin. This means the tipping point shifts to 8.0% in Virginia.
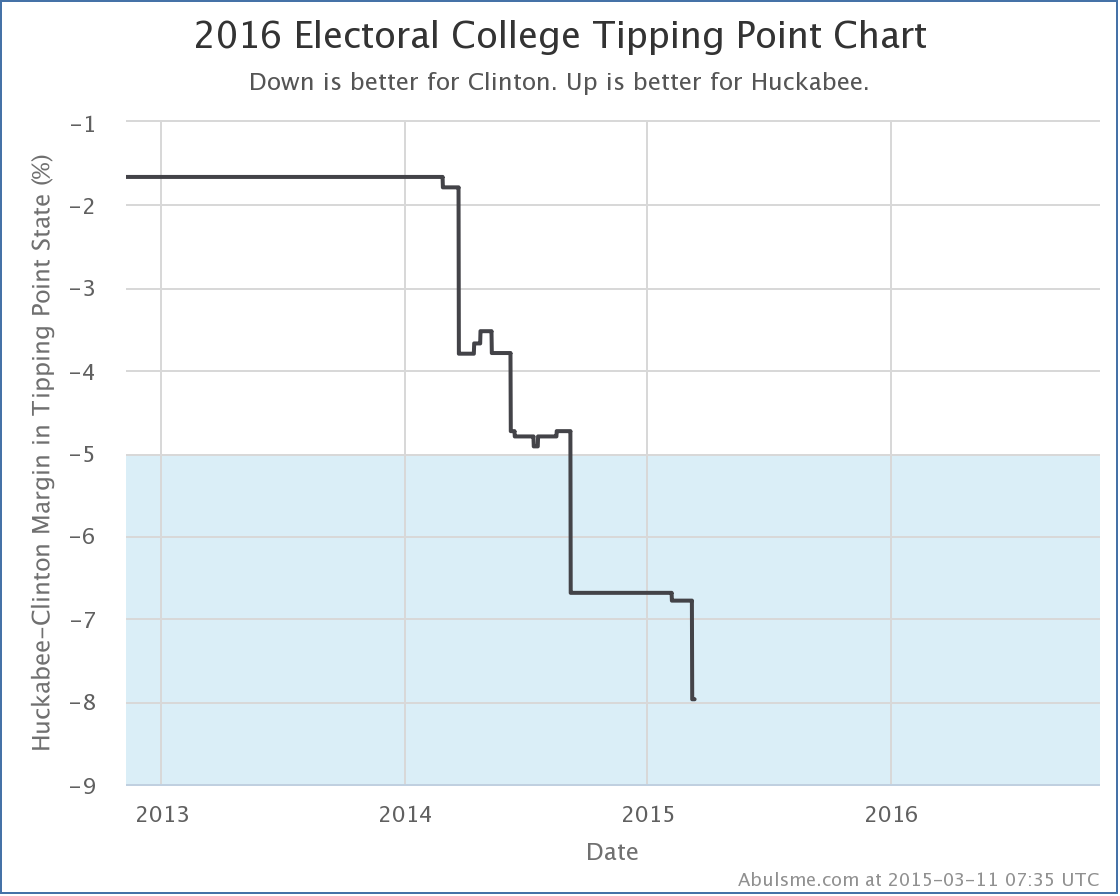
The last time the tipping point moved even briefly in Huckabee’s direction was last August, but as you can see, the general trend has been that the more polling there is on this combination, the worse it looks for Huckabee.
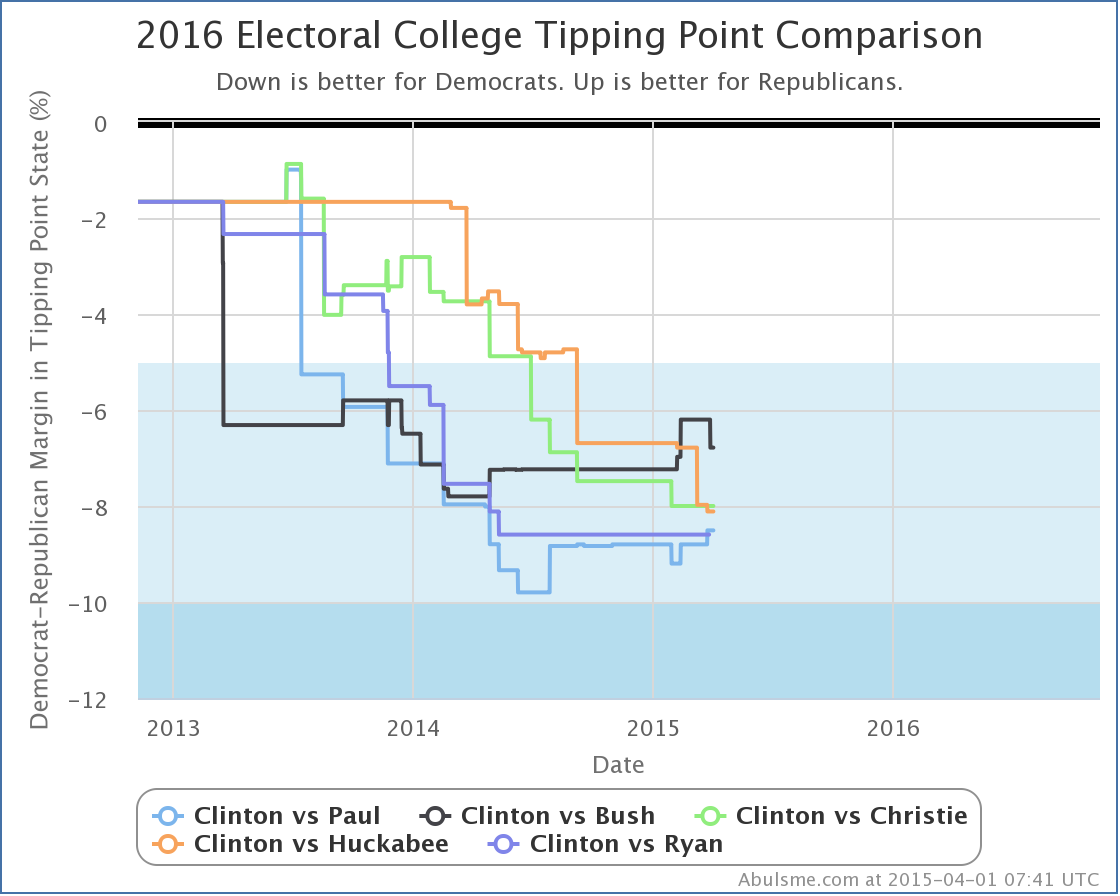
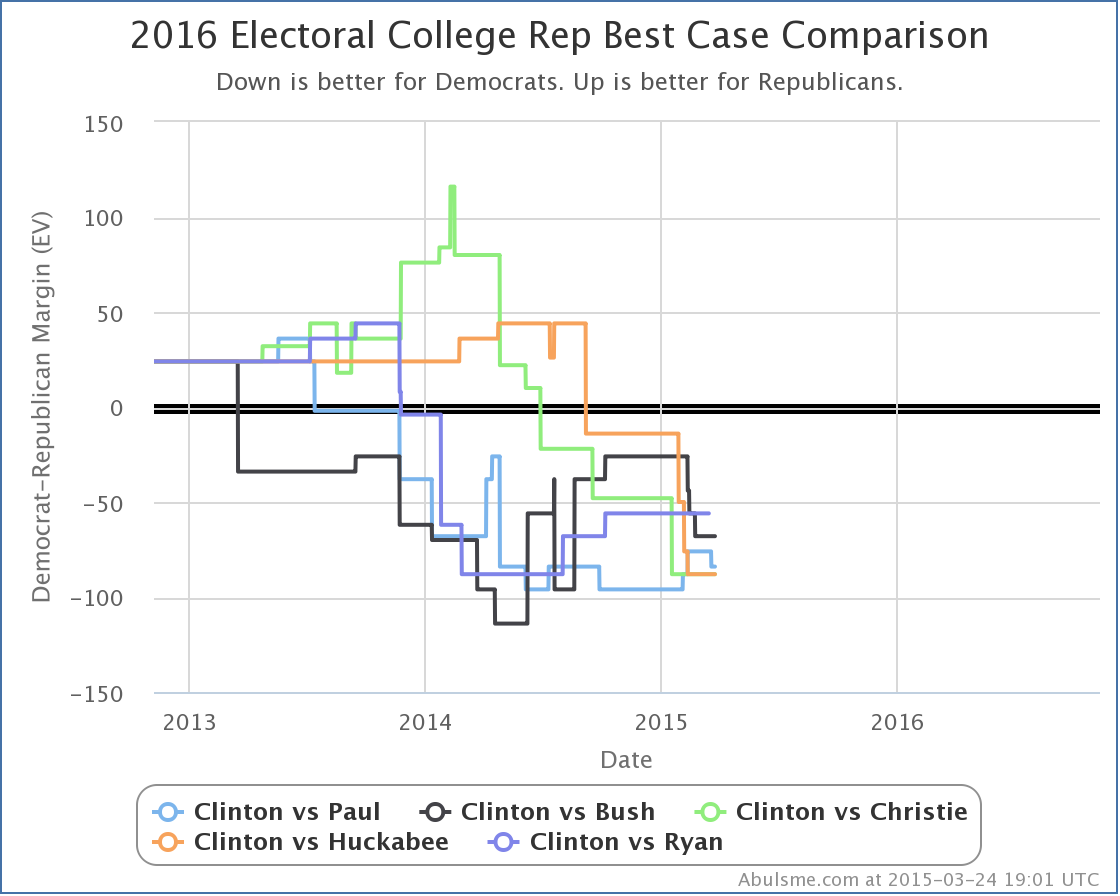
Since this is an otherwise short update, a quick look at how the tipping point looks across all five “best polled” candidate combinations at the moment:
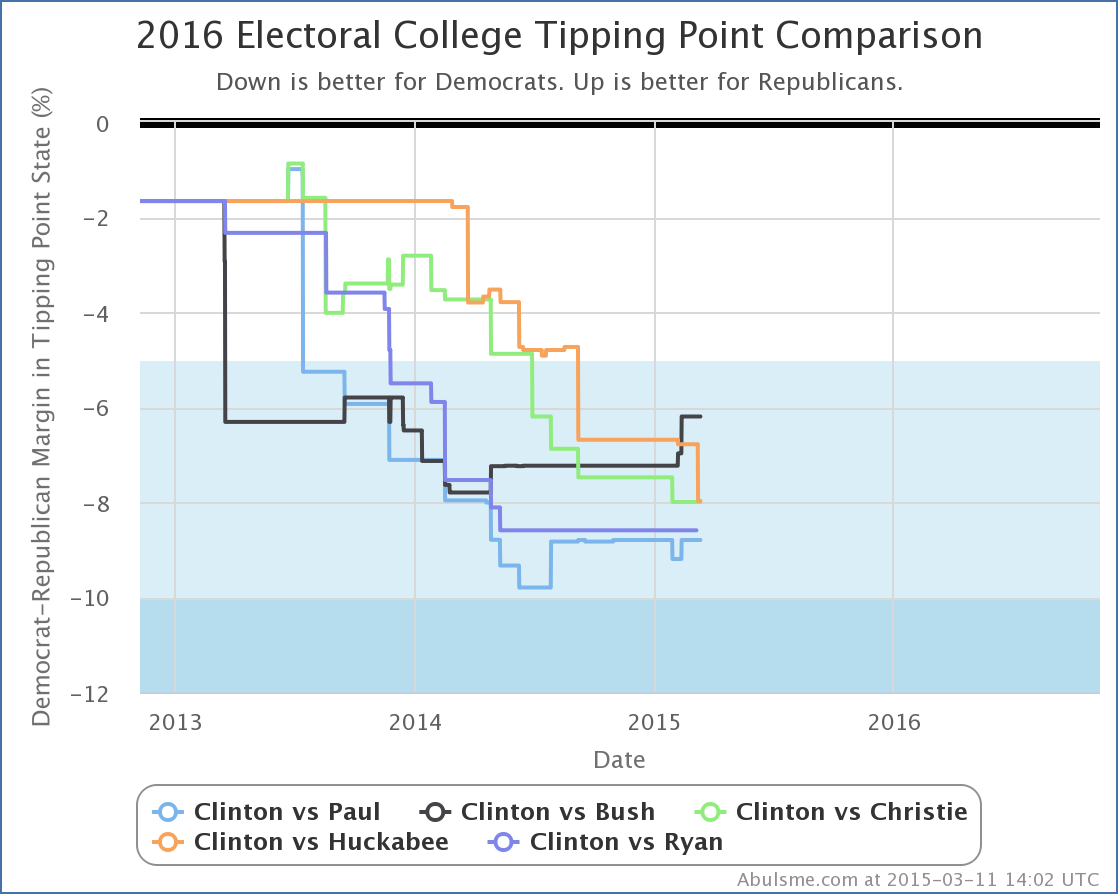
All of the Republicans are running way behind Clinton, but the trends are different.
Basically, we can group the five candidates (all vs Clinton) into three categories based on the last six months or so of tipping point movement:
- Republicans gaining strength against Clinton: Bush
- Republicans basically flat against Clinton: Paul and Ryan
- Republicans losing ground against Clinton: Christie and Huckabee
Ryan has said he is not running of course. There is also lots of talk about Walker, and sometimes of Cruz or Rubio, or even of combinations involving Democrats other than Clinton occasionally, but polling at the state level on all of those other combinations is still significantly more sparse than the five combinations here, and therefore the data less reliable, so we leave them out for now.
Note: This post is an update based on the data on my 2016 Electoral College Analysis Site. All of the charts and graphs seen here are from that site. Graphs, charts and raw data can be found there for the race nationally and in each state for every candidate combination that has been polled at the state level. In addition, comparisons of the best polled candidate combinations both nationally and each in each state are available. All charts above are clickable to go to the current version of the detail page the chart is from, which may contain more up to date information than the snapshots on this page, which were current as of the time of this post.
Edit 2015-03-16 17:44 UTC to add standard note to end.
Today’s poll update was the addition of the Quinnipiac Swing State Poll, which included Florida, Ohio and Pennsylvania. Within the five “best polled” candidate combinations, this caused three changes worthy of note here. All three were moves toward Clinton and away from the Republicans.
First up, since it is the only one that actually involves changing the electoral summary for a candidate pair… Clinton vs Huckabee.
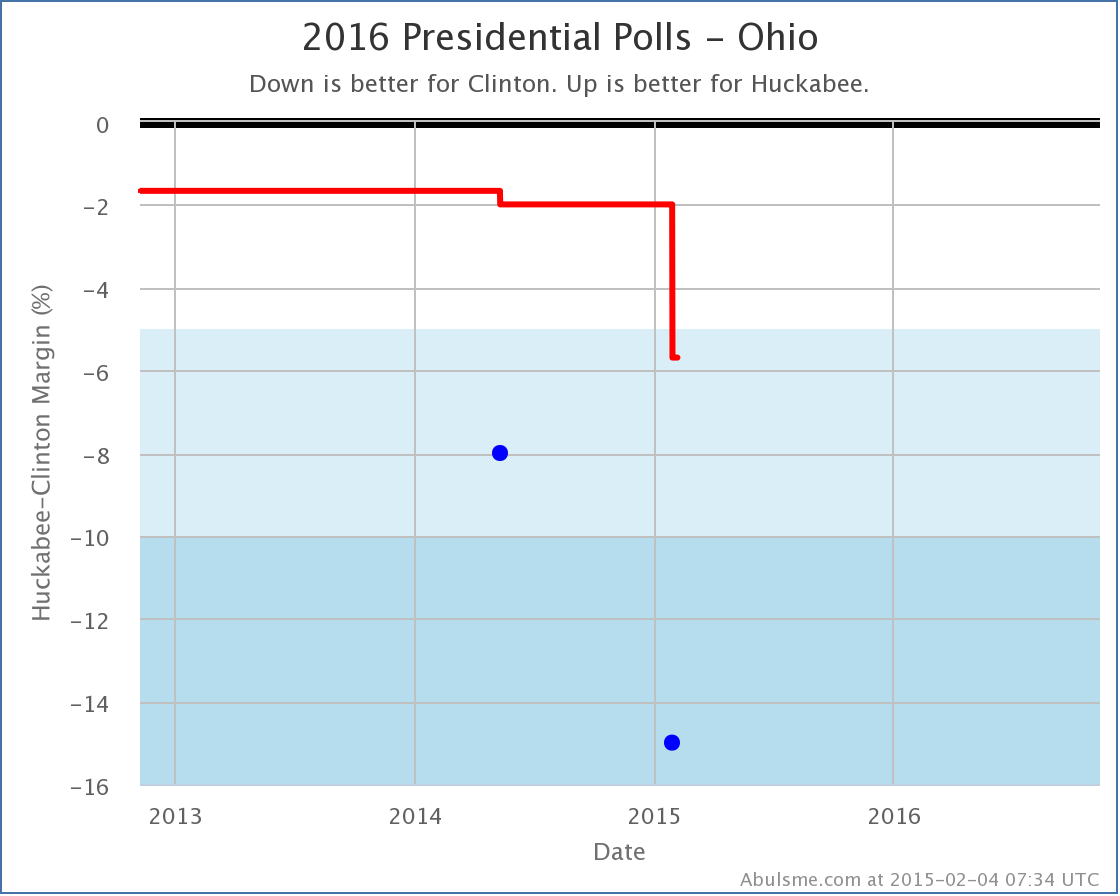
This is only the second time Clinton vs Huckabee in Ohio has been polled, but both new polls pull the state more toward the Democrat than the average of the last five presidential elections (which gave a 1.7% Dem advantage). This latest Ohio poll pulls the five poll average to a 5.7% lead for Clinton, which takes the state out of the “Weak” category which I allow to swing back and forth between the candidates to produce the “Best Case” scenarios for each candidate.
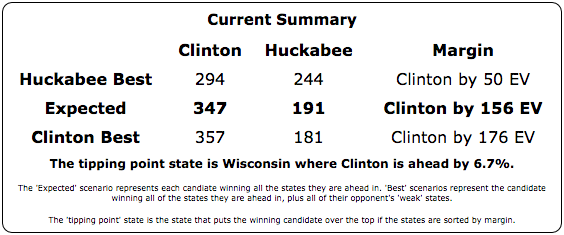
With the loss of Ohio from the list of “Possibles”, Huckabee’s “best case” moves from Clinton by 14 EV, to Clinton by 50 EV.
Of the five “best polled” candidate combinations, Clinton vs Huckabee is still #5 with much less comprehensive polling than Paul, Bush and Christie, so this may still be overstating where Huckabee would really be if more states were more fully polled.
The next two changes don’t actually change the Expected or Best cases for candidates, but rather are just changes to the “Tipping Point”. The tipping point essentially describes how much polls would have to move nationally (assuming an even distribution of movement in all states) to change who has the lead in the electoral college… in other words, how far ahead or behind the candidate is overall.
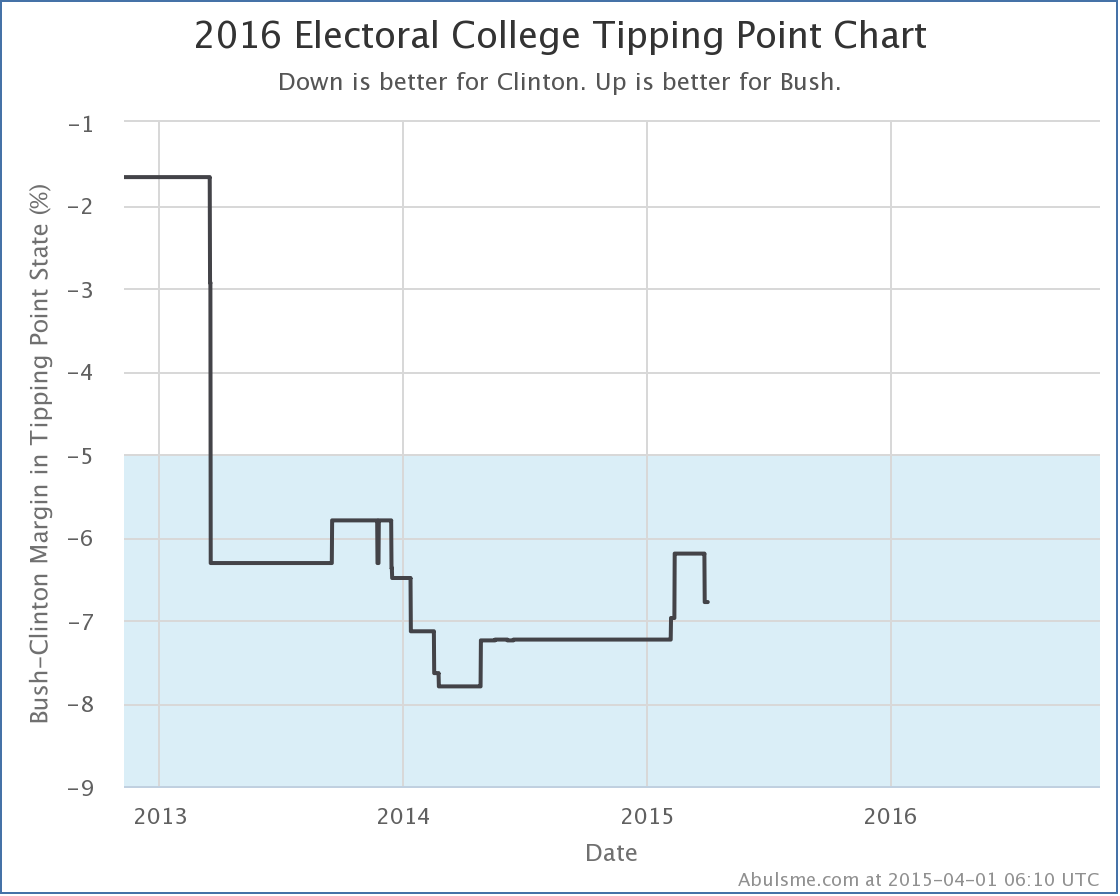
So next up is Clinton vs Paul:
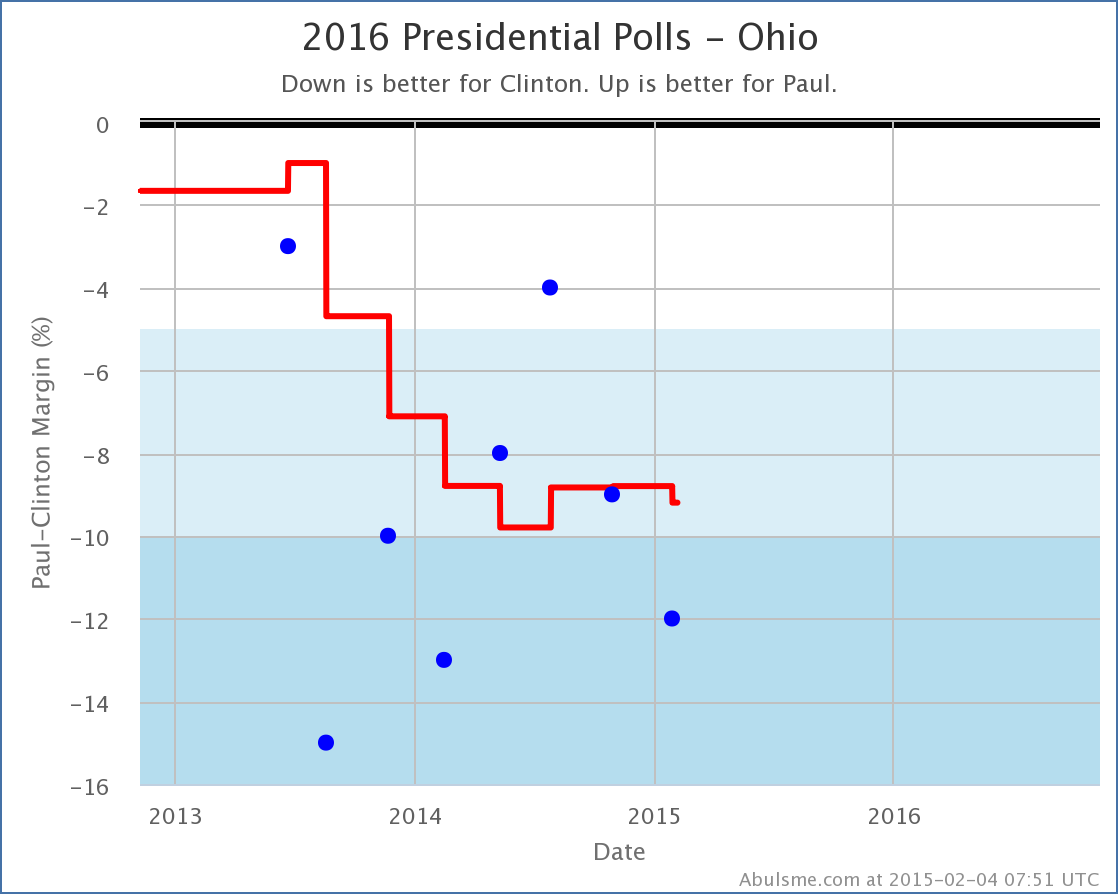
With the new poll, Paul moves from being behind 8.8% in Ohio, to being behind 9.2% in Ohio. Both of these are in the “Strong Clinton” category, so there is no category change here, but Ohio was the tipping point state in this contest, and so any movement in this state will generally mean movement in the tipping point.
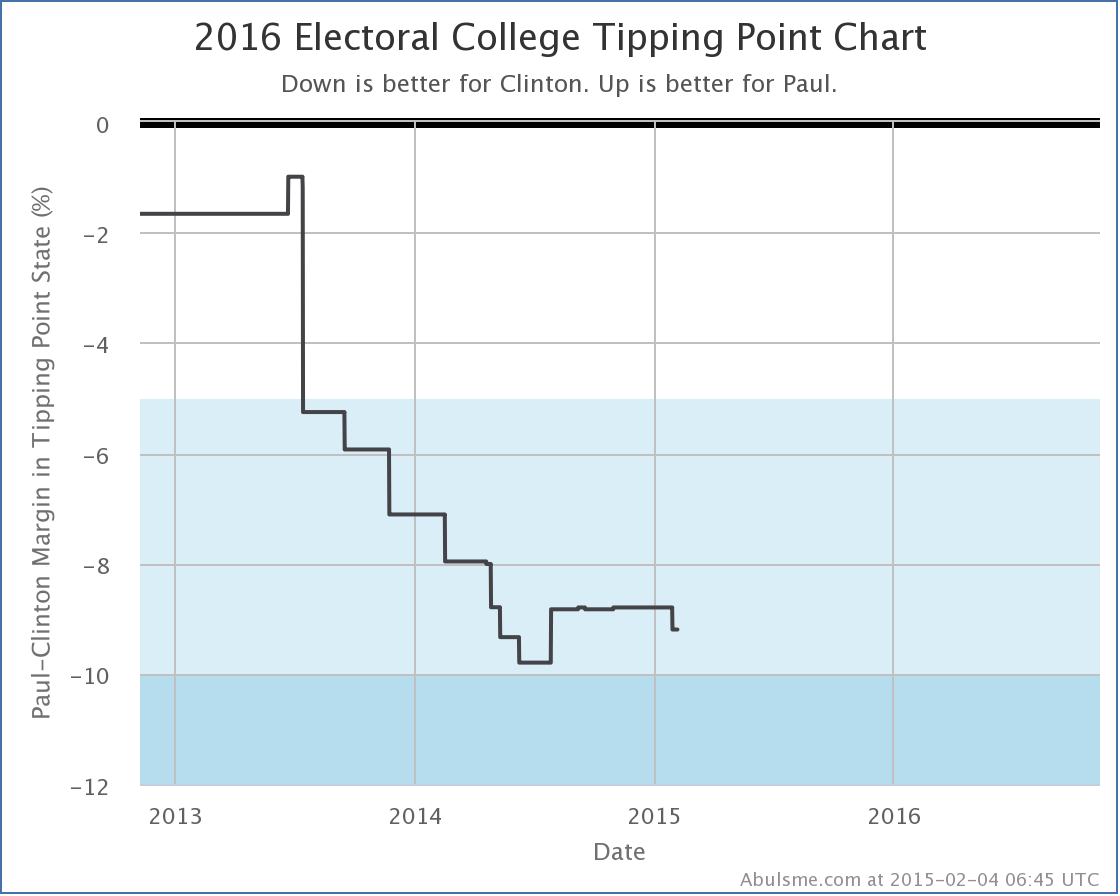
As you can see, the Clinton vs Paul tipping point has been between an 8% and 10% Clinton lead for most of the last year, so this isn’t breaking any new ground. The trend before last summer on this chart was basically just the process of getting enough polls to have a good view of this candidate pair, so things have essentially just been pretty flat since then. The new change doesn’t really change that, although I’m sure Paul would still rather see this line go in the other direction. (Well, if Paul was looking at my charts, which he isn’t. :-) )
Finally, Clinton vs Christie. This time, the changes in two states were relevant:
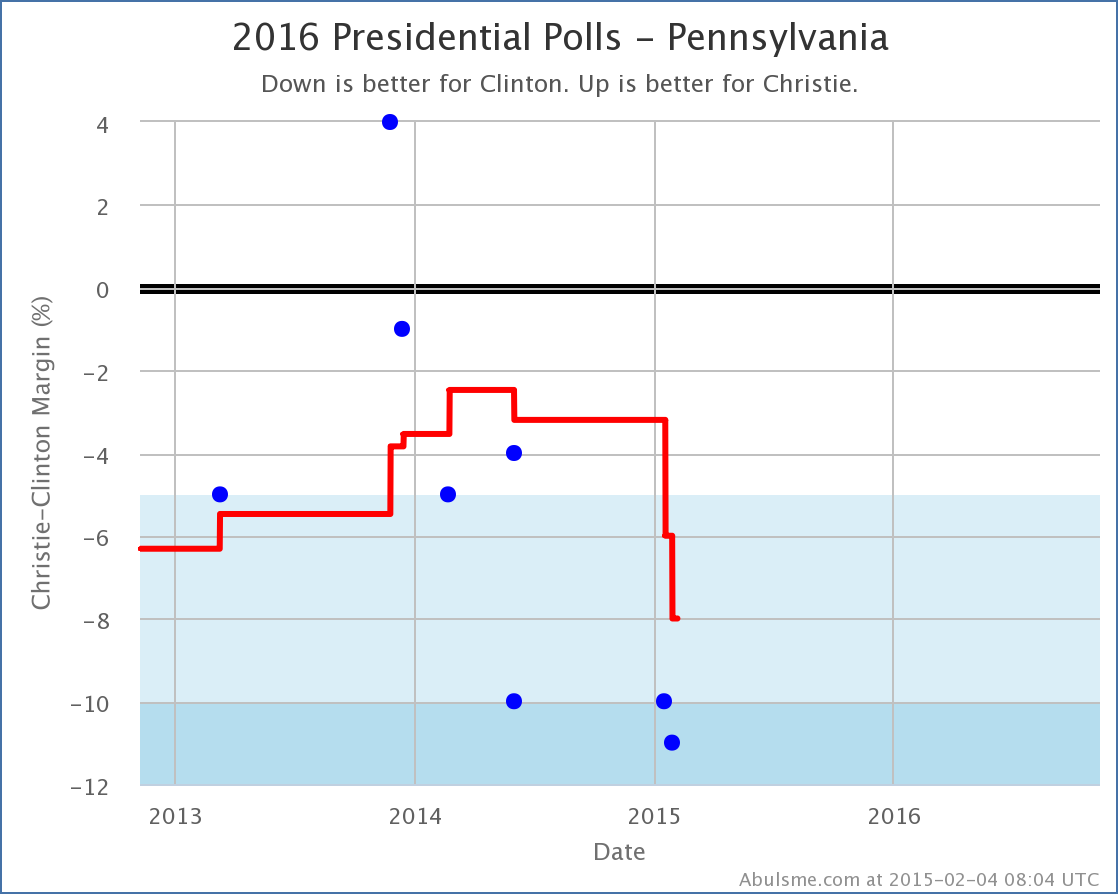
Last week I talked about Christie fading in Pennsylvania. The new polls today reinforce that trend, further worsening Christie’s position in Pennsylvania. It dropped him from being behind by 6.0% to being behind 8.0%, which pushed Pennsylvania past the previous tipping point of 7.5% in Minnesota.
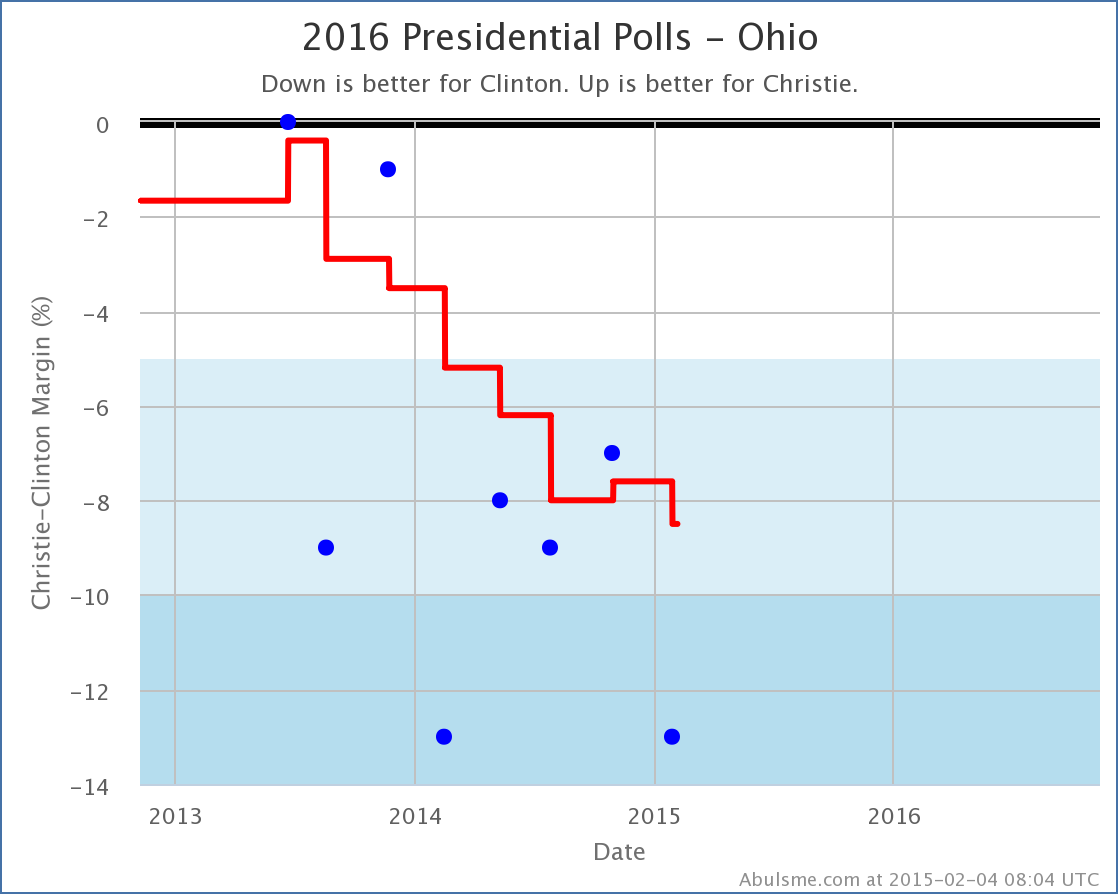
Now, Ohio also moved away from Christie with today’s polls (from Clinton by 7.6% to Clinton by 8.5%). If it hadn’t, Pennsylvania would have pushed past Ohio too, which would have had a different result for the Tipping Point.
In the end, the tipping point for Clinton vs Christie moved from Clinton by 7.5% in Minnesota, to Clinton by 8.0% in Pennsylvania.
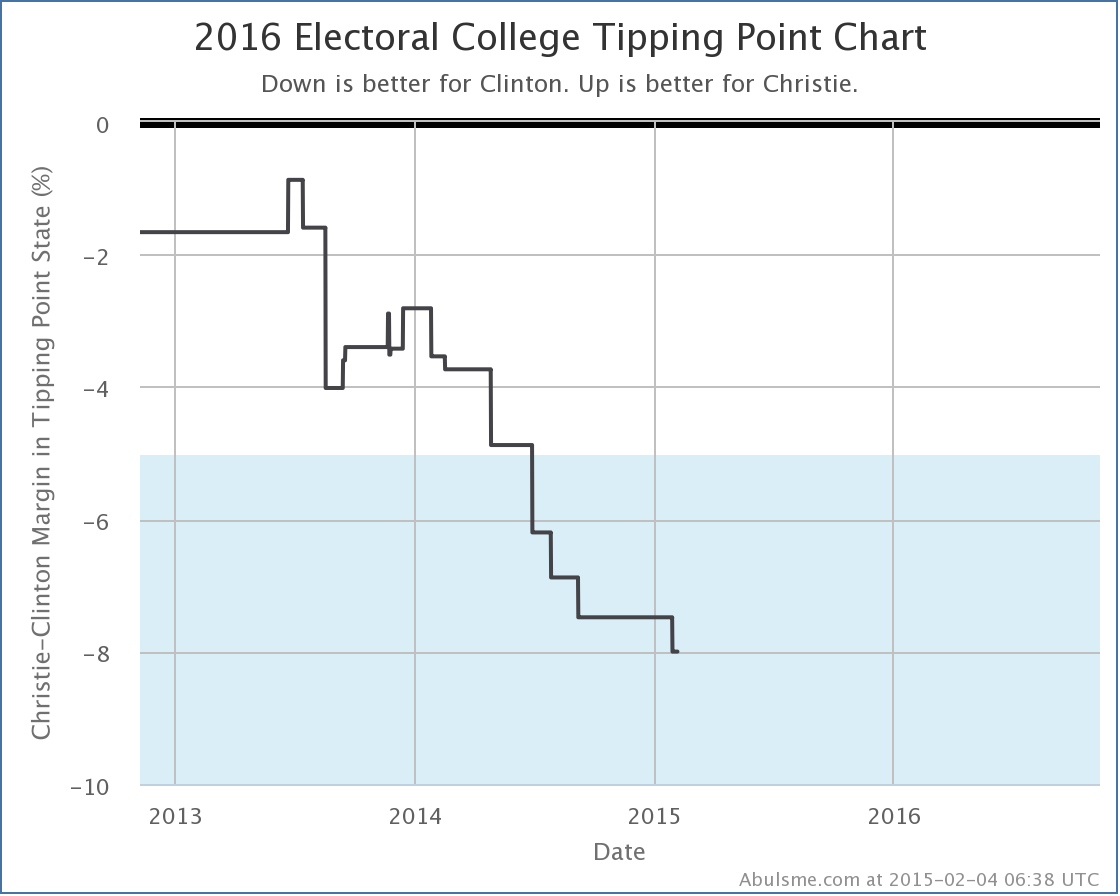
Unlike Clinton vs Paul, with Clinton vs Christie we’ve basically just been seeing a continued trend away from Christie and toward Clinton. Christie has not been faring well lately on this front.
Before closing up, lets look at a couple of the comparison charts between the five best polled candidate pairs.
With Huckabee’s decline in best case, the Republican with the best best case against Clinton is now Bush, but that Best case is still losing by 26 electoral votes. (And the expected case if Bush did NOT manage to flip all the Weak Clinton states is Bush losing by 156 electoral votes.)
The worst best case versus Clinton is still Paul, losing by 96 electoral votes even if you give him all the Weak Clinton states. (Paul’s expected case is a bit better than Bush though, only losing by 138 electoral votes.)
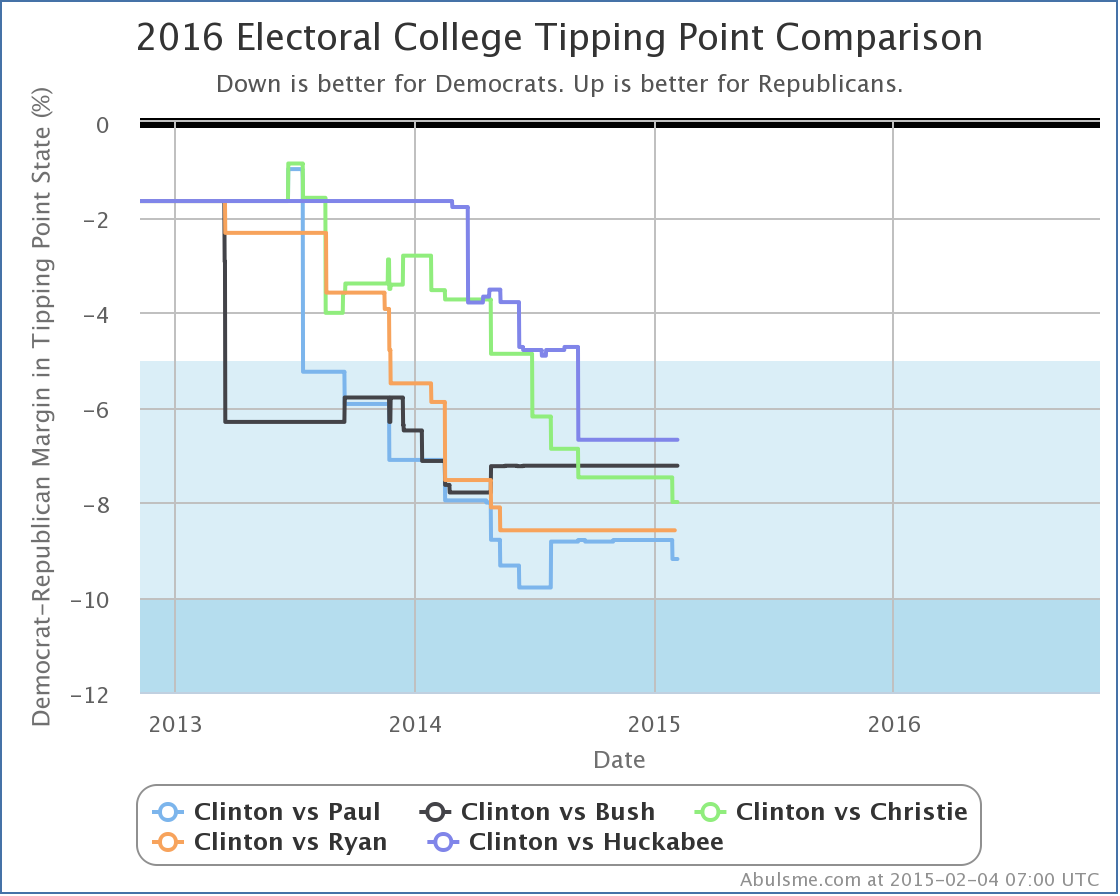
It looks a little different in terms of tipping point, with Huckabee doing best this time (behind by 6.7% in Wisconsin). Paul still in the rear here, behind by 9.2%.
Now, as people keep pointing out, and I will too, polls this far out from the election are NOT PREDICTIVE. All of the charts I’ve shown above say NOTHING about what the actual results in November 2016 will be. NOTHING.
However, that does NOT mean they are meaningless, or that they should be ignored. (Or why am I bothering with all this?) No, polls right now still give you a sense as to where things stand TODAY, which while it won’t tell you who will win 643 days from now, it DOES tell you how much work the candidates who are currently behind have to do in order to flip things. (Alternately, how much wiggle room the candidate in the lead has available as buffer against mistakes they might make.)
So, yes, pay attention to the polls. Even now. Just don’t make the mistake of believing that just because Clinton is way ahead of everybody now that necessarily means that will still be the case in a year and a half, when the polls DO start having some predictive power.
PS: There was also a tipping point change today for Clinton vs Romney but even with today’s new polls, Clinton vs Romney is still only the 20th best polled candidate combination, and with Romney declaring he isn’t going to run after all, he’s no longer as likely to climb the ranks as I thought a few weeks ago. If I had to guess as to the next change in the “Top Five” it would be Clinton vs Rubio (currently #7, but Rubio actively talking about being a candidate) replacing Clinton vs Ryan (currently #4, but Ryan having said he won’t run).
Edit 10:11 UTC – Added “Electoral College” prefix to title for consistency.
Polling in the last couple months has been a bit slow. Prior to the 2014 elections, there had been a lot of polling piggy backing on Senate polls. Not so much since the election. But finally, with the batch of polls I processed today, for the first time since I launched the Election 2016 site in November, there has been a change worth a blog post!*
Namely, looking at the Clinton vs Christie combination, with the addition of a PPP poll released on Thursday, Pennsylvania has slipped from “Weak Clinton” to “Strong Clinton”:
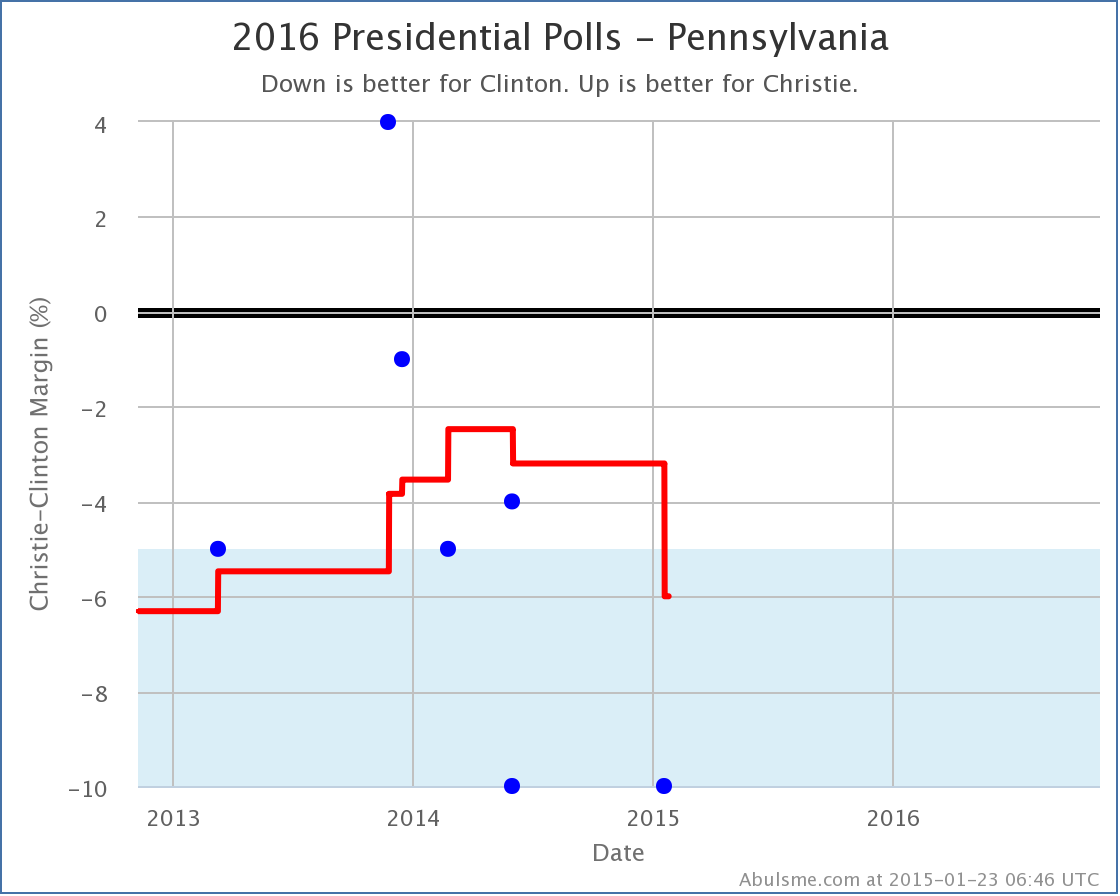
(Click through on the image for more details on the specific polls, etc.)
Now, you’ll notice there haven’t been all that many polls here. The five poll average at the moment covers 1.1 years. That is a long time. But even with this small number, you can see that in late 2013, Christie appears to have had a bit of a spike, making Pennsylvania look like a close state, with one poll even showing Christie ahead. But the more recent polls show Clinton with a healthy lead, and the 5 poll average now has Clinton with a 6.0% lead.
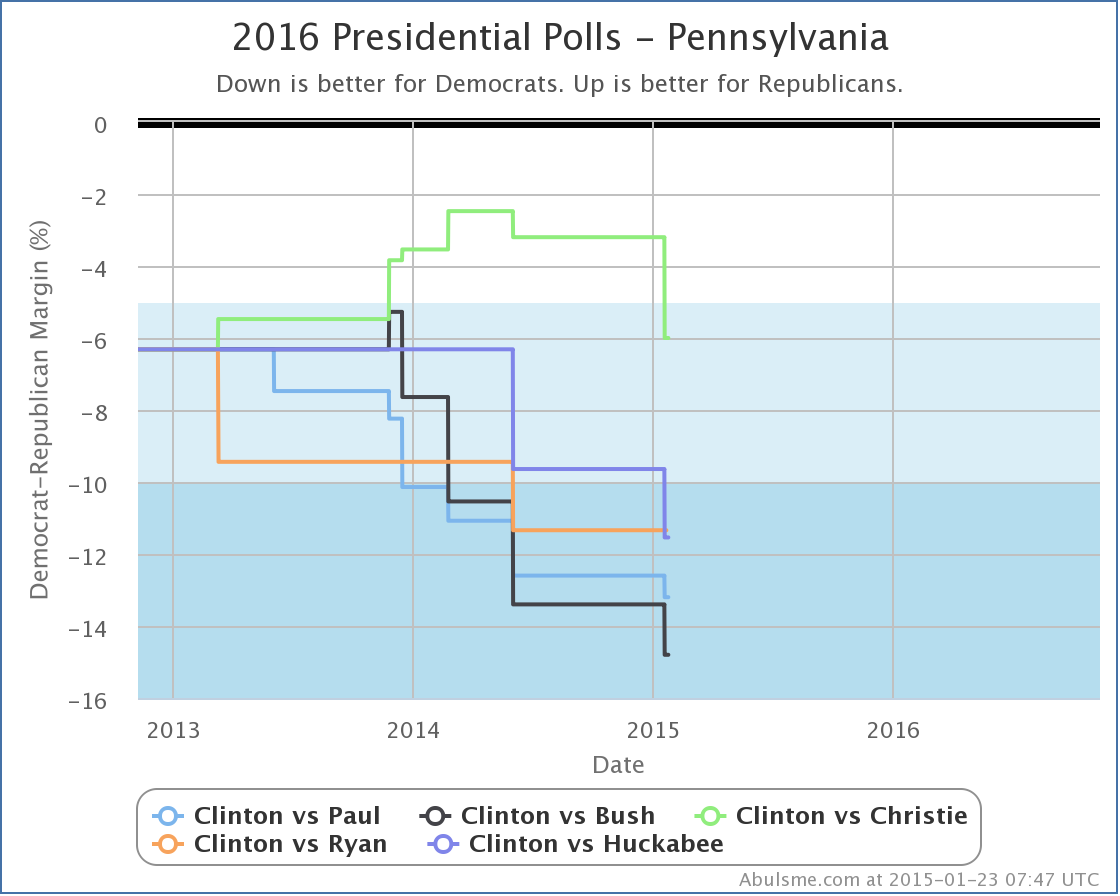
Now, this still leaves Christie looking better in Pennsylvania than the other 4 combinations that are “best polled” nationally:
(Again, click through on the image for more detail.)
Paul, Bush, Ryan and Huckabee all trail Clinton by more than 10% in Pennsylvania. So I guess Christie still has that.
Looking at what this means nationally, with Pennsylvania taken out of the “possible” category for Christie… at least for now… the summary for Clinton vs Christie looks like this:
After Christie’s best case peaked at winning by 116 electoral votes back in February 2014, the trend has been downward, and the new change just continues that:
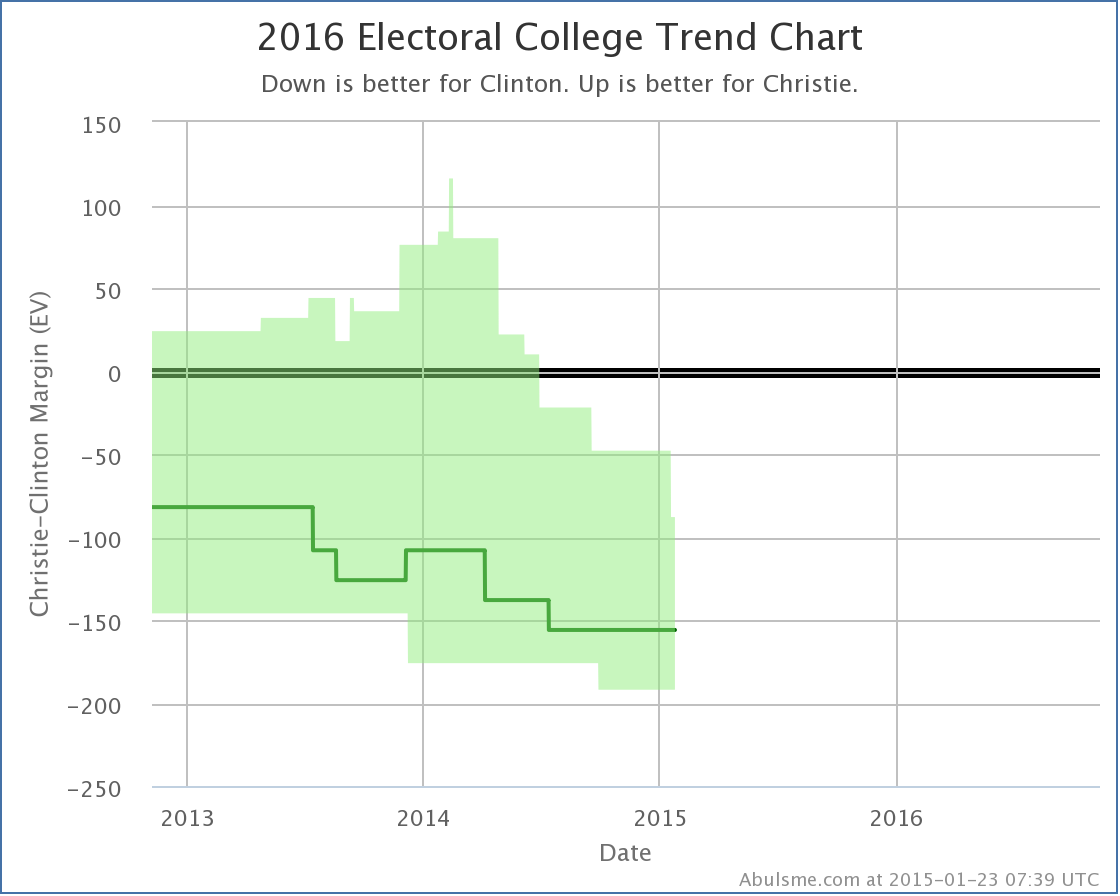
(Once again, click through on the image for… oh, never mind… you get how that works now, right?)
A lot of the “movement” here is still polling catching up with reality, but it does seem like Christie continues to fade, and so far he has not been able to reverse his fortunes. There is of course still a long time until we even get to the Iowa caucuses, let alone the 2016 election, but Christie isn’t doing all that great at the moment.
Since it is Christie’s “best case” that changed with the latest update, lets also take a quick look at the Republican best cases for all of the best polled combinations:
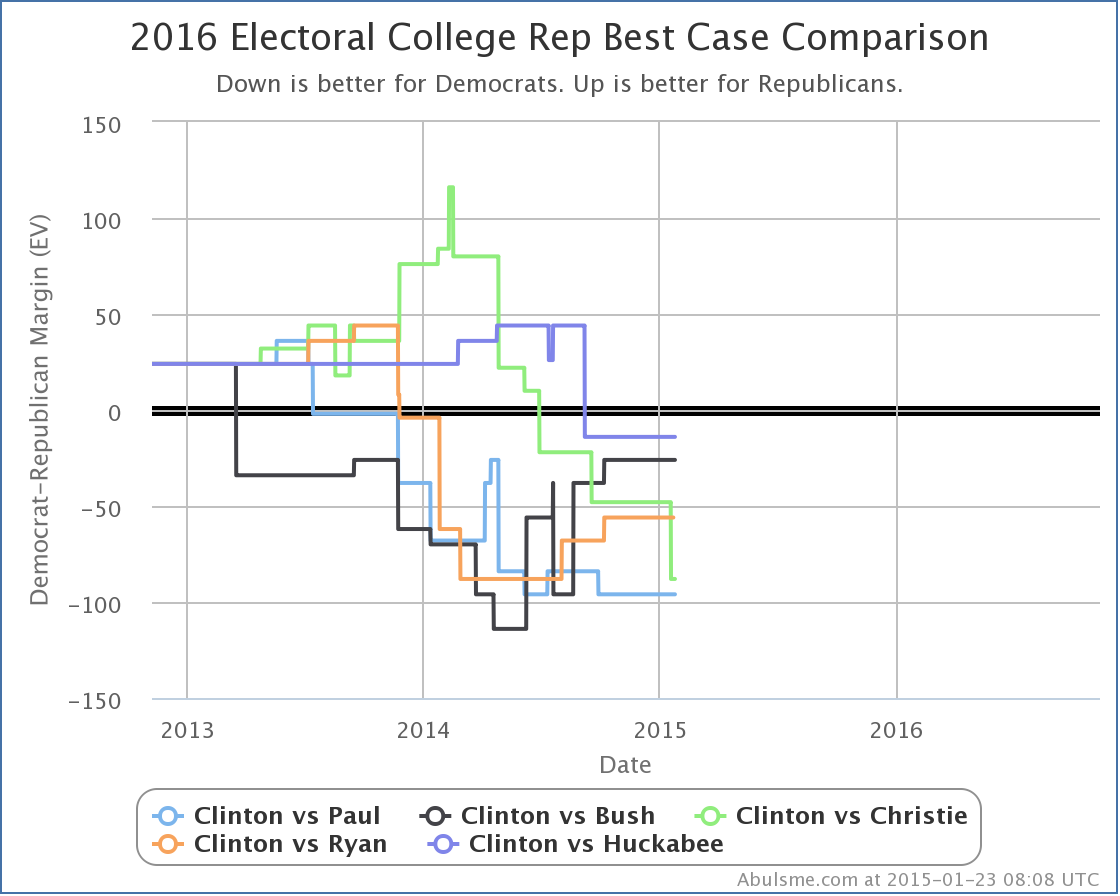
Wow, that looks messy. You’ll note that at the moment none of the five Republicans win against Clinton, even if you give them all of the close states. It looks like Huckabee actually has the best best case, but Huckabee is also the least well polled of the five, so take that one with a grain of salt. Otherwise, in terms of their best cases, in the last six to nine months while Christie’s situation has deteriorated vs Clinton, Bush and Ryan have improved theirs, and Paul has been basically flat.
Of course, Ryan has taken himself out of the race at this point. And Romney seems to have jumped in. As I described last week, as new polls are released Clinton vs Ryan should drop off the “Top 5 Best Polled” list and Clinton vs Romney will probably rise onto it. But not yet. Clinton vs Ryan is still #4 at the moment. The two additional polls for Clinton vs Romney since last week (one in NJ and one in PA) have moved Clinton vs Romney from the 21st best polled combination all the way up to… the 20th best polled combination. Still quite a ways to go. And still very sparse data. But if Romney is serious, the polls will come soon enough.
Stay tuned…
* For the moment, I consider a change to be “worth posting” if it involves one of the five best polled candidate pairs and it either changes one of the “summary” stats (the expected margin, the Republican best case margin, the Democratic best case margin), or there is a change to the tipping point margin of at least 0.1%. Of course, ALL changes in the summary, the tipping point margins, state categorizations, and even individual polls, for all candidate combinations, are posted at @ElecCollPolls for those interested in all those details.
|
|
