This is the website of Abulsme Noibatno Itramne (also known as Sam Minter).
Posts here are rare these days. For current stuff, follow me on Mastodon
|
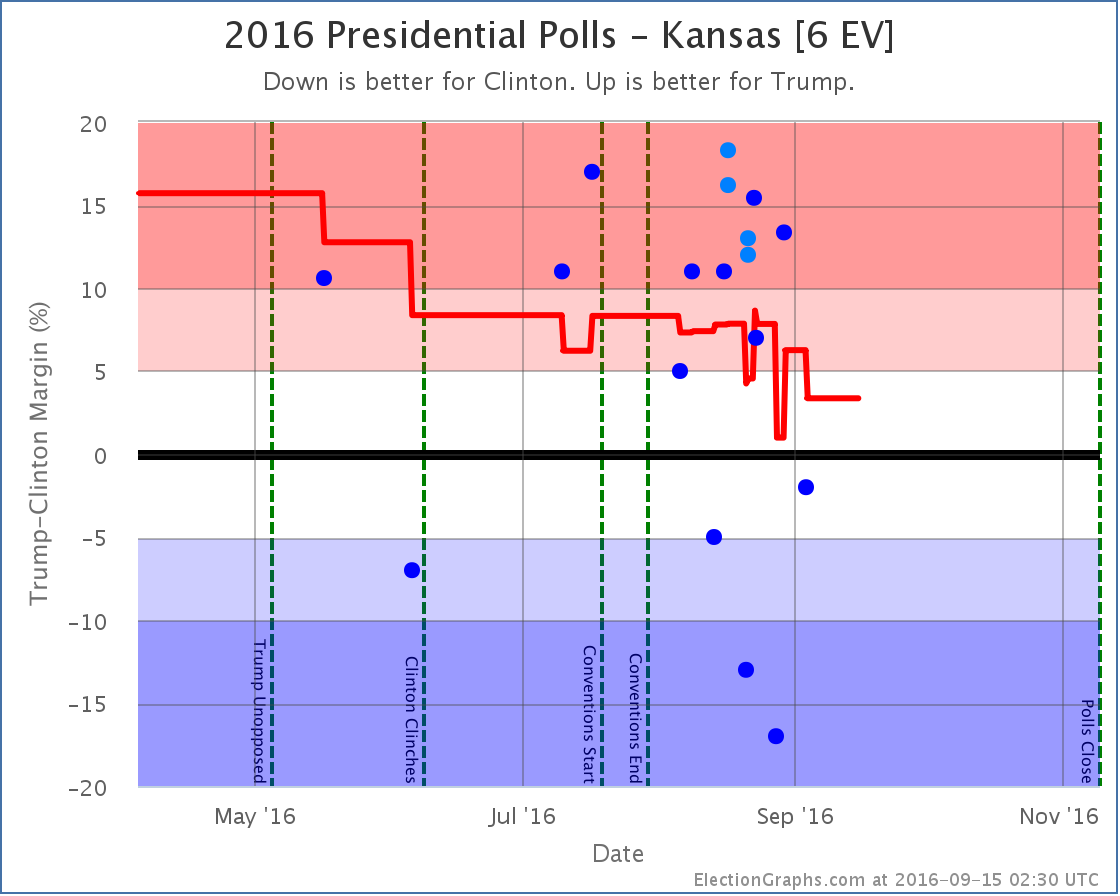
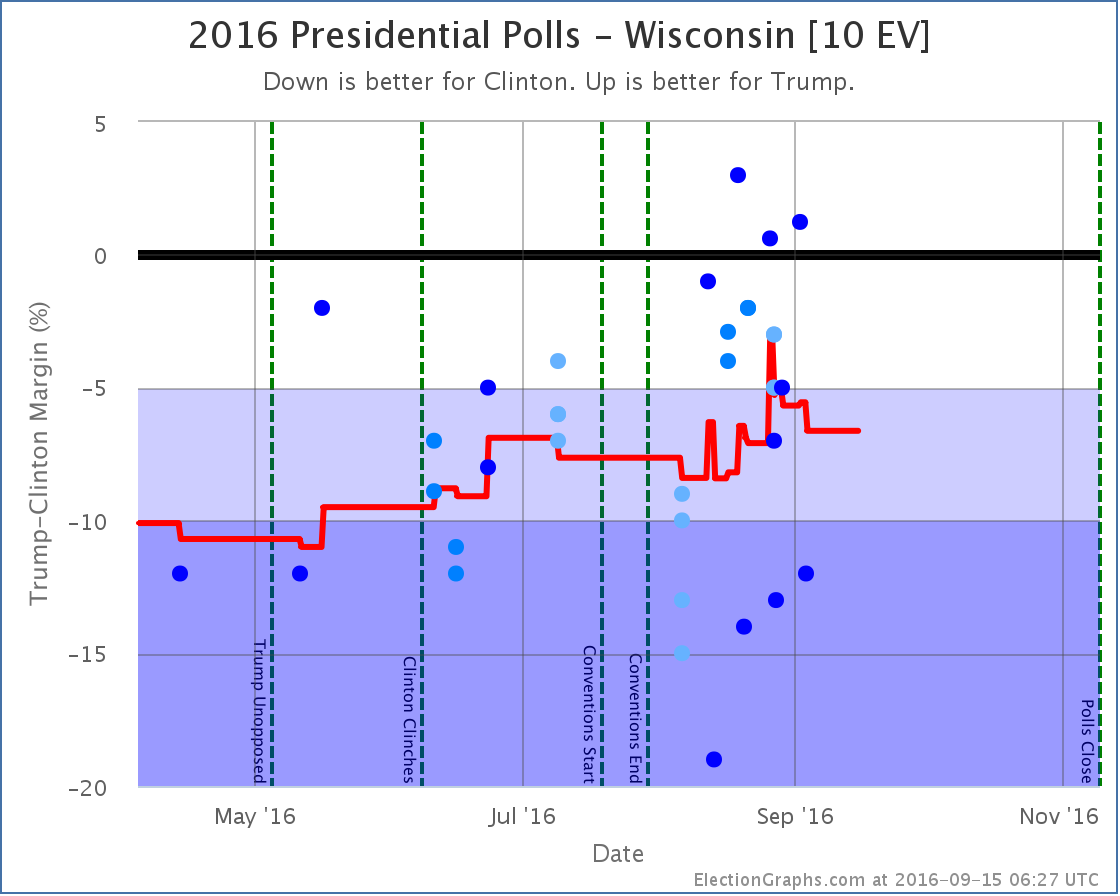
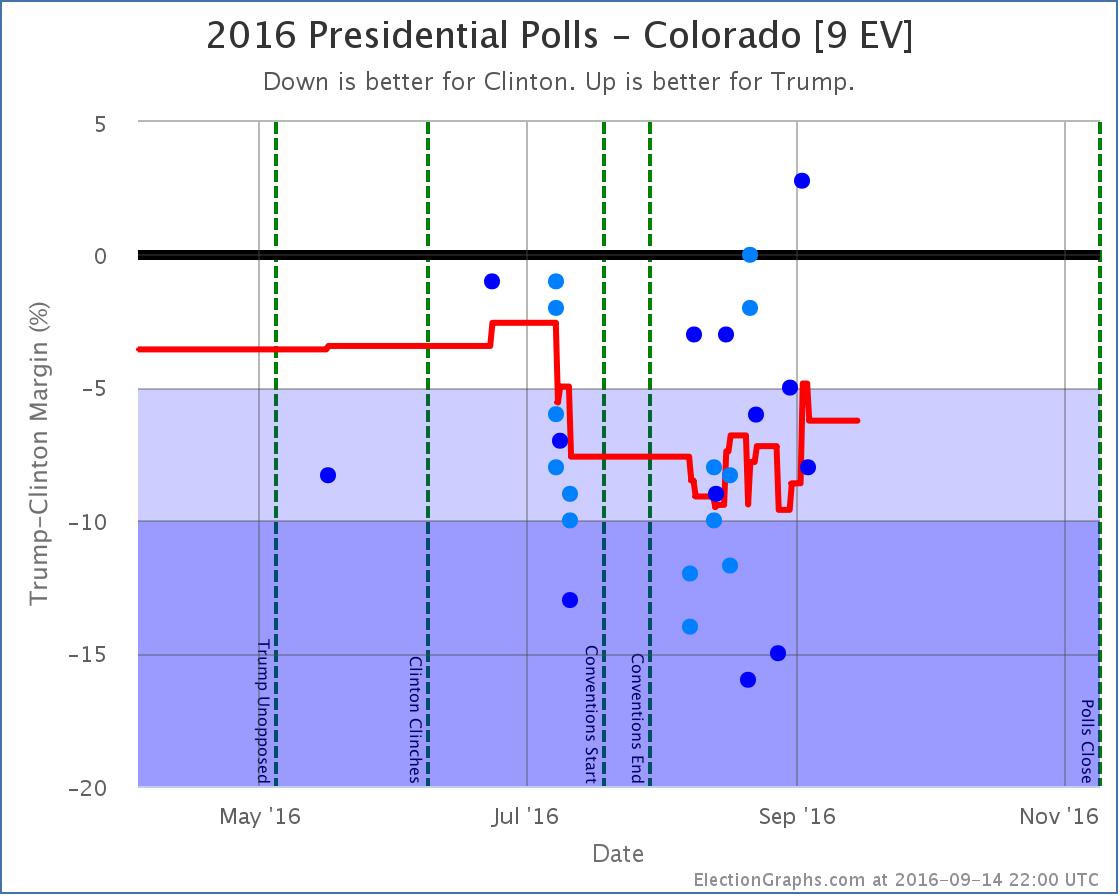
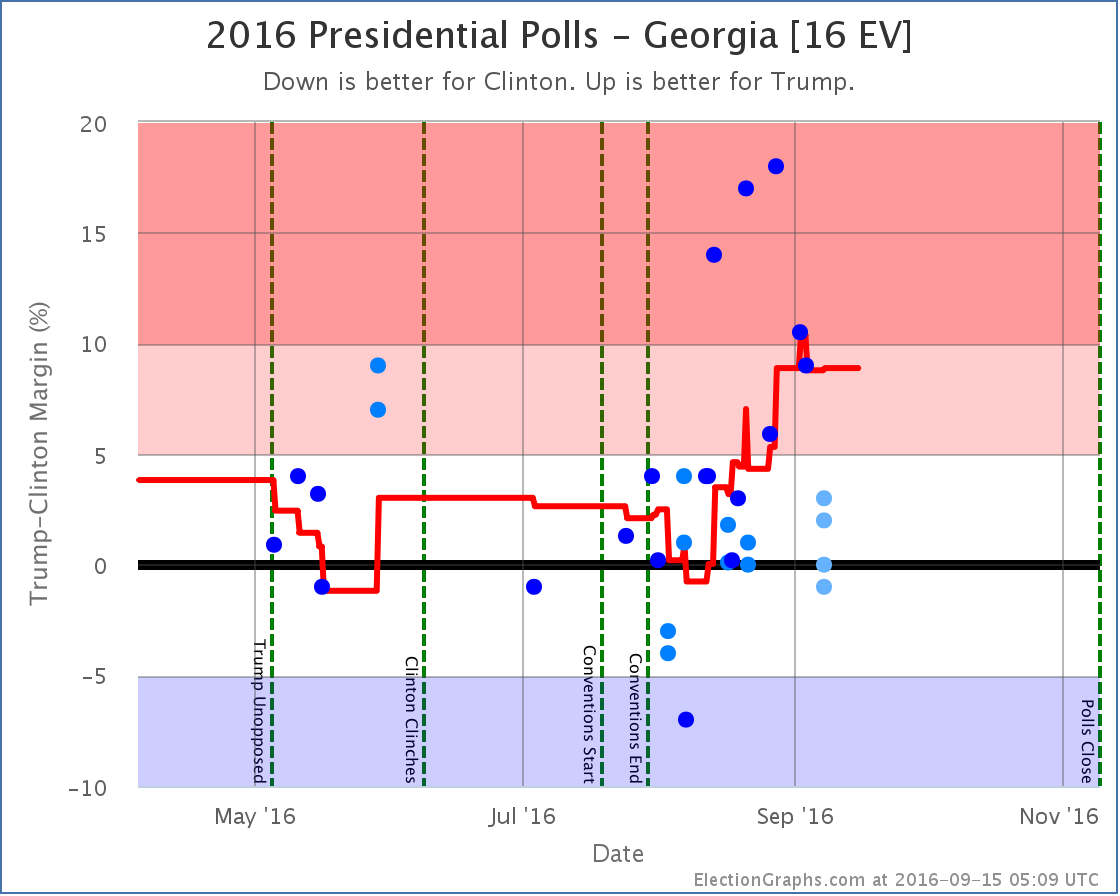
States with new poll data added since the last update: All 50 states and DC. Multiple times each. Notable changes in Florida, North Carolina, Ohio, Iowa, Pennsylvania, Kansas, Colorado, Wisconsin, Maine (All), and Georgia.
There have been tons of polls, including “50 state” polls from three different sources, one of which had weekly data going back four weeks that needed to be added. There were many shifts caused by this batch of polls. We’ll look at all the charts, but lets start with the headline:
The Romney Barrier
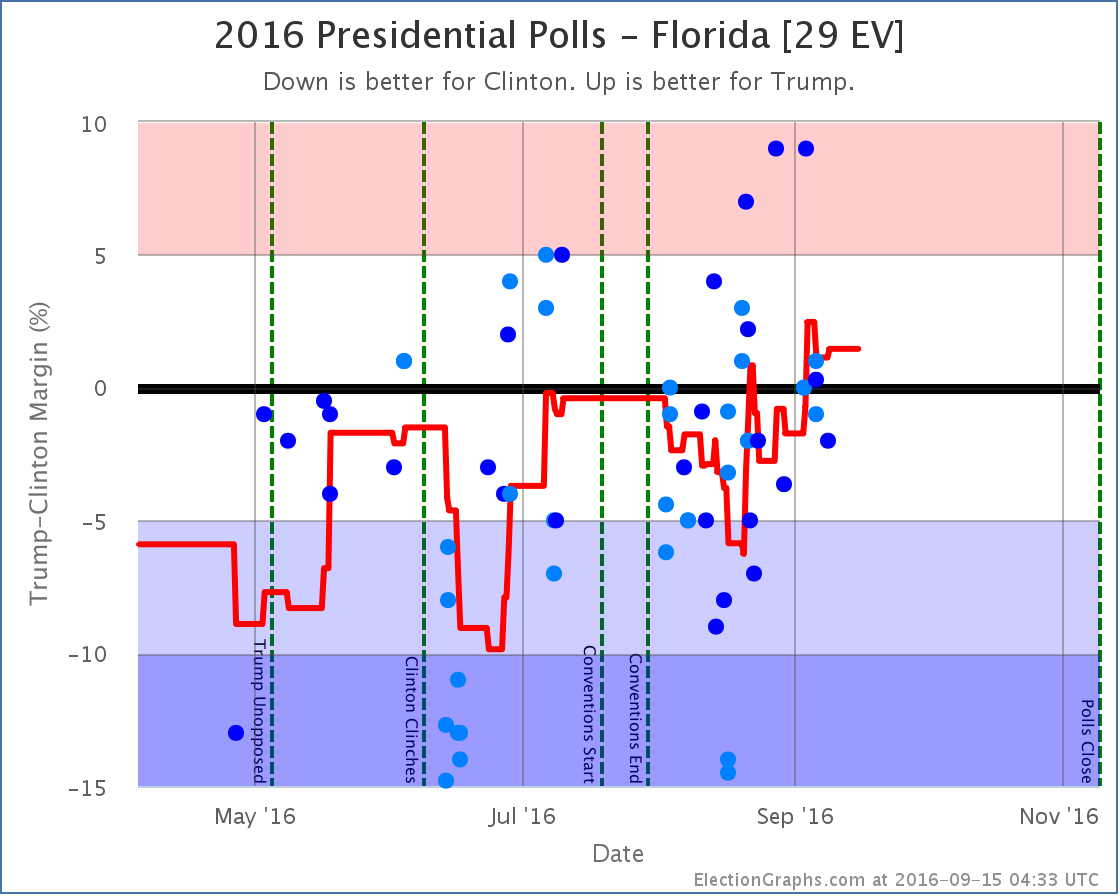
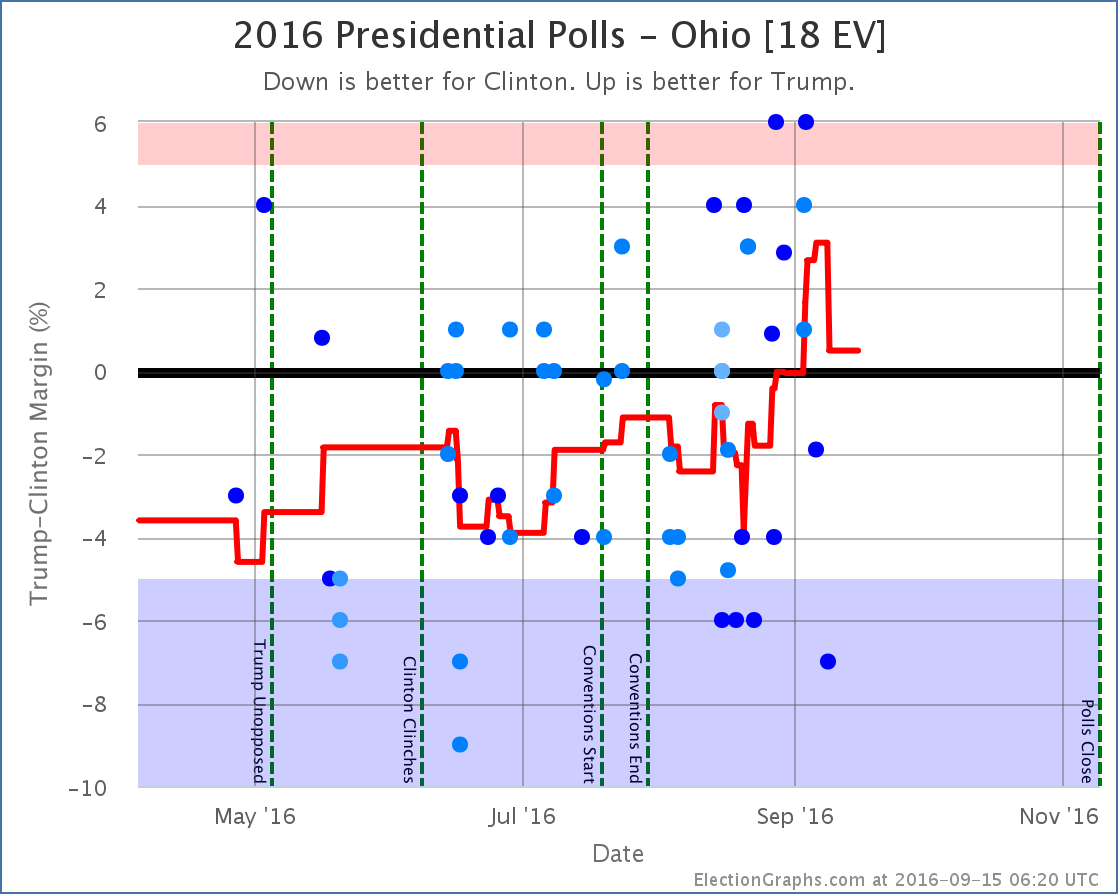
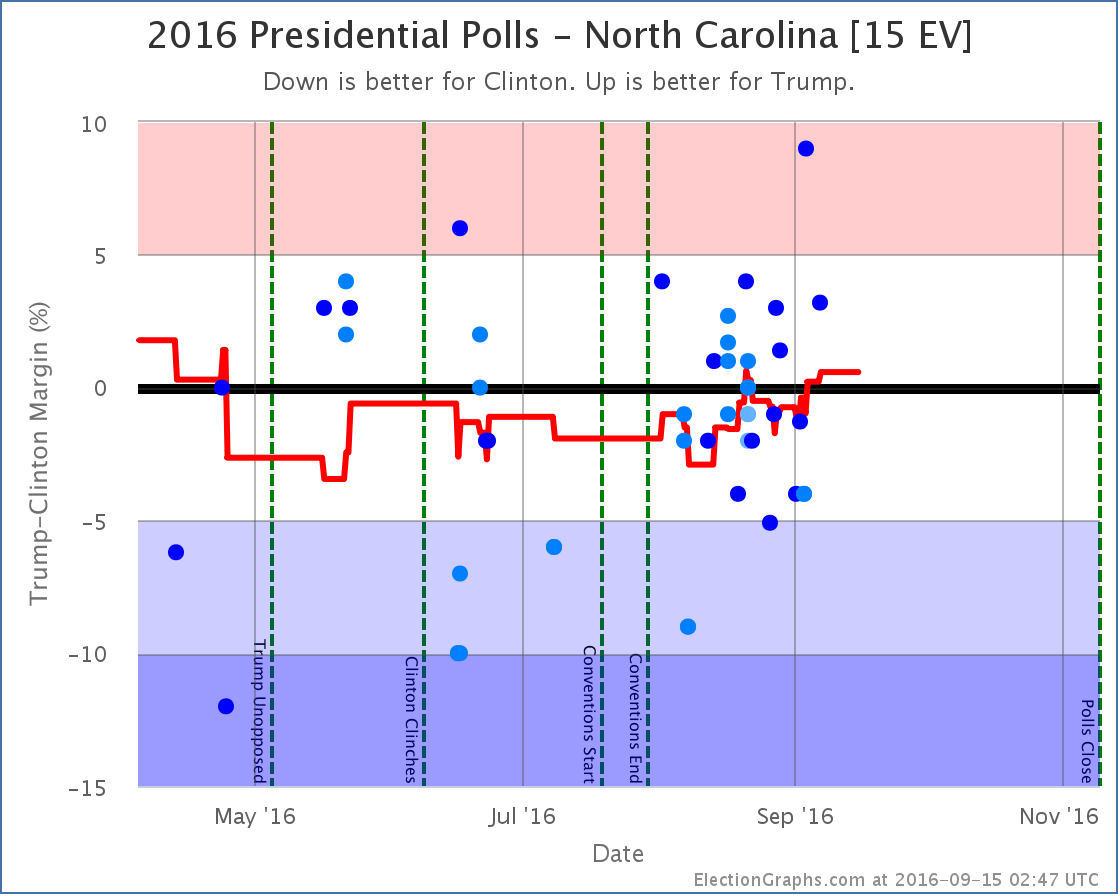
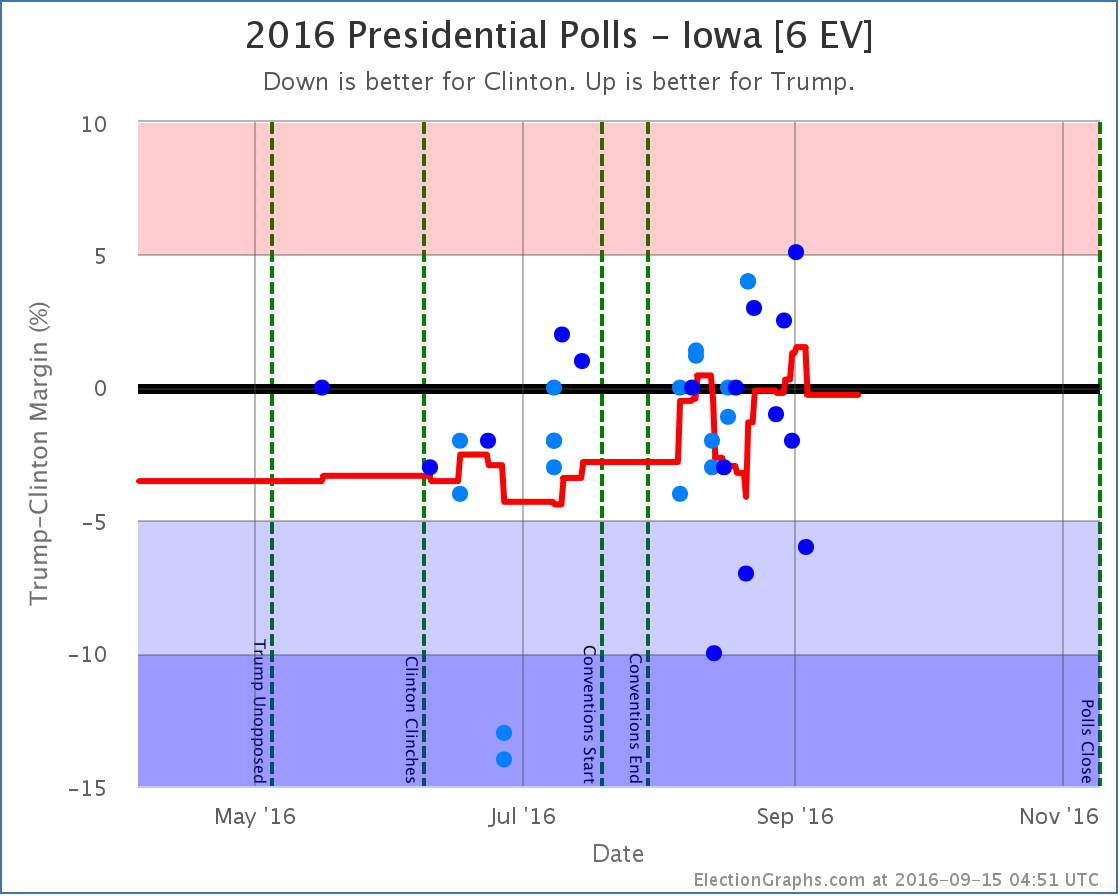
The averages in Florida, Ohio, and North Carolina all moved from Clinton to Trump. Iowa did move in the opposite direction, but it is much smaller, so the net change was dramatically toward Trump.
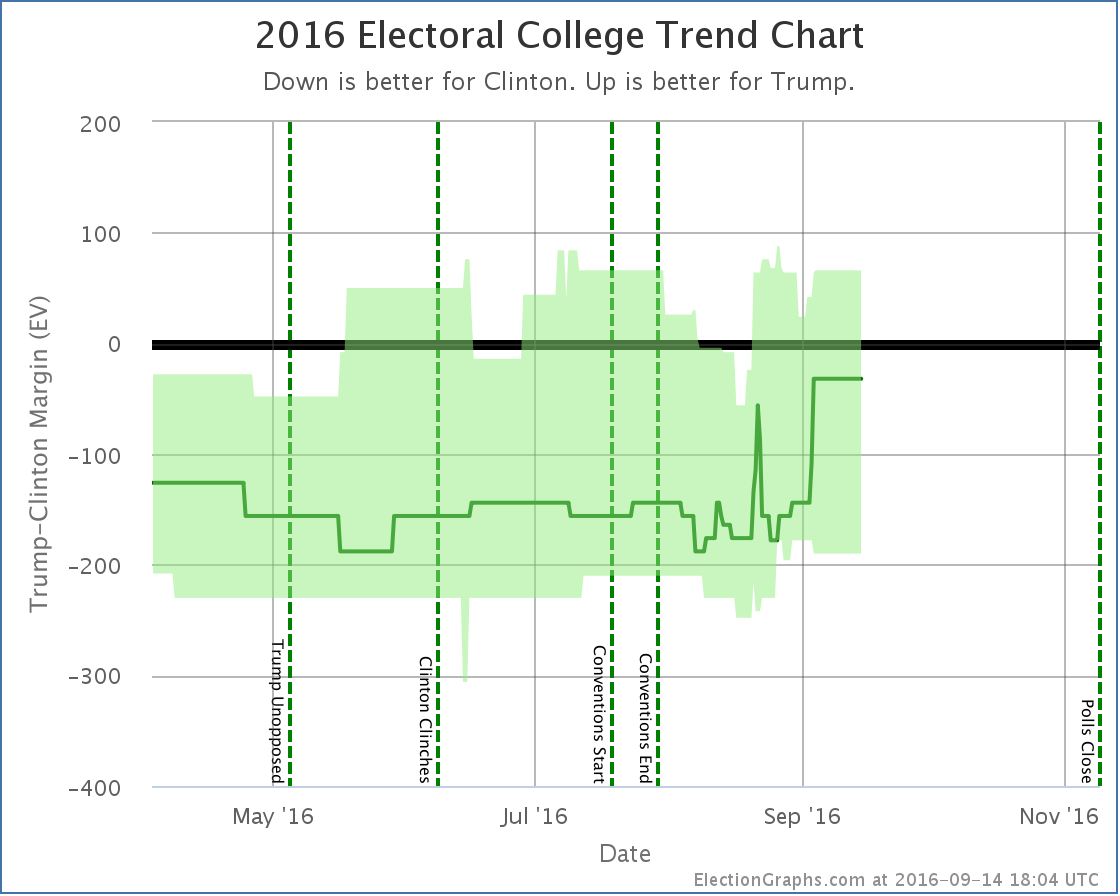
Before this batch of changes, the “expected” result if everybody won the states they lead was Clinton 341 to Trump 197… a 144 electoral vote win for Clinton.
With this batch of polls, the expected result is now Clinton 285 to Trump 253. This is still a Clinton win, but now by only 32 electoral votes.
From February onward this race had been stuck in the zone with Trump losing by margins between McCain’s loss (192 electoral votes) and Romney’s loss (126 electoral votes).
For the first time since February, Trump is now looking like he would do better than Romney did. Trump now matches Romney’s map, but adds Florida and Ohio. It isn’t quite enough to win, but Trump is now closer than he has ever been… and doing better than the last two Republican candidates.
Some folks were looking at Clinton’s lead in mid-August and were trumpeting the possibility of a Clinton landslide in early August. It was just looking like a solid win for Clinton back then, not a landslide, but things have actually moved in the opposite direction. A 32 electoral college win is more like a squeaker. It would only take Michigan flipping to get us to a 269 to 269 electoral college tie.
(There were also changes in the “best cases” from a lot of states moving in both directions. Trump’s best case went from winning by 68 electoral votes to winning by 66 electoral votes. Clinton’s best case went from winning by 210 electoral votes to winning by 190. So the overall range of possible outcomes reduced.)
Tipping Point
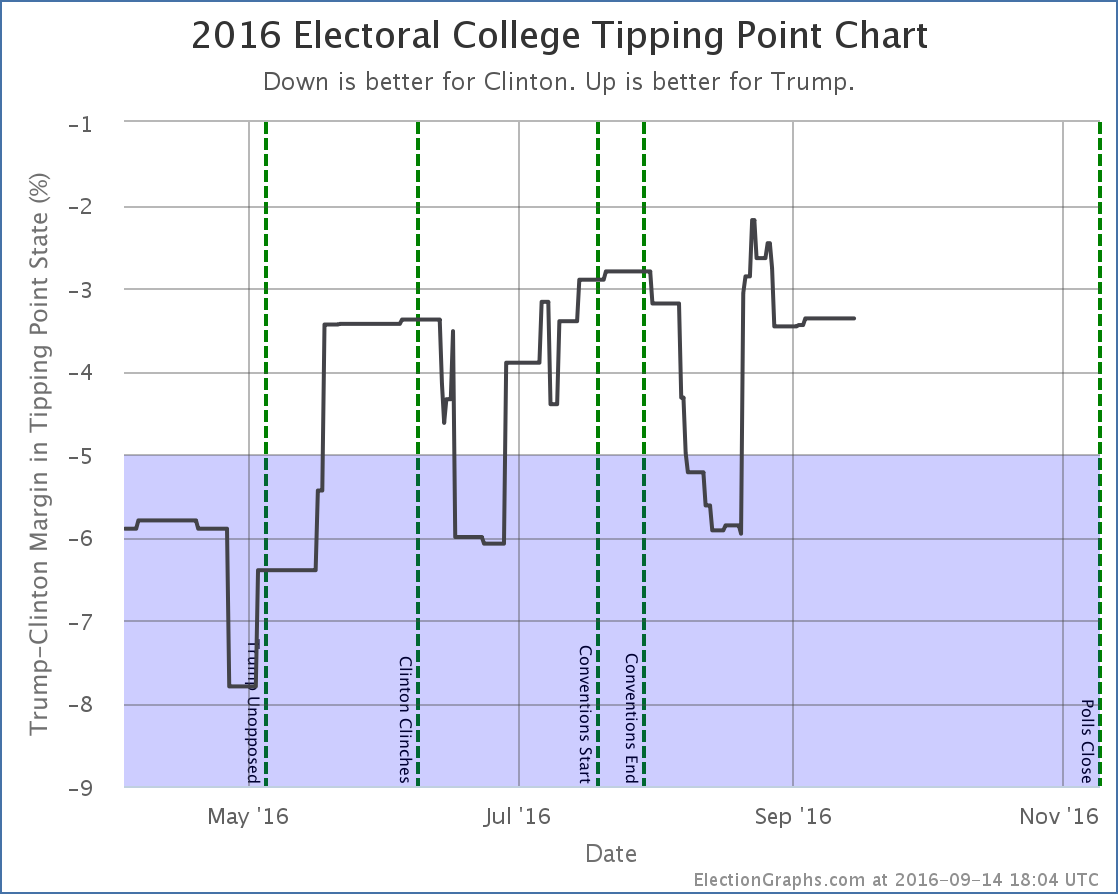
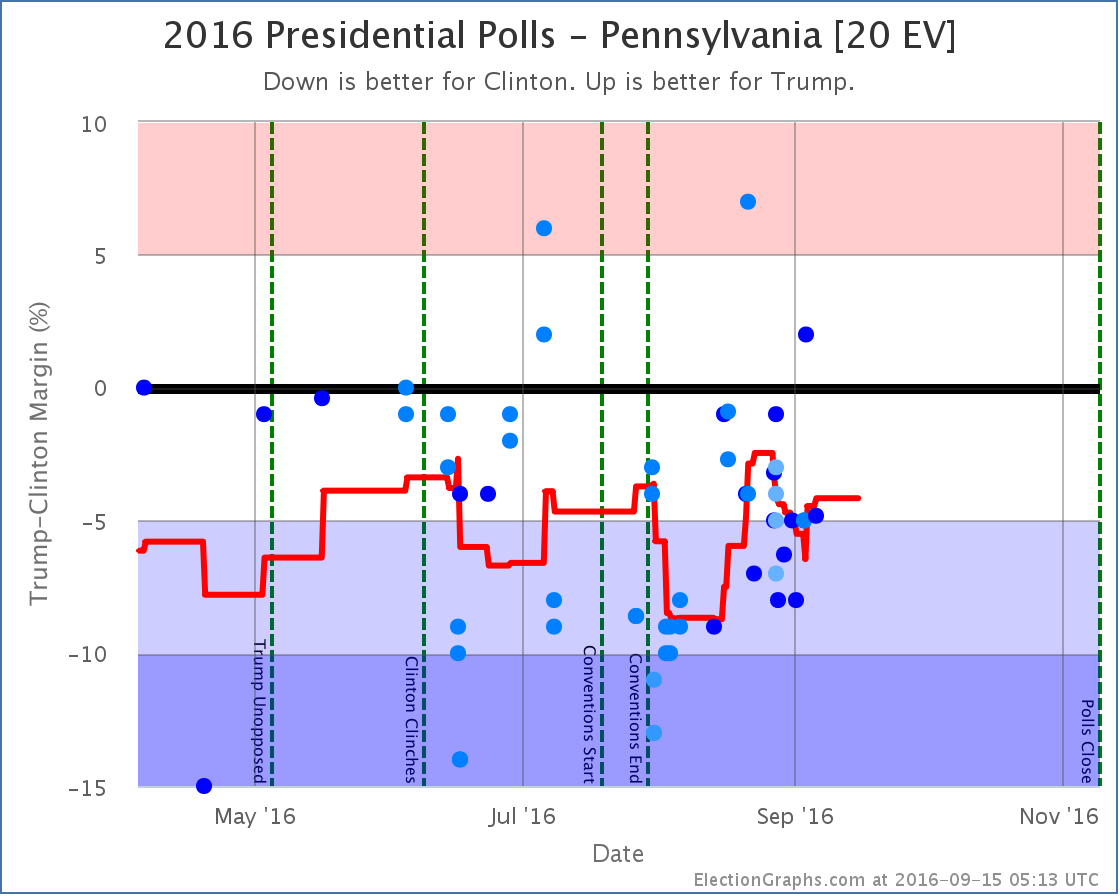
Now, despite the expected case moving in Trump’s direction, changes in Florida, Michigan, Wisconsin and Pennsylvania had the net effect of… zero. Well, to be precise the tipping point changed from a 3.4% Clinton lead in Florida to a 3.4% Clinton lead in Michigan. So the state that holds the balance shifted, but the actual percentage did not.
Looking at the trends though, rather than just the change in this update, while the expected case has clearly been moving in Trumps direction the last few weeks, the tipping point has been trending toward Clinton.
What does this mean?
At a basic level it means that while Trump has made the race closer, pulling over the next few states he needs to win is getting harder.
3.4% is still close, but if Trump is at or near his ceiling, it may be a tough last 3.4% to move.
To be absolutely clear, with all of the above Clinton is still a strong favorite. Trump has made it a lot closer than it was, but he still has a lot of work to do to pull the remaining states he would need past the line to secure an electoral college victory. It isn’t impossible. It is just very hard.
Individual States
OK, with the two national summaries out of the way, time for a run down of all the states that shifted in ways that caused changes to the expected or best cases. I’ll just do a run down of all the graphs without commentary on each one. For the most part they speak for themselves. Keep an eye out for the polls that look like outliers. In some cases if new polls don’t back those up, the changes described here may reverse themselves quickly as new polls come in.
States moving from Clinton to Trump:
States moving from Trump to Clinton:
States now in play for Trump:
States now in play for Clinton:
States no longer in play for Trump:
States no longer in play for Clinton:
What’s Next
This batch of polls was huge, so in the time it took me to complete it, there have already been a bunch of new polls which I will be adding as soon as I can. Even if those polls don’t change anything, there will be polls soon enough that do. This is a dynamic race, and as I post this we have 54.7 days left until we start getting the actual results. Hang on tight, we’re in for a nice ride before we are done.
Note: This post is an update based on the data on ElectionGraphs.com. Election Graphs tracks both a poll based estimate of the Electoral College and a numbers based look at the Delegate Races. All of the charts and graphs seen in this post are from that site. Additional graphs, charts and raw data can be found there. Follow @ElectionGraphs on Twitter or like Election Graphs on Facebook to see announcements of updates or to join the conversation. For those interested in individual general election poll updates, follow @ElecCollPolls on Twitter for all the polls as they are added. If you find the information in these posts interesting or useful, please consider visiting the tip jar.
[Update 07:16 UTC to add comment about outliers.]
[Updated 07:27 UTC to fix some awkward wording.]
States with new poll data since the last update: Florida, Illinois, Pennsylvania, New Hampshire, Ohio, North Carolina, Nevada, New York, Texas, California, New Jersey, Minnesota, Georgia, North Carolina, Indiana, Arizona, Missouri, Massachusetts, Virginia, Tennessee, Washington, Michigan, Wisconsin, Mississippi, Oklahoma, Idaho, Maryland, Oregon, Maine (All), Louisiana, Colorado, Iowa, Nebraska (All), South Carolina, Alabama, West Virginia, Kansas, Kentucky, Utah, Arkansas, Connecticut, Delaware, New Mexico, Montana, Alaska
Wow, that is a lot of new polls. While there were some others, the big influence today is that Reuters/Ipsos has started to do a weekly nationwide tracking poll where they provide state breakdowns for any state where they have enough data. So from now until the election we should start getting regular data on a lot of states that usually don’t get polled.
As usual, most of the updates didn’t change the status of the model, but a few did, and all of these moves this time were toward Trump. Lets take a look state by state:
Arizona [11 EV]
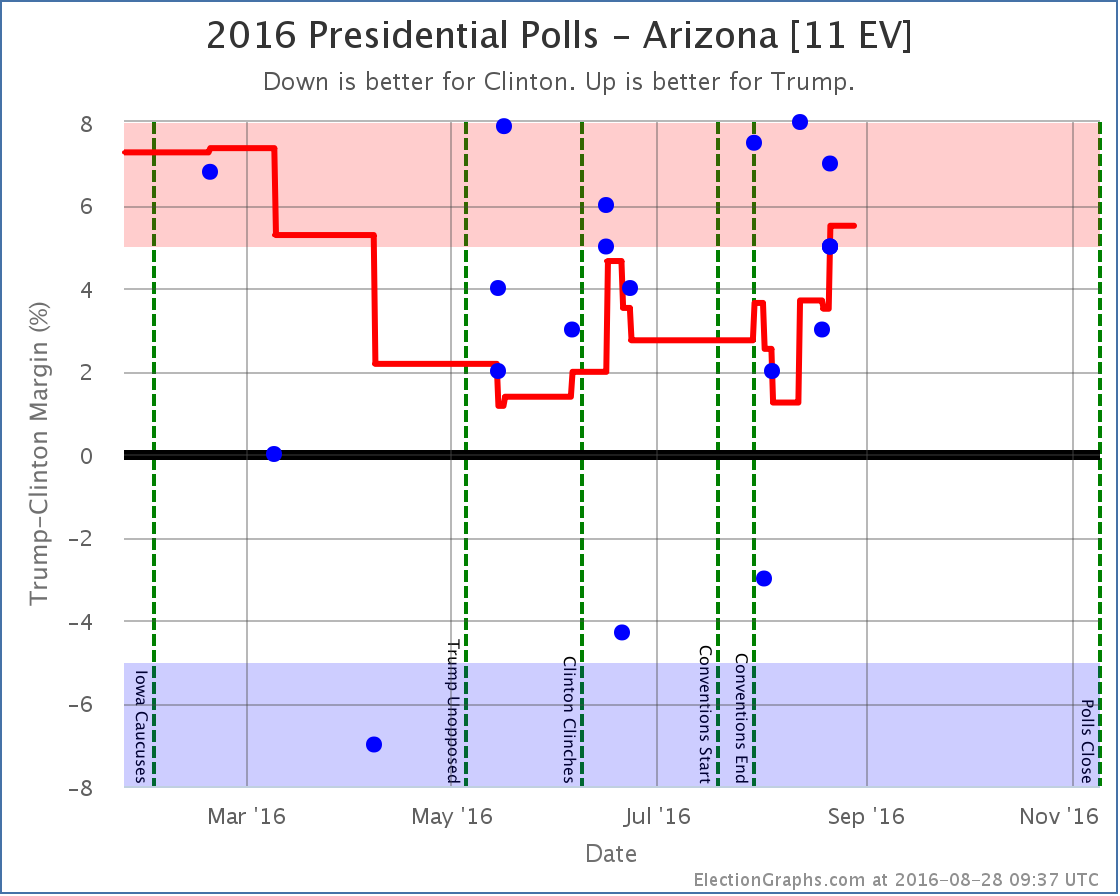
Ever since April Arizona has been looking like a possible target for Clinton… Trump ahead, but with only a narrow lead that Clinton might be able to flip. With the latest updates, Trump’s lead in the average increases to 5.5%, so we take it out of that category. The notion of a blue Arizona slips away from Clinton.
New Hampshire [4 EV]
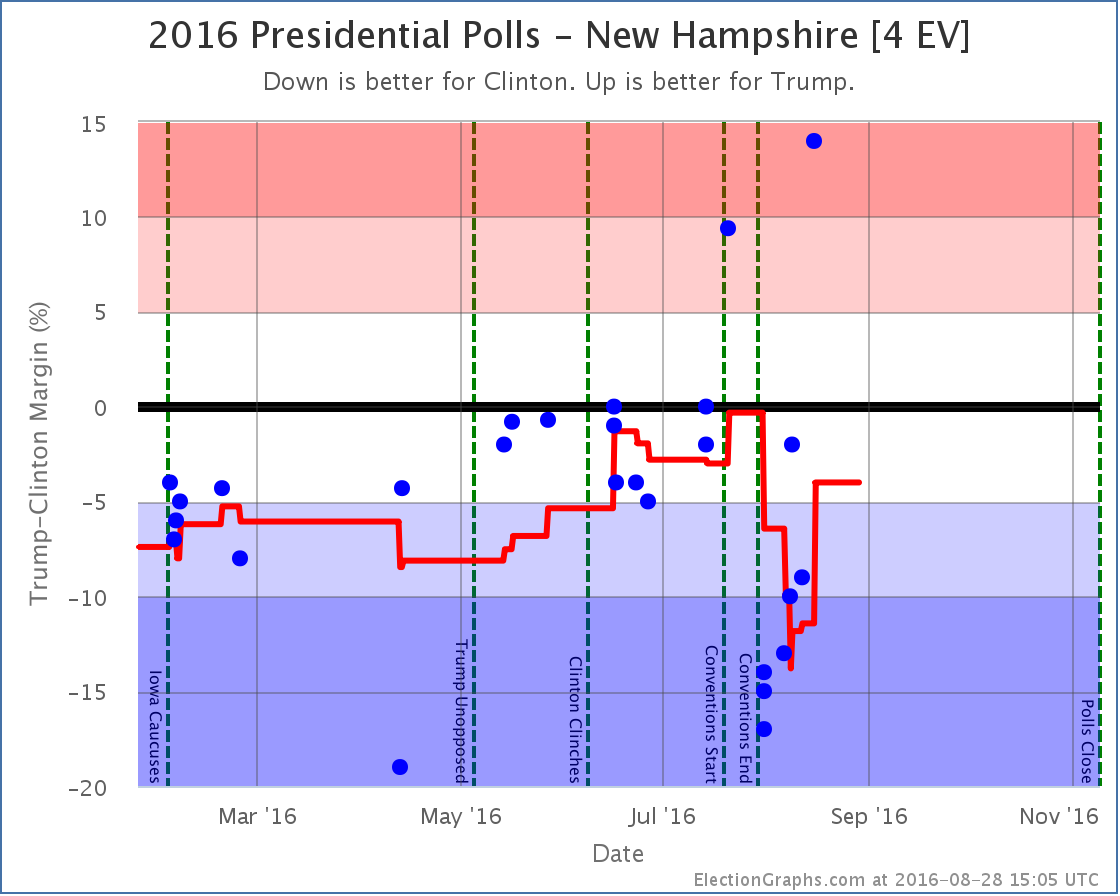
Honestly, it looks like an outlier, but the most recent of those Reuters/Ipsos results I mentioned show Trump with a huge 14% lead in New Hampshire. The second best number in the average shows Clinton up by 2%, and that is also from Ipsos. All the other recent numbers in New Hampshire show a Clinton lead of at least 9%, and there has been no radical change in the campaign that would indicate a huge swing would be expected.
If these two Ipsos data points are really outliers, then new polls should quickly show that. For the moment though, the average moves to only a 4.0% Clinton lead due to the two Ipsos data points, so New Hampshire is once again categorized as a state Trump has a chance in.
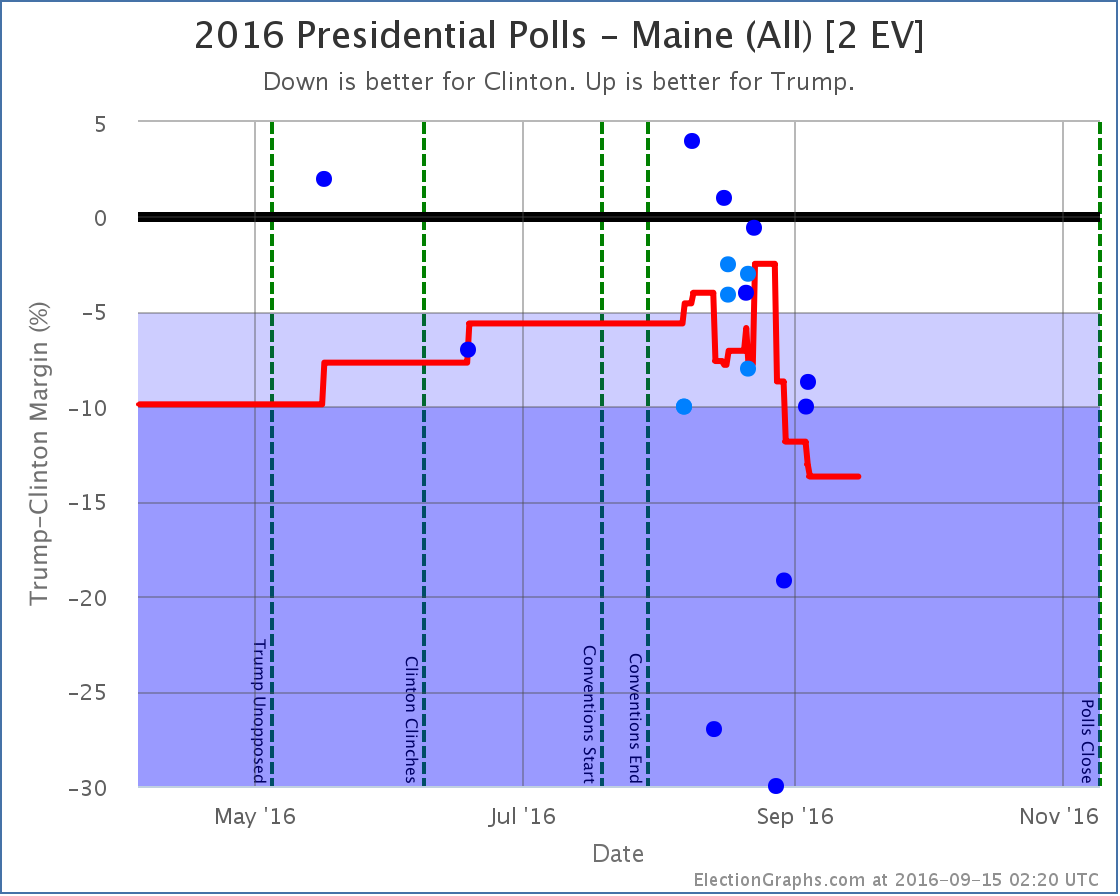
Maine (All) [2 EV]
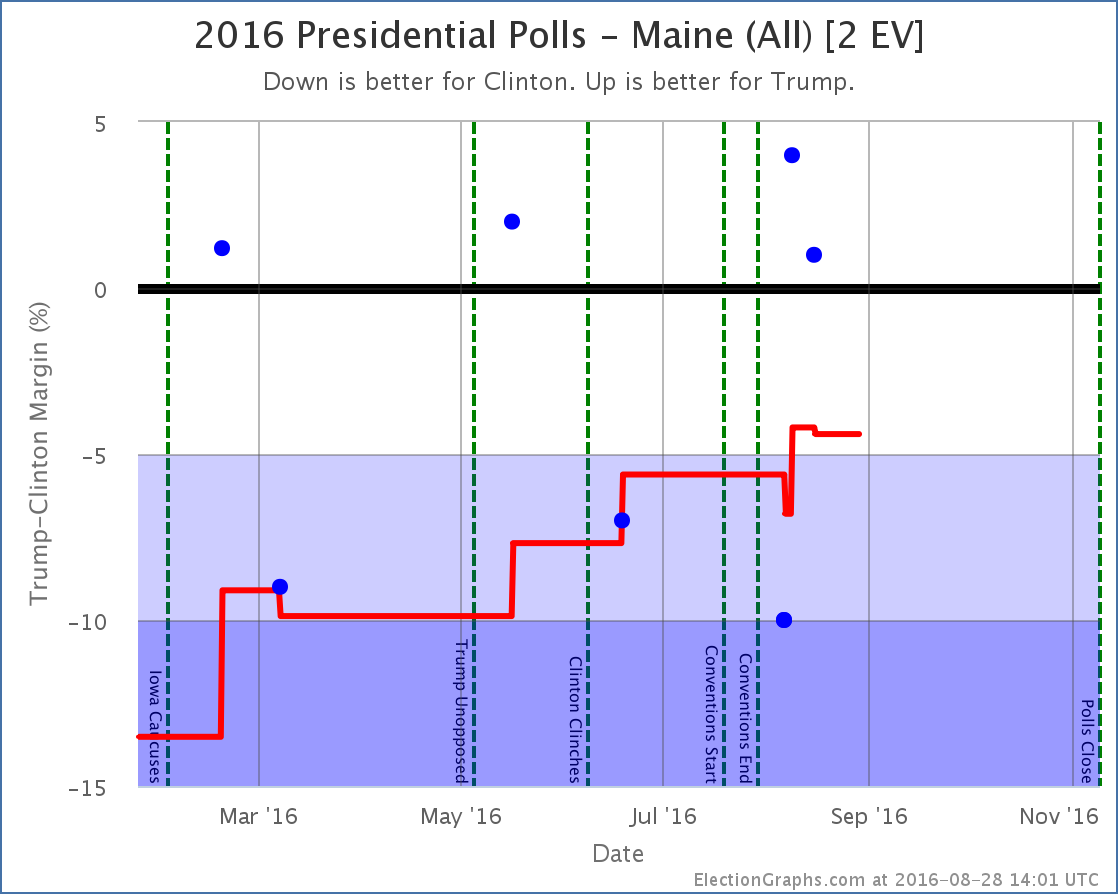
Maine has been pretty sparsely polled this Election cycle, but what polls we do have show the state trending away from being a solid blue state to being close. The latest couple of results (both Ipsos) have Trump ahead, as have a few previous polls. The average is now only a 4.4% Clinton lead, so Maine is now in the “Weak Clinton” category, and it is included in Trump’s best case.
Now, Maine is one of the two states that splits electoral votes. For winning Maine at large, you only get 2 electoral votes. You then get 1 electoral vote for winning each congressional district. Now, mathematically, for Maine as a whole to have a 4.4% lead for Clinton, Trump would have to be doing even better than that in one of the two congressional districts. But right now the average in CD-1 is a 15.8% Clinton lead and in CD-2 it is a 5.3% Clinton lead. That can’t be! You would expect CD-2 to be Weak Clinton as well, or possibly even Weak Trump.
The problem is that while there has been very limited polling of Maine as a whole, there has been even less polling of Maine at a Congressional District level. There has only been ONE poll of Maine CD-2 this election cycle. It was in June and showed Trump up by 1%. The average is 5.3% Clinton because in order to fill out the average when there are less than five polls, I use previous election results.
New polling in Maine CD-2 is currently what I classify as the “Most Needed Poll” (followed be NE-2, NE-1, ME-1 and SD). Right now we don’t have enough polling evidence to show that CD-2 is actually Weak Clinton or Weak Trump rather than Strong Clinton, but given where Maine as a whole is, the ME-2 electoral vote has to be a possible pick up for Trump too, but it won’t be categorized that way here until there are enough polls backing that up directly.
National View
Before showing the new national trend chart and tipping point charts, a quick note. In addition to the new polls added in the most recent batch, I found a handful of older polls that I had somehow missed earlier in the year. These don’t change the current picture, but they change the past. Specifically, Trump’s position in the spring was significantly weaker than it looked at the time, mainly because Florida would have slipped out of his reach significantly earlier.
To be transparent on this change, rather than just show the new charts, I’ll show the before and after due to today’s update. First the trend chart as it appeared on Election Graphs as of the August 26th update post:
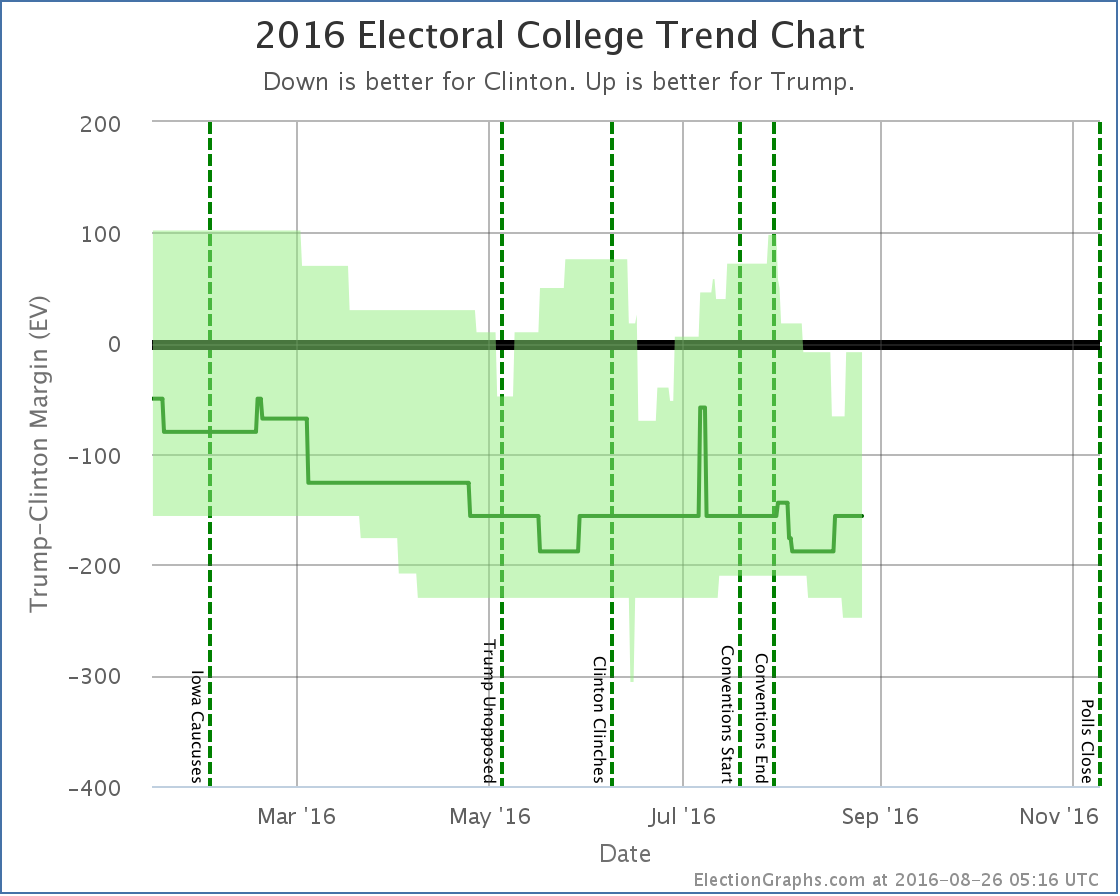
And here it is now:
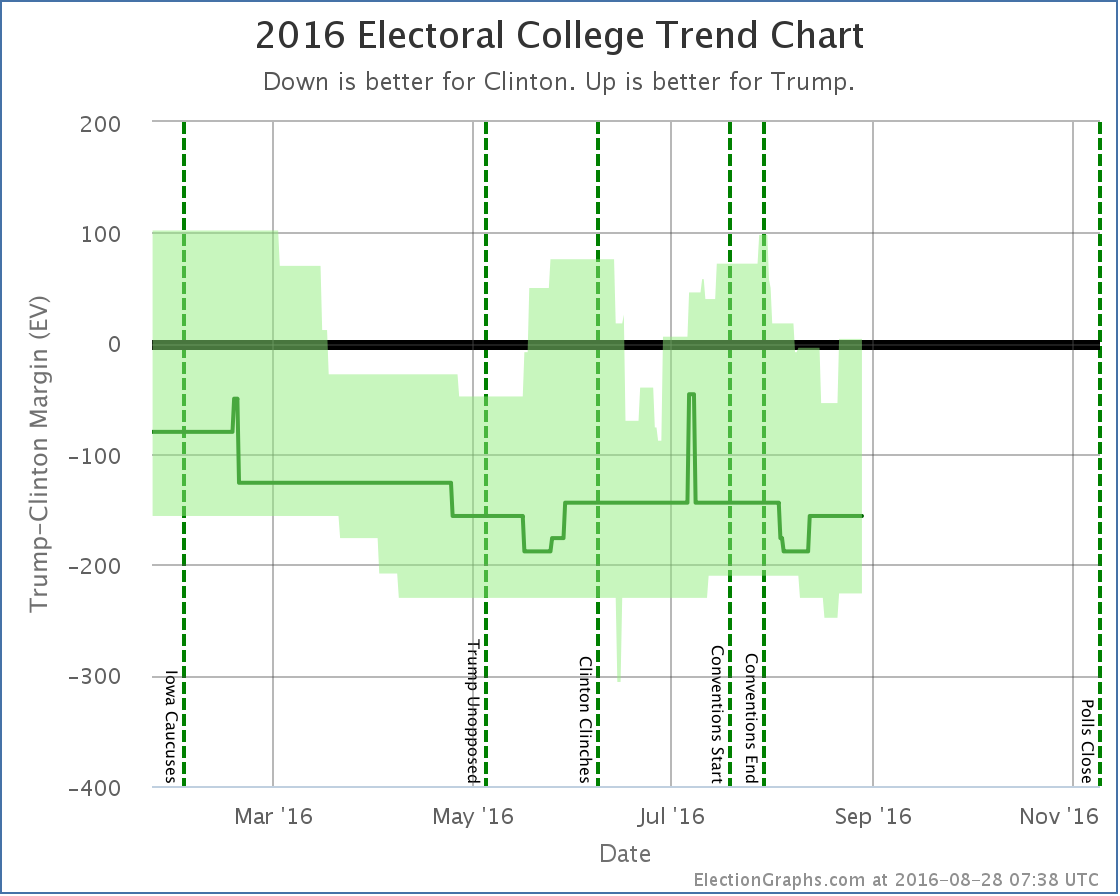
Note that in addition to the bumps upward in Clinton and Trump’s current best cases, Trump’s best case in the spring is significantly depressed, enough so that his best case moved from a narrow win in most of April to a narrow loss. There are some other subtle differences between these two caused by the addition of these old polls I had missed at the time, but that is the big one, caused essentially by one March poll in Florida that I did not see until August. Apologies for that.
The difference in the tipping point graph is even more dramatic, with Florida worse for Trump than it previously looked, there was a lot more room for the tipping point to wiggle, and it was a lot worse during the spring than it looked.
Here is the before picture of the tipping point graph from the August 26th update post:
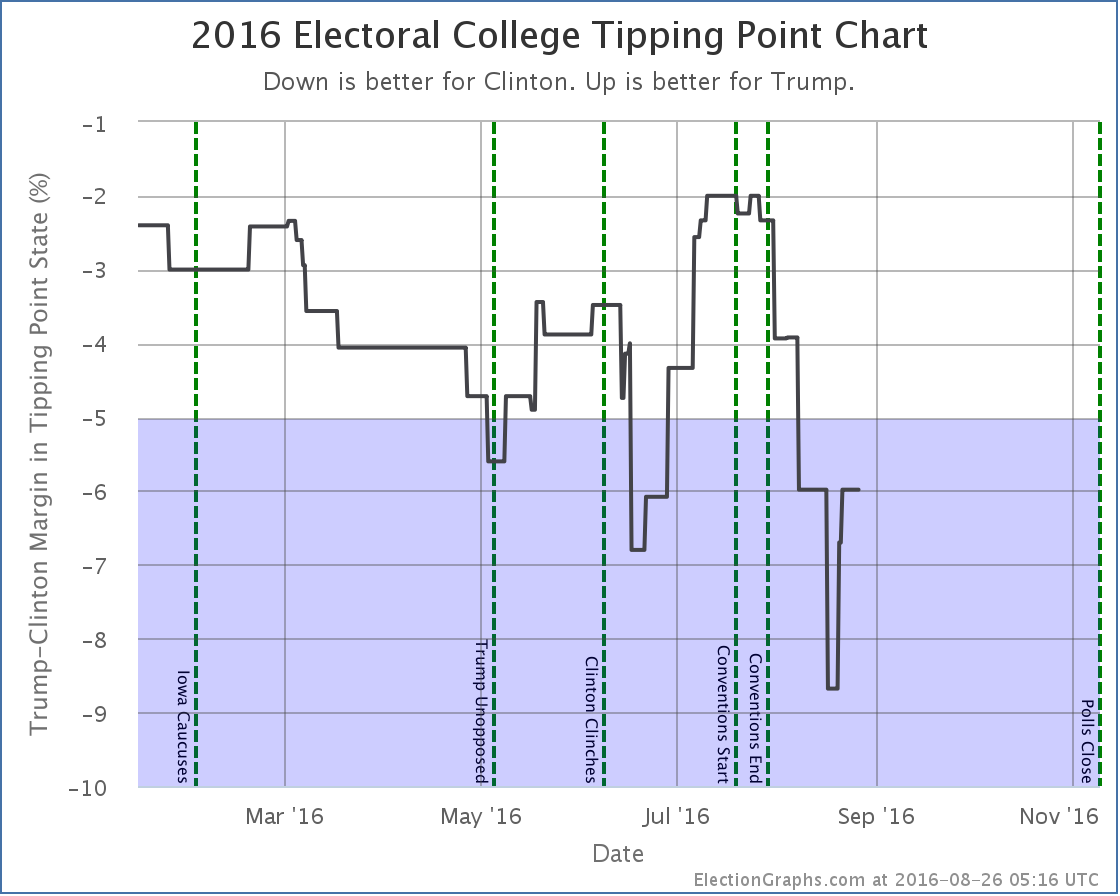
And here is the tipping point graph now:
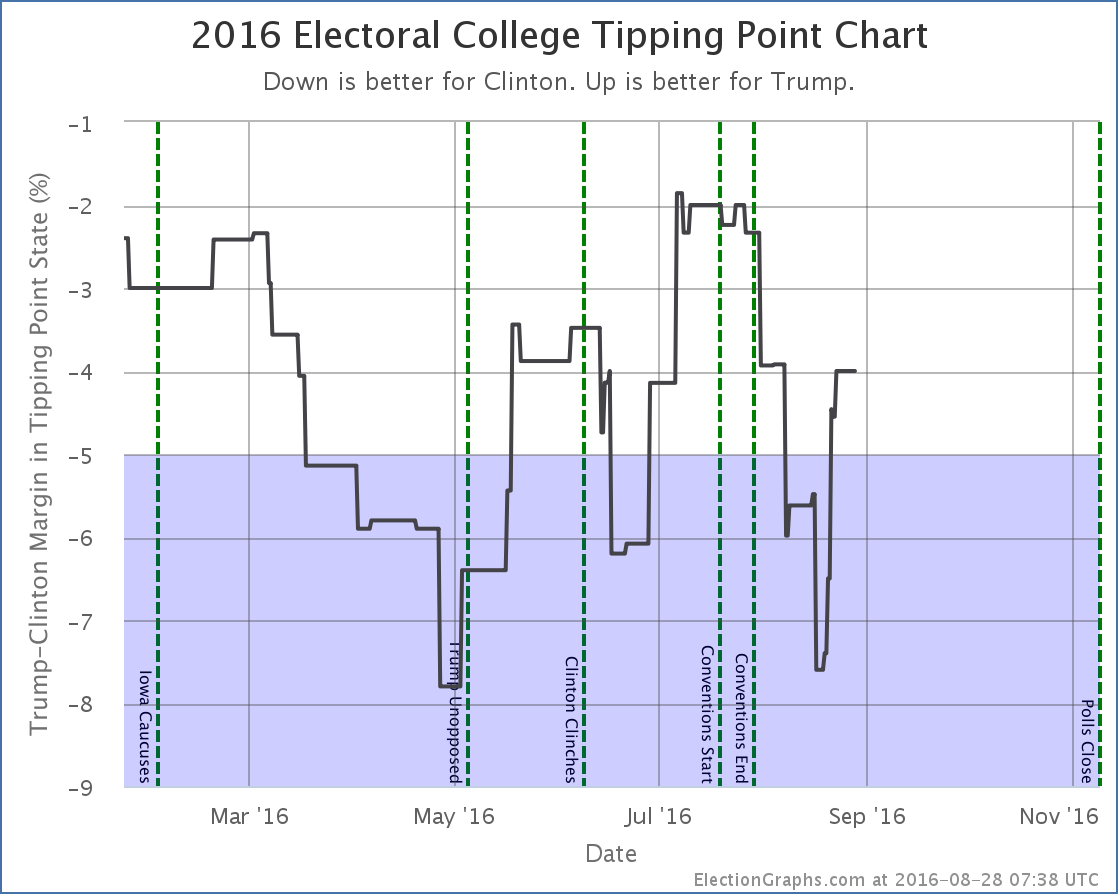
Again the main impact is that the “missing polls” that I added make it clear that Trump was significantly worse off in the spring than I had shown at the time. In fact, it means that at the end of April he was actually below his recent bottom in mid-August.
There were only a handful of polls missed, but this goes to show that even with poll averaging, individual polls in critical states can make a big difference in the overall picture. (Especially when they appear to be outliers, such as the one Florida poll I missed that made the biggest difference. Oops.)
OK, enough hand wringing about things that may have been missed in the spring.
The big current news on the tipping point is that with changes in the averages in Michigan, New Hampshire, and Ohio, the tipping point comes roaring back in Trump’s direction. In this update it moves from a 6.0% Clinton lead in Connecticut to a 4.0% Clinton lead in New Hampshire, but this is a full 3.6% swing toward Trump since his low of 7.6% about 10 days ago.
Now, everything above still shows a Trump loss, but it is looking a lot closer than it did a couple weeks ago. The first part of August was disastrous for Trump, but he has been bouncing back since then. He is still very far behind, but maybe his latest reworking of his campaign is working. His best case is once again to win, although by a very narrow 4 electoral vote margin.
Will the recent trend continue and make this race look even closer? 72.2 days left for him to do it.
Notice on Methodology: In my August 13th update I solicited opinions on possibly changing how this site deals with the case when a pollster releases multiple results from a single poll. See the discussion in that comment thread for more details. Immediately after this post goes live I will be working to change the site logic so that if two results are released from a poll, each counts as only half a poll for purposes of the averages here. Similar logic will apply to tracking polls where samples overlap, but not completely, with polls weighted to reflect the fraction of the new result that is actually from a fresh sample.
As examples of the impact this could have, the three states mentioned in this post would change as follows: Arizona is a 5.5% Trump lead (Strong Trump) with the current logic, it would be a 3.9% Trump lead (Weak Trump) with the new logic. New Hampshire would move from a 4.0% Clinton lead (Weak Clinton) to a 8.4% Clinton lead (Strong Clinton). Maine (All) would move from a 4.4% Clinton lead (Weak Clinton) to a 3.7% Clinton lead (Weak Clinton). With these three examples, two of the changes favor Clinton, and one favors Trump.
At this point I will not be adding new polls to the averages until the math changes are complete and I have reported on the results with a blog post. (Unless my revisions fail and I’m forced to reschedule for another weekend.)
[Note added 21:39 UTC – Actually, as I’m starting in, I realize that tracking polls have a bunch of extra complications that multiple results in a single poll don’t have, so I’ll leave them alone and treat them as if they were completely independent for now. Without weighting tracking polls, the changes above would now be: AZ Trump +5.5% -> Trump +3.1%, NH Clinton +4.0% -> Clinton +4.0% (No change), ME-All Clinton +4.4% -> Clinton +2.0%.]
Note: This post is an update based on the data on ElectionGraphs.com. Election Graphs tracks both a poll based estimate of the Electoral College and a numbers based look at the Delegate Races. All of the charts and graphs seen in this post are from that site. Additional graphs, charts and raw data can be found there. Follow @ElectionGraphs on Twitter or like Election Graphs on Facebook to see announcements of updates or to join the conversation. For those interested in individual general election poll updates, follow @ElecCollPolls on Twitter for all the polls as they are added. If you find the information in these posts interesting or useful, please consider visiting the tip jar.

So yesterday I said:
As I’ve cautioned before with Florida (and a couple other states), the state is close, the five poll average has bounced back and forth across the line repeatedly. The average today moves slightly to the Obama side of the line. But it could easily go back to the Romney side of the line tomorrow. There have been no moves that indicate Florida is moving definitively toward one candidate or the other. Absent such a move in the next few days, we’ll basically just need to wait for the actual vote count.
Florida did indeed flip back to just barely Romney in today’s update, and I’ll just let my quote from yesterday on that stand for today as well, with the names reversed.
For reference, the chart of polling in Florida shows the situation there quite clearly:

Updated map and summary:

|
Romney |
Obama |
| Romney Best Case |
321 |
217 |
| Current Status |
235 |
303 |
| Obama Best Case |
190 |
348 |
Goodbye to 332-206 for now. Perhaps we will see you again soon.
And now to the “Tipping Point Margin”:

This looks like Obama continuing to increase his lead in the tipping point, while the tipping point moves to Virginia. But… I urge caution… this is due almost entirely to what looks like a clear outlier in the Virginia polls that showed Obama up by 17% in Virginia! 17%! That outlier pushed Obama to a 3.5% lead in Virginia. But that new poll is way out of line with every other poll in the state. A 17% Obama lead in Virginia is simply not believable. (This was a registered voter result rather than a likely voter result, but still…)
I don’t manually remove outliers, but if you did, then Obama’s lead in Virginia drops back to 0.5%, which is probably closer to reality. If you did this, the tipping point state would still be Nevada rather than Virginia, and the margin in Nevada is still 3.2%. So the chart above is showing a 3.5% lead in the tipping point state (actually 3.46% before rounding) rather than 3.2%. That last little gain is an illusion due to the outlier. The outlier will wash away soon enough, in the mean time, this isn’t really that big a difference given the noise in this metric.
Either way, the picture has stayed consistent for the last few weeks. Obama has a slight lead in the electoral college as predicted by current polling, and that lead seems to generally be getting more solid. But that lead is still by no means secure. A 3.5% (or 3.2%) lead in the tipping point state is much more solid than the 1.0% lead Obama had on October 10th.
But 3.5% is also not all that secure. A 3.5% lead could disappear in a day or two with a bad news cycle for Obama. That seems less likely as we get closer, but it is still quite clearly not impossible. And as Romney supporters have been particularly fond of pointing out lately, there is also the possibility of systematic error in the polling, even when you average across many pollsters. It has happened before (most recently in the 1996 Clinton/Dole race), and it will happen again. Maybe it will be this year.
If there are no major changes in the few remaining days before the election, we go into the election with Obama a heavy favorite, but with a Romney upset a long shot, but still within the realm of reasonable possibility… which is where we have been most of the last year.
Note: Eight hours or so between my daily poll sweep and the blog post today. Polls released during that time period will of course be included in tomorrow’s update.
Note: Chart and map from the Abulsme.com 2012 Electoral College Prediction page. Both assume Obama vs Romney with no strong third party candidate and show polling as it currently exists. Things will change before election day. On the map red is Romney, blue is Obama, gold states are too close to call. Lines on the chart represent how many more electoral votes a candidate would have than is needed to tie under several different scenarios. Up is good for Obama, Down is good for Romney.

One state changes categories today. It is Florida.

As I’ve cautioned before with Florida (and a couple other states), the state is close, the five poll average has bounced back and forth across the line repeatedly. The average today moves slightly to the Obama side of the line. But it could easily go back to the Romney side of the line tomorrow. There have been no moves that indicate Florida is moving definitively toward one candidate or the other. Absent such a move in the next few days, we’ll basically just need to wait for the actual vote count.
So, new map and summary:

|
Romney |
Obama |
| Romney Best Case |
321 |
217 |
| Current Status |
206 |
332 |
| Obama Best Case |
190 |
348 |
Hello old friend, it is nice to see you again! Once again we have a 332-206 Obama victory, which is where the “Current Status” line has been more often than anywhere else all year long. There have been moves above this, and moves below this, but so far, things have always come back here. I guess we’ll see if that holds through election day.
Once again though, lets dig deeper. Winning is possible for Romney here. But just how far away is he? Lets look again at the “Tipping Point Margin” chart I debuted yesterday:

What looked like a slight trend in Obama’s direction looks more significant today. With today’s update Obama’s lead in Ohio increased to 3.3%. This actually moved Ohio past Nevada, where Obama’s margin is now 3.2%. This makes Nevada the new “tipping point state”. Romney’s easiest path to victory is now holding on to all the areas he is ahead in, then erasing Obama’s advantage and taking the lead in Virginia (13 ev, 0.9% Obama lead), Florida (27 ev, 1.0% Obama lead), Iowa (6 ev, 1.2% Obama lead), Colorado (9 ev, 2.0% Obama lead), New Hampshire (4 ev, 2.2% Obama lead) and then Nevada (6 ev, 3.2% Obama lead).
Ohio may well return to the tipping point position tomorrow, but for now that is where we are.
The tipping point margin is a metric that looks pretty noisy over the past few weeks, so I would urge caution reading much into individual daily ups and downs. A lot of that is just going to be statistical noise. However, this represents the best margin in the tipping point state Obama has seen since October 7th in the midst of his downward plunge after the first debate. The upward trend in this measure of the state of the race is now looking more clear.
Tick tock. The time left for Romney to make a move in the polls is diminishing quickly. Will something gain traction? If not, then Romney’s main remaining hope is that all the polls, not just those from Democratic leaning pollsters, but all of them, are actually wrong and are systematically tilting toward Obama. This is not impossible, and along with the possibility of a last minute event that changes things, is likely a big part of why sites like 538 give Romney a 20%+ chance of winning. Views of this using just the raw polling data, like that done by Darryl at horsesass.org give a much lower chance of a Romney victory.
But then there is Sandy. Michael, A commenter on yesterday’s update, brought up the possibility of reduced voter turnout in areas of Pennsylvania affected by Hurricane Sandy making the state winnable for Romney. Unlike potential effects on popular opinion of Obama due to how he responds to the hurricane, turnout effects due to the storm may simply not be measurable by the polls. First of all, the degree to which any remaining issues from the storm may impact voting on Tuesday may not be clear until almost Tuesday. Second, because people in effected areas are busy dealing with the storm impact itself, they may be more reluctant to participate in polls, and some pollsters may not even bother trying.
Now, most people seem to think that the effects of the storm on actual voting next Tuesday will be minimal, as most services will have been restored by then, etc. But for argument’s sake, lets imagine that turnout in the Philadelphia area is significantly reduced, giving Pennsylvania to Romney despite Obama’s 4.6% lead in current polling. Let’s also give Virginia to Romney on the same basis… reduced turnout in Northern Virginia breaking what is essentially a tie in Virginia at the moment, and giving the state to Romney.
With those two states as well as the states he is already ahead in, we have Romney with 239 electoral votes. That is still 30 electoral votes short. If we start adding states in again based on how close Romney is… Florida… which is essentially tied right now… brings Romney to 268 electoral votes. Just one electoral vote short of a tie. Iowa would then be the tipping point state. With it’s 6 electoral votes, Romney would win 274 to 264. Romney is currently behind in Iowa by only 1.2% in my five poll average. (Only 2 of those 5 polls were concluded after the last presidential debate, and those last polls look better for Obama, but lets call it 1.2% for now.)
If Hurricane Sandy was indeed able to deliver Pennsylvania and Virginia for Romney, Obama would STILL be ahead… but it would be a LOT closer!
For the moment though, as long as that scenario does not develop, Obama’s position seems to be better now than it has been in weeks. He is increasing his lead in Ohio and other swing states. Even if you grant some movement toward Romney in Pennsylvania and Virginia that isn’t visible in the polls, it seems like Romney still needs something else to move things in his direction.
Before the hurricane, Romney’s camp seemed to be trying (but failing, at least in the critical states) to gain traction based on the Obama administration’s handling of the attacks in Benghazi on September 11th. Maybe a renewed push on that issue in the remaining days will do the trick? The Romney campaign has also been pushing hard in Ohio with an attack implying Obama’s policies are resulting in Jeep moving jobs from Ohio to China. Fact checkers have called these claims misleading at best, but that doesn’t necessarily stop the attack from being effective. Maybe that will start reversing the polling trend in Ohio? Or will there be some new event that moves things dramatically toward Romney?
Watch this space in the next few days. We’ll find out… :-)
(And of course, Romney’s apparent lead in national polls continues… so if the polling is correct and nothing changes before election day, the possibility of Romney winning the popular vote while losing the electoral college remains very strong.)
Note: I actually finished my daily sweep of the polls about 10-11 hours prior to making this blog post. I usually try to keep that gap shorter, but it is what it is. There have of course been new polls released in that time. Those will be included in tomorrow’s update.
Note: Chart and map from the Abulsme.com 2012 Electoral College Prediction page. Both assume Obama vs Romney with no strong third party candidate and show polling as it currently exists. Things will change before election day. On the map red is Romney, blue is Obama, gold states are too close to call. Lines on the chart represent how many more electoral votes a candidate would have than is needed to tie under several different scenarios. Up is good for Obama, Down is good for Romney.

Minor change on the edges as New Mexico once again drops below a 10% Obama lead:

A few days ago Obama’s lead in the five poll average in New Mexico moved slightly above 10%, today a new poll pulls it back down to just below 10%. Either way, Obama will win New Mexico. So lets quickly move on so we can get to the good new stuff. First of all, new map and summary:

|
Romney |
Obama |
| Romney Best Case |
321 |
217 |
| Current Status |
235 |
303 |
| Obama Best Case |
190 |
348 |
While New Mexico is colored lighter blue on the map, the summary is unchanged from yesterday, since New Mexico wasn’t moving in or out of “swing state” status.
Since we still have a contest where Romney could win if he swept all the swing states, lets again look internally at how the polls stack up within the swing states, but rather than me listing the current margins in each of the swing states as I have done before, we’ll cut to the chase, and look at the “spiffy graph” I promised on Saturday. Graph first, then explaination:

OK, in my recent posts I’ve listed the swing states, listed their margins, and then mentioned which states Romney would need to win if he took them “in order” by how well he is doing in the state. When you do this, one state would put Romney over the top. I then looked at the margin in that “Tipping Point” state. In other words, if Romney improved his margin by the same percentage across the board in all states (or at least all the swing states) how much better would he need to be doing in order to actually win enough of those states to win the electoral college?
I base these margins off my five poll average rather than something more sophisticated, but the general concept of this is similar to Sam Wang’s “meta-margin” at the Princeton Election Consortium. It shows another way of looking at the race, and one which gives a closer look at who is ahead and by how much than simply looking at the three model lines I usually present. With the three lines I normally present you can tell who is ahead and that it is relatively close, but it is hard to get a sense of exactly how FAR ahead the candidate in the lead is when it is “close”.
So anyway, what does this show? Well, basically the same trends we see in Romney’s Best case line and the current line. Namely, the first part of October Obama was in free fall, but that stopped around the time of the VP debate, and since then there has been a pretty noisy signal, but with a slight trend toward Obama. If you are generous to Romney, you can say that the trend has been flat since the VP debate, but any argument that there has been continuing Romney momentum is clearly false.
The “tipping point state” has almost always been Ohio, with a few days here and there when polling moved states slightly out of their normal order. But be it Ohio, or occasionally Florida, Virginia or Nevada, Obama’s lead in the tipping point state has been staying in a fairly consistent band between 1% and 3% for the past three weeks.
Obama is no longer in the comfortable territory he was in before the 1st debate, where Romney would have to move the tipping point states by more than 5% to win… a state I described before as Romney’s best case being to lose. But he has a buffer there, and, so far at least, the key tipping point states are not showing the moment Romney would need in order to win.
Now, if something were to happen to induce a move as large as the decline Obama had at the beginning of October, then yes, that would potentially still be enough to flip the race. As I type these words though, there are 7 days and 55 minutes until the first polls close on election day. There is very little time left for a last minute change large enough to flip this to Romney.
It could happen, it is just becoming a bigger and bigger stretch with every day that goes by that does not move things dramatically in Romney’s direction.
Meanwhile of course, even while NO electoral college model that I’ve seen has put Romney ahead at ANY time in the past year, all the aggregators of national polls have shown Romney ahead for almost all of the last three weeks, and that lead continues today. If nothing happens to shake things up in the next seven days, the prospect of an electoral college / popular vote split seems to get more likely by the day.
Note: Chart and map from the Abulsme.com 2012 Electoral College Prediction page. Both assume Obama vs Romney with no strong third party candidate and show polling as it currently exists. Things will change before election day. On the map red is Romney, blue is Obama, gold states are too close to call. Lines on the chart represent how many more electoral votes a candidate would have than is needed to tie under several different scenarios. Up is good for Obama, Down is good for Romney.
Edit 2012 Oct 30 22:43 UTC to fix some wording issues.
Edit 2012 Oct 30 23:19 UTC to fix typo.
|
|


