This week on Curmudgeon’s Corner… lightning rounds! Sam and Ivan talk about a total of 17 different topics this time around. These include… the snow in Seattle, Roger Stone, the Green New Deal, Paul Manafort, a correction to something Sam said last week, food delivery, translating Trump into other languages, the National Emergency, an upcoming Seattle Curmudgeon’s Corner meetup, and of course eight other things too. Enjoy!
Click below to listen and subscribe!
1-Click Subscribe in iTunes View Podcast in iTunes View Raw Podcast Feed Download MP3 File Follow the podcast on Facebook Support us on Patreon
Show Details:
Recorded 2019-02-16 Length this week – 2:40:00
(0:00:20-0:28:09) But First
Trump translations
Agenda
Curmudgeon’s Corner Seattle meetup
Correction about Tucson
Seattle snow
Food delivery
(0:29:53-1:10:31) Lightning Round I
Ivan: Glenn Greenwald
Sam: Book: The Zimmerman Telegram (1985)
Ivan: Movie: Geostorm (2017)
Sam: Green New Deal
(1:12:32-2:04:20) Lightning Round II
Ivan: Paper Bank Statements
Sam: Doing a “Clinton Email”
Ivan: Manafort
Sam: Stone
(2:05:29-2:39:42) Lightning Round III
Ivan: National Emergency
Sam: Bill Weld 2020
Ivan: McCabe and the 25th
Sam: Democratic debate rules
The Curmudgeon’s Corner theme music is generously provided by Ray Lynch.
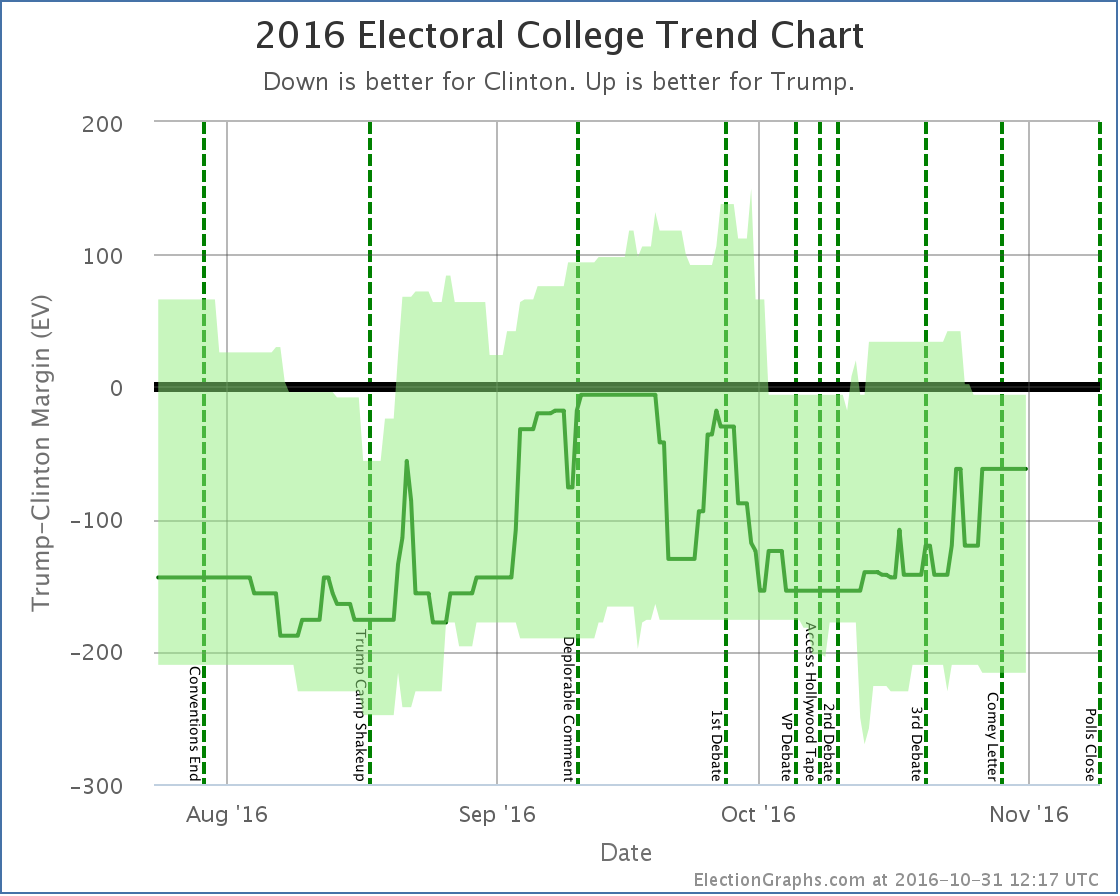
It has been about five days since the last update. Since then the movement has been decidedly mixed.
Note that as of this update, no polls have been included that contain interviews done after the release of the “Comey Letter”.
Good for Trump:
The expected result has moved from a 130 EV Clinton win to only a 62 EV Clinton win
Clinton’s best case has declined from a 234 EV win to only a 216 EV win
Good for Clinton:
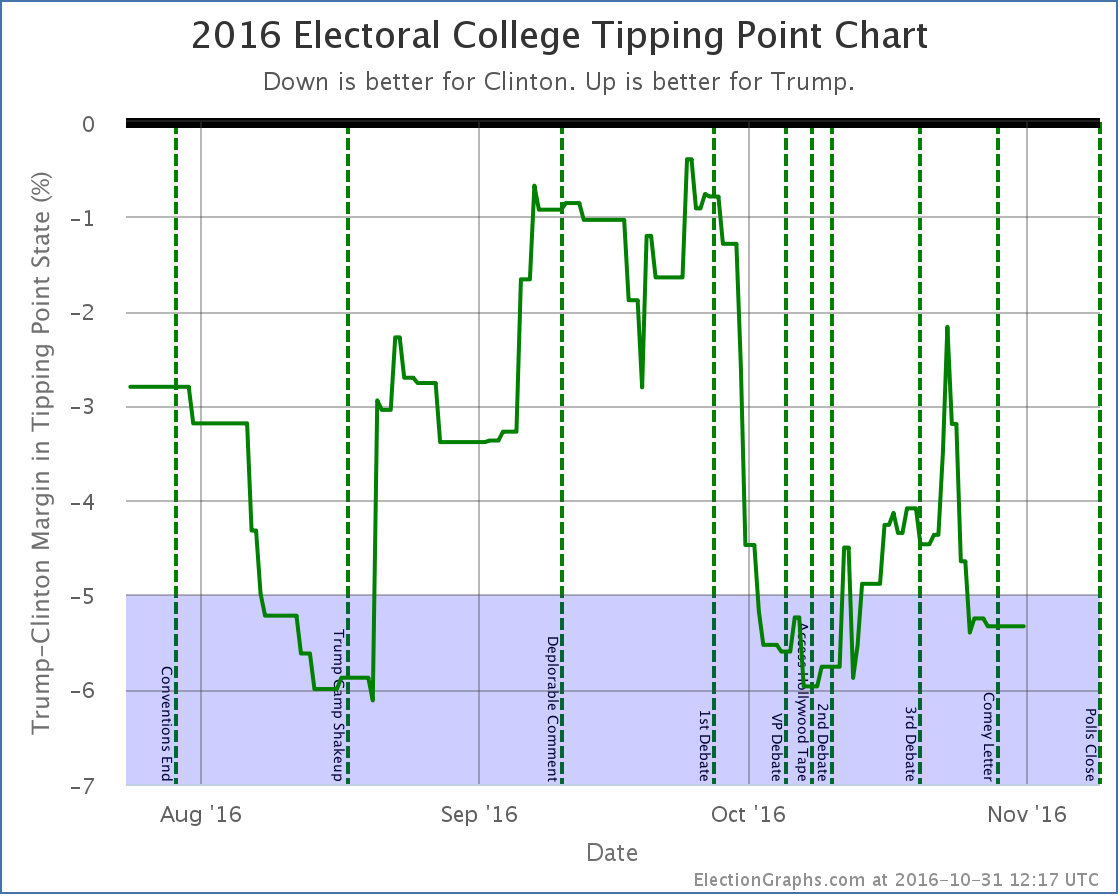
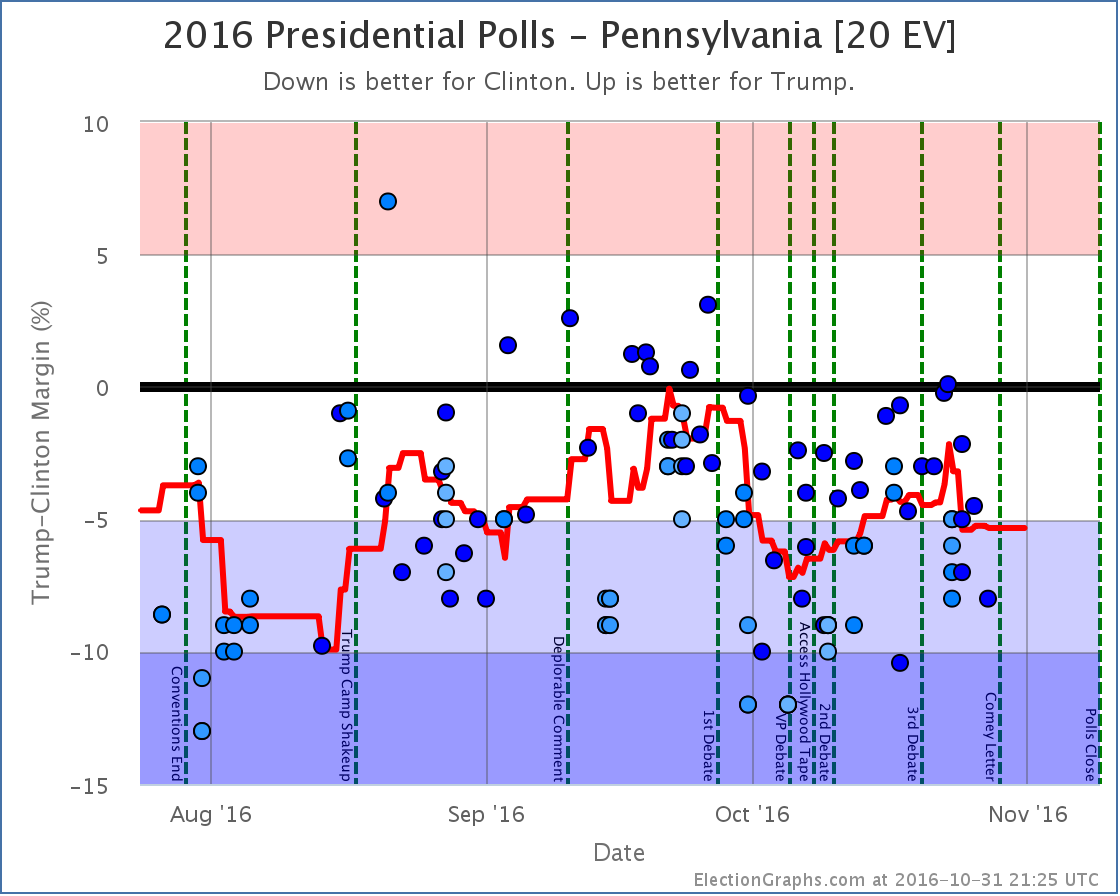
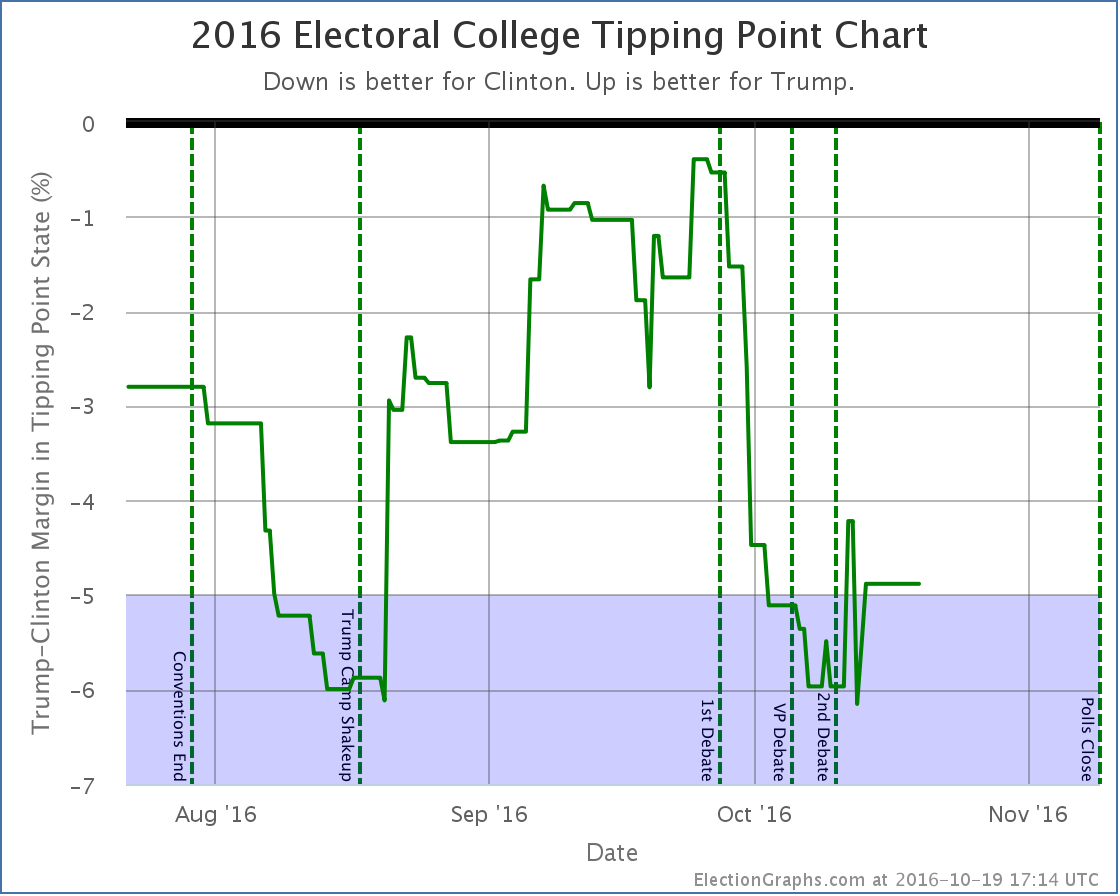
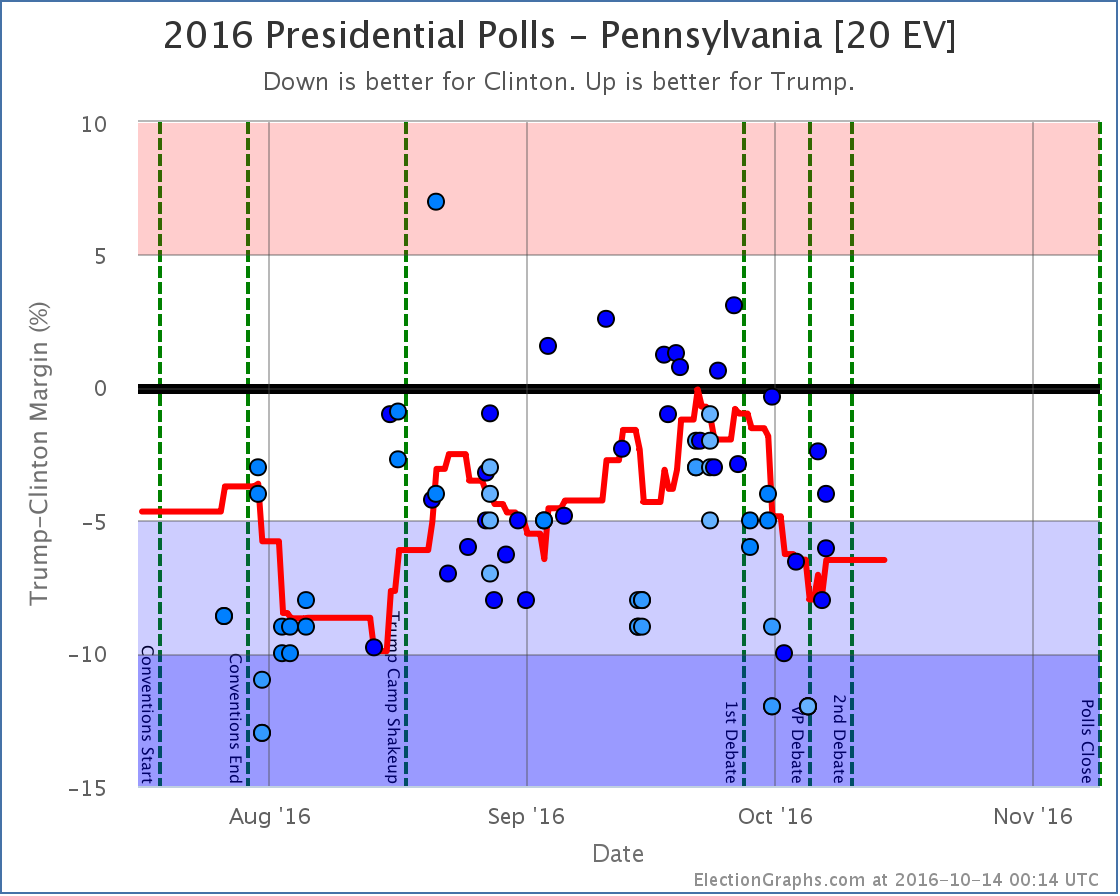
The tipping point moves from Clinton by 4.1% in PA to Clinton by 5.3% in PA
Trump’s best case declines from a 34 EV win to a 6 EV loss
Charts
Discussion
While some metrics have moved in Trump’s direction and others in Clinton’s, in the end this picture is bad news for Trump. Why is that? Fundamentally, doesn’t the fact that the “expected case” moved toward Trump mean that he is doing better?
Well, it means the margin he will lose by is getting smaller, yes. However, if you are trying to look for scenarios where Trump would actually catch up and win, the tipping point is what you want to be looking at. To win he has to move the tipping point state (or states he is even further behind in) over to his side of the line. And the tipping point is moving further away at the moment.
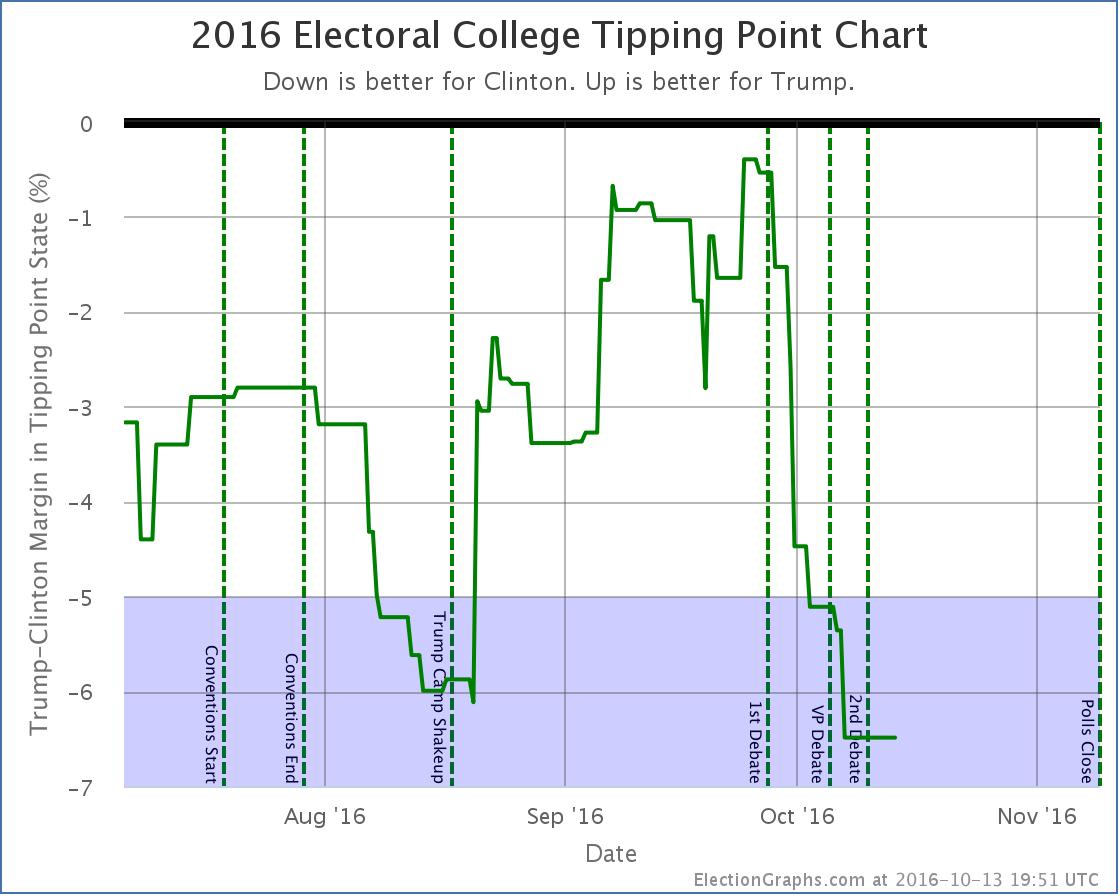
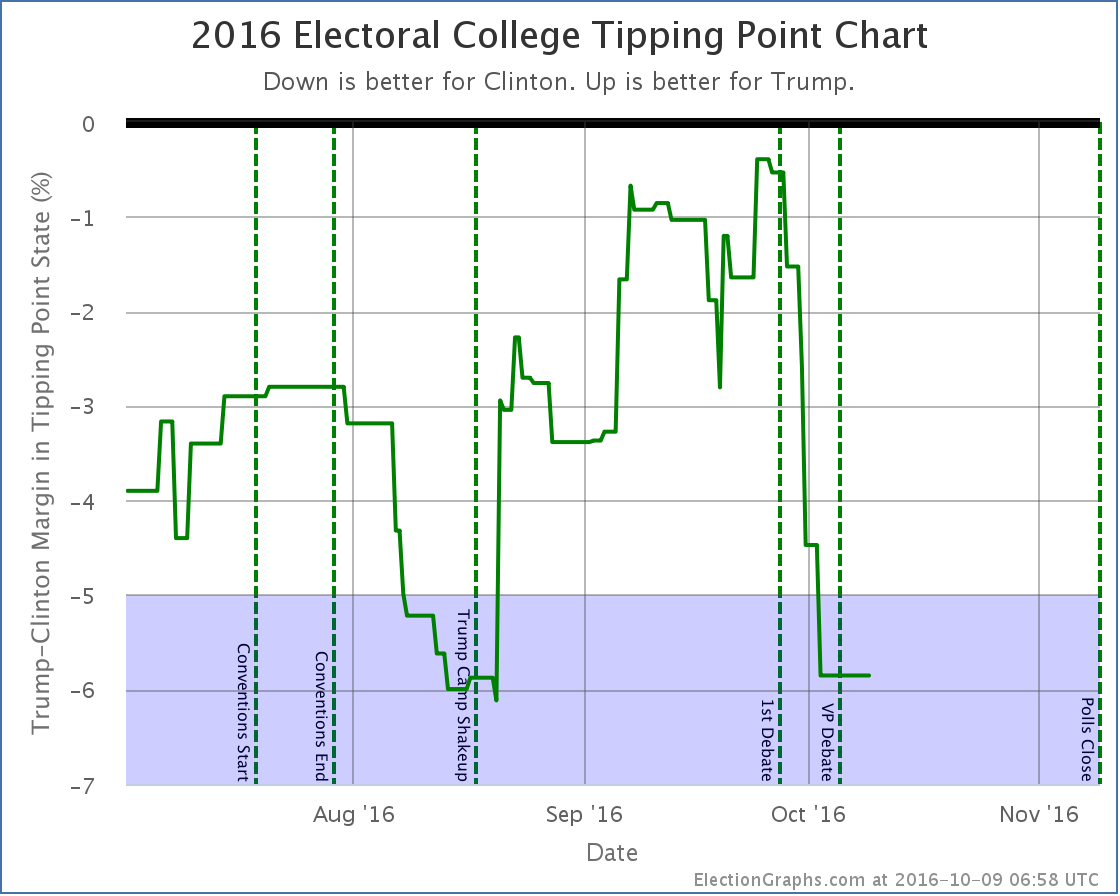
If you look at the tipping point chart you can see that Trump had indeed been making progress on the tipping point starting about when the Access Hollywood tape dropped. But that started to reverse around the 23rd. At the same time that his expected electoral college result was still improving.
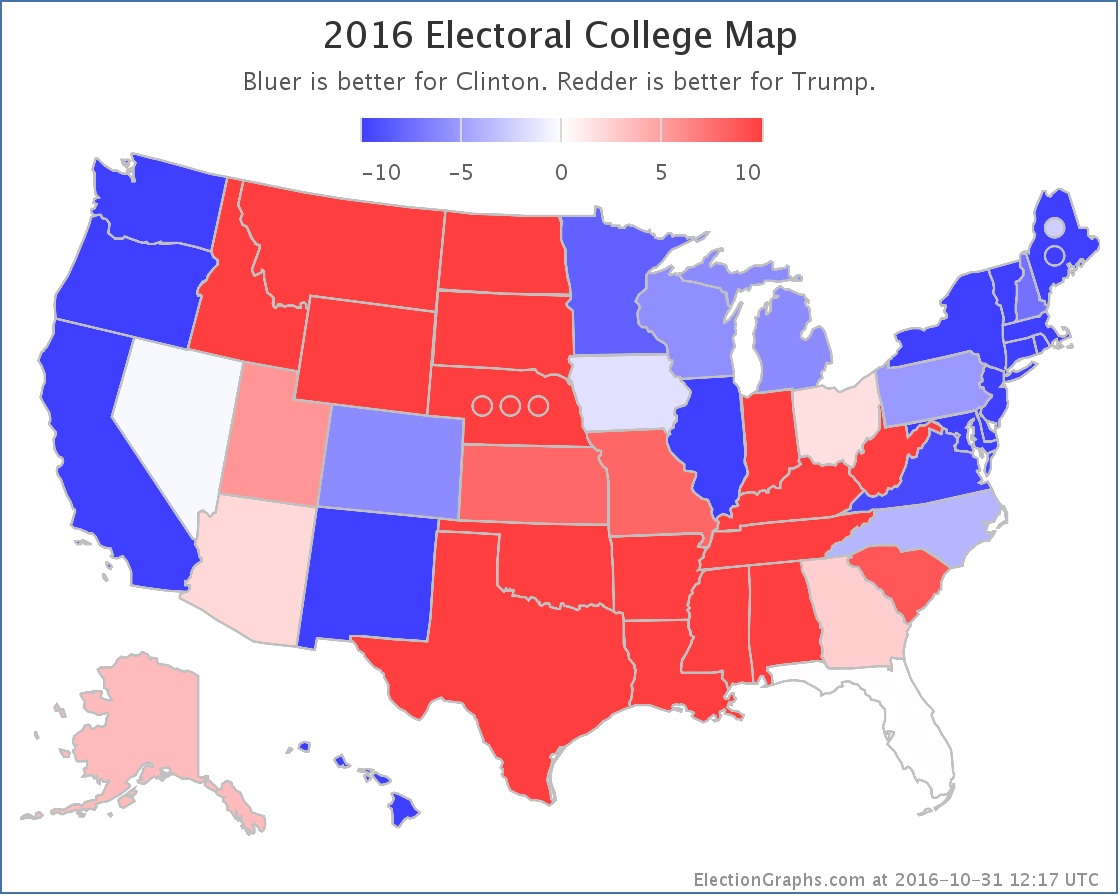
This is still confusing. What is happening? Well, all the states aren’t moving in lock step in reaction to events. A number of close states have moved toward Trump, like Florida for instance. But key states like Pennsylvania have been moving away from him. Because of this divergence, we can have Trump improving his electoral college “score” while simultaneously the path to 270 electoral votes gets harder.
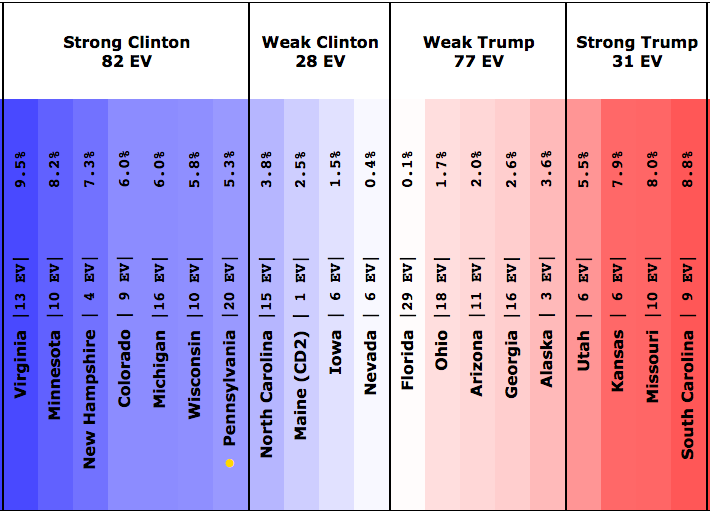
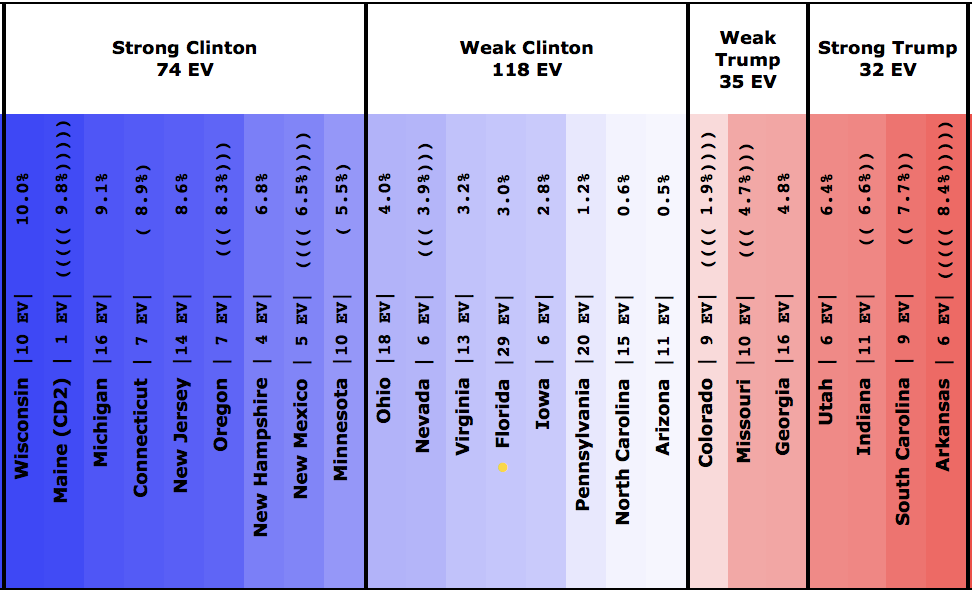
And in fact, at the moment, 270 looks out of reach for Trump. Look at the spectrum of the close states above. Right now Trump could win every state he is ahead in, then also pull over the states where he is close… Nevada (0.4% Clinton lead), Iowa (1.5% Clinton lead), Maine CD2 (2.5% Clinton lead), and North Carolina (3.8% Clinton lead)… and Trump would still lose by 6 electoral votes.
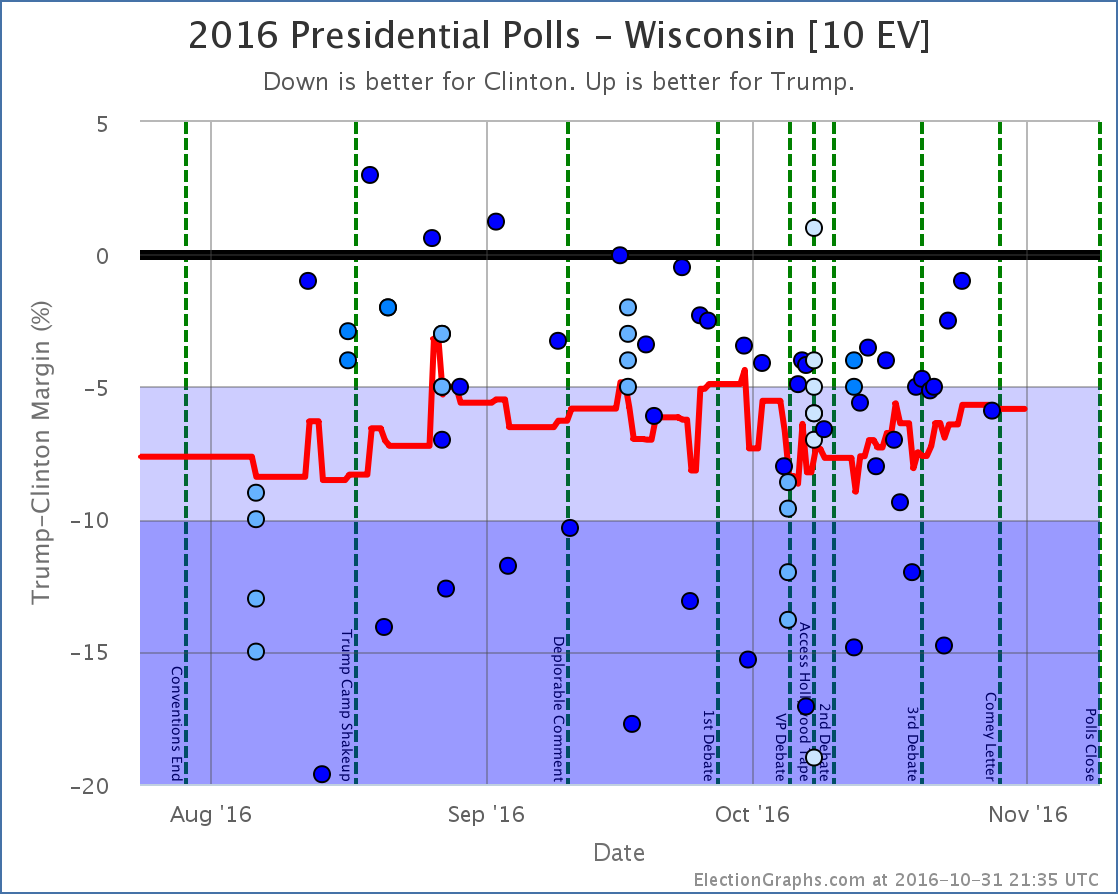
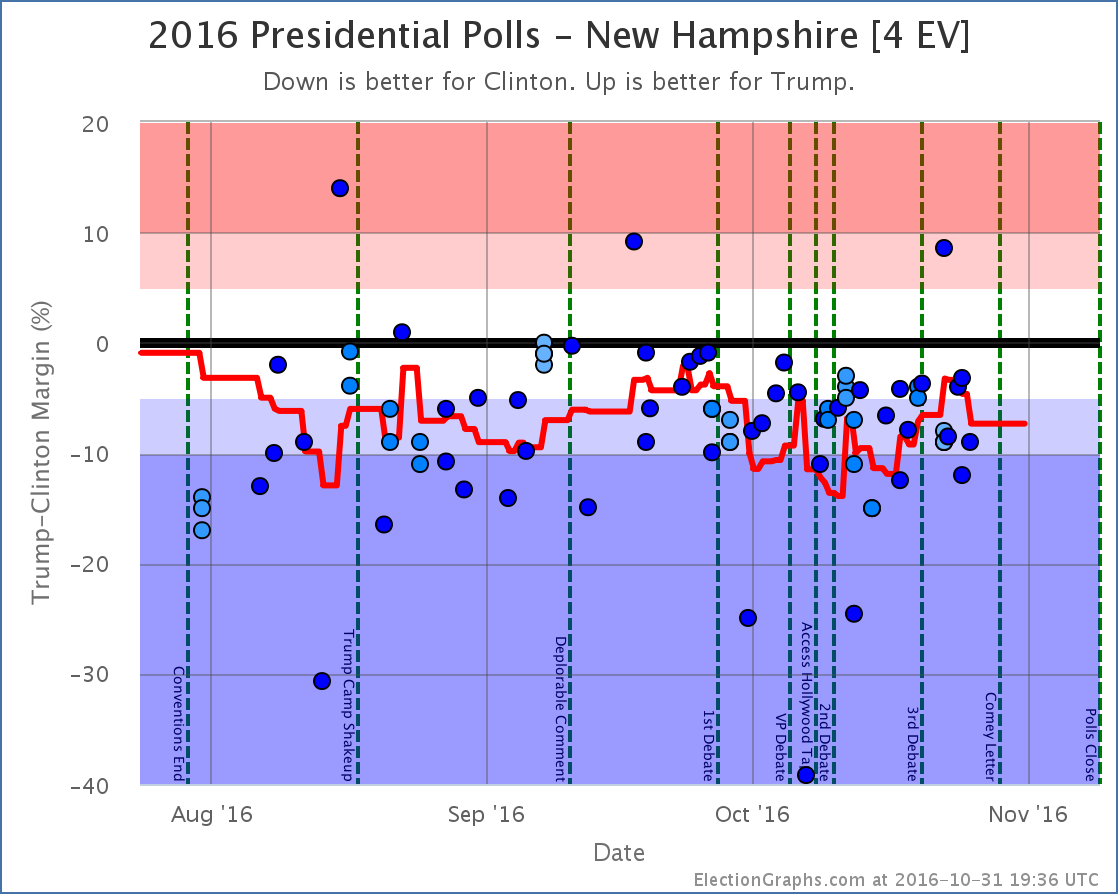
To win, Trump has to win all of the close states, plus Pennsylvania, where Clinton has a 5.3% lead at the moment… or one of the other larger “Strong Clinton” states… Wisconsin, Michigan, Colorado, Minnesota, or Virginia… all of which Clinton currently leads by even bigger margins. (New Hampshire isn’t enough to push Trump over the edge with only 4 EV.)
This is a really big pull with so little time left. The Trump side seems to be hanging their hopes on the fallout from the Comey Letter. This may cause some movement, but early indications are that almost all voters made up their minds on the Clinton email issue and if it mattered to them long long ago, and this is unlikely to change many minds.
We’ll start to see if there is any movement due to the letter within a few days. But there just are not that many days left. Sites that give odds for Trump winning range from less than 0.01% on the low side to 24.4% on the high side. The median odds seem to be around 5%. That isn’t impossible. But those odds are low enough that a Trump win would be a very big surprise.
There is another goal that Trump has a much better shot at though. If the election ends up exactly how things look today, Trump will lose by only 62 electoral votes. That would mean that Trump would do better than both McCain (lost by 192 EV) and Romney (lost by 126 EV). It may not be an actual win, but Trump improving on the performance of both previous Republican candidates may give the message to Republicans that a Trump like candidate in 2020 might be the way to go rather than returning to Romney or McCain style Republicanism.
We shall see.
8.1 days left until we start getting actual election results.
We are almost there.
State Details
The following are the detailed charts for all the states that influenced the national changes outlined above.
Moving from Clinton to Trump
Moving from Trump to Clinton
Now a possible Clinton pickup
Now out of Trump’s reach
Now out of Clinton’s reach
Also influencing the tipping point
A note about McMullin
Election Graphs is designed around showing the Republican – Democrat margin, and there is not enough time before the election to revamp the site to properly account for 3rd parties that are strong enough to have a shot at winning electoral votes.
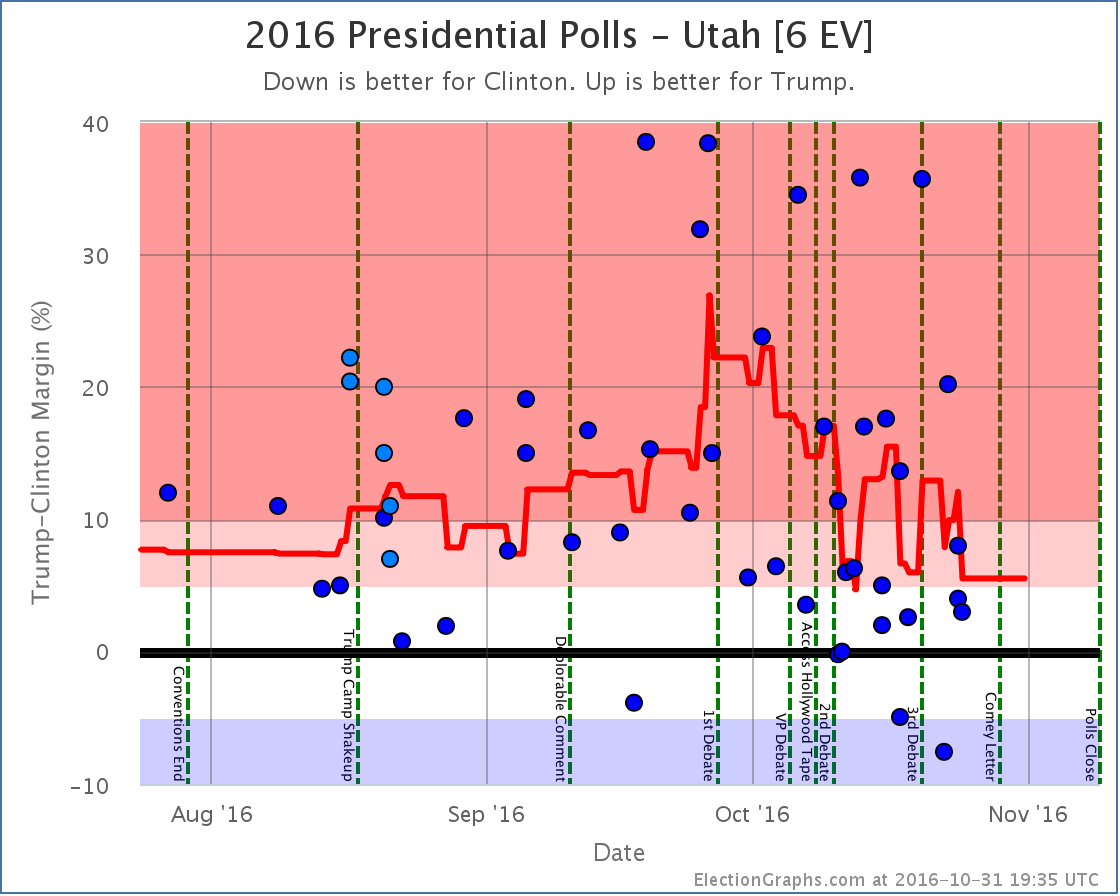
Right now the Real Clear Politics average in Utah has McMullin 6.0% behind the lead. The 538 average in Utah has him 7.3% behind the lead. If/when McMullin is within 5% according to either of these averages, I will add notes to both the Utah and National pages about the possibility of McMullin winning Utah’s 6 electoral votes.
For more information…
This post is an update based on the data on ElectionGraphs.com. Election Graphs tracks a state poll based estimate of the Electoral College. All of the charts and graphs seen in this post are from that site. Additional graphs, charts and raw data can be found there. Follow @ElectionGraphs on Twitter or like Election Graphs on Facebook to see announcements of updates or to join the conversation. For those interested in individual general election poll updates, follow @ElecCollPolls on Twitter for all the polls as they are added. If you find the information in these posts interesting or useful, please consider visiting the tip jar.
States with new poll data added since the last update: All 50 states and DC.
Notable changes in: Ohio, Arizona, Indiana, Kansas, Pennsylvania, and the tipping point
National Summary
Despite the widespread view that the time between the Vice Presidential debate and the present has essentially been non-stop bad news for Trump that could only cause his number to fall, and the fact that the national popular vote numbers do show this kind of trend, the electoral college view has just plain not shown that. In fact, looking at the various electoral college numbers we track here, things have mostly been moving in Trump’s direction since the 2nd debate. In the latest update, we have these changes:
Good for Trump:
Expected case moves from a 154 EV win for Clinton to a 140 EV win for Clinton
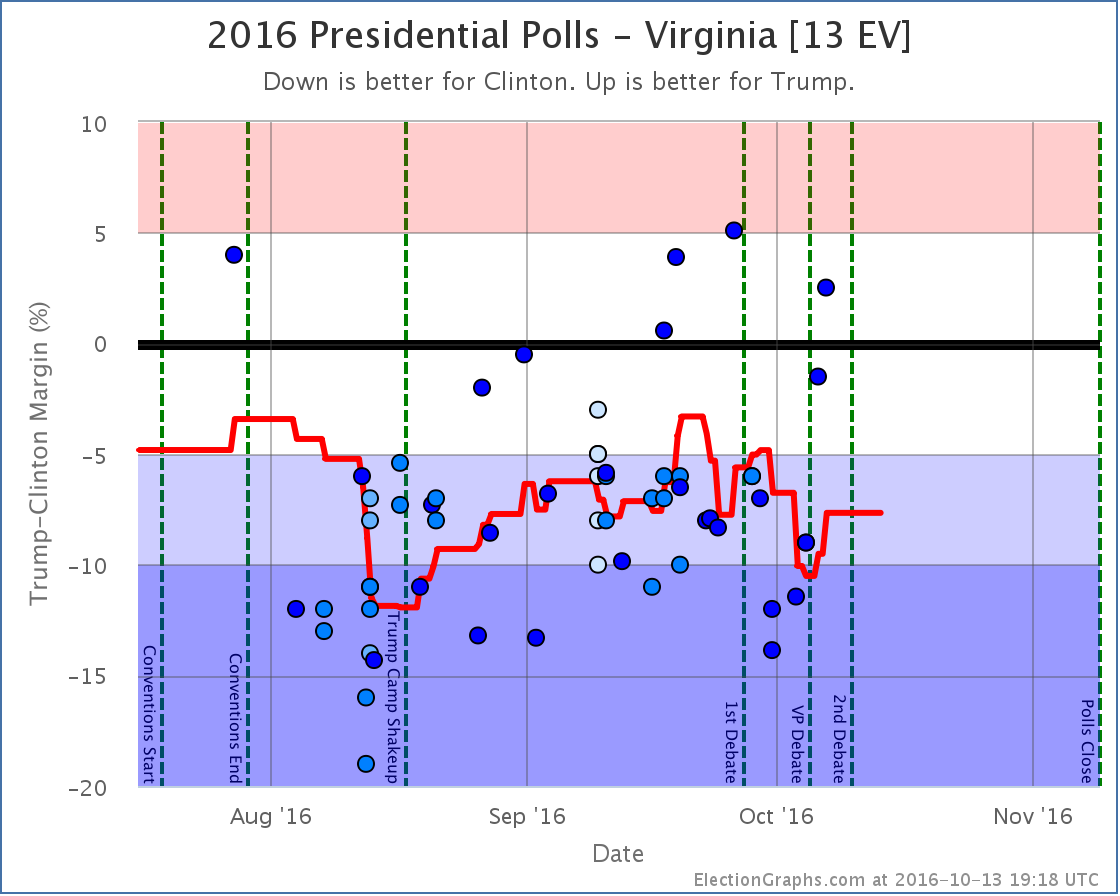
Tipping point moves from Clinton by 5.4% in VA to Clinton by 4.9% in PA
Trump best case improves from a 6 EV loss to a 34 EV win
Good for Clinton:
Clinton best case improves from a 204 EV win to a 238 EV win
While Clinton’s best case does improve a bit (although this may be due to outliers, see state details below), for the most part the movement here is toward Trump. It is not a huge movement, but it also doesn’t look like Trump continuing to crash.
Here are the charts:
While we do have Indiana and Kansas moving into the “Weak Trump” category, and thus expanding Clinton’s best case, the net changes for the expected case and tipping point are both in Trump’s direction, and Trump improves his best case as well, with Clinton’s lead in Pennsylvania down from where it was at the VP debate.
Looking at both charts, while Trump may have improved a bit from his lows, what this really looks like is that we have reached a plateau and things have basically been flat since the VP debate, minus some jiggles around the edges by states that are right near my category boundaries.
There are still events that aren’t factored in here, including some of the later sexual assault allegations, and of course the third debate. So things may start moving again in the next few updates. But for now… basically flat.
The “best case”, if Trump wins all his states, plus all the states where he is within 5%, now once again registers a narrow Trump win. But that would still require either a fairly large systematic polling error, or a last minute Trump surge. The “bubble” shows the extreme range of “conceivable possibilities”, but the edges of the bubble are still very unlikely. We’re far more likely to get results closer to the “expected” line.
Looking at the expected result, we are once again we are in the zone where Trump does better than McCain, but worse than Romney. That is a solid Clinton win, but not any sort of unprecedented loss for Trump. Just a normal sort of electoral loss. At least in terms of the electoral college.
We’ll see if anything causes that to change.
19.3 days left until we start getting real vote counts instead of polls…
State Details
Weak Clinton to Weak Trump
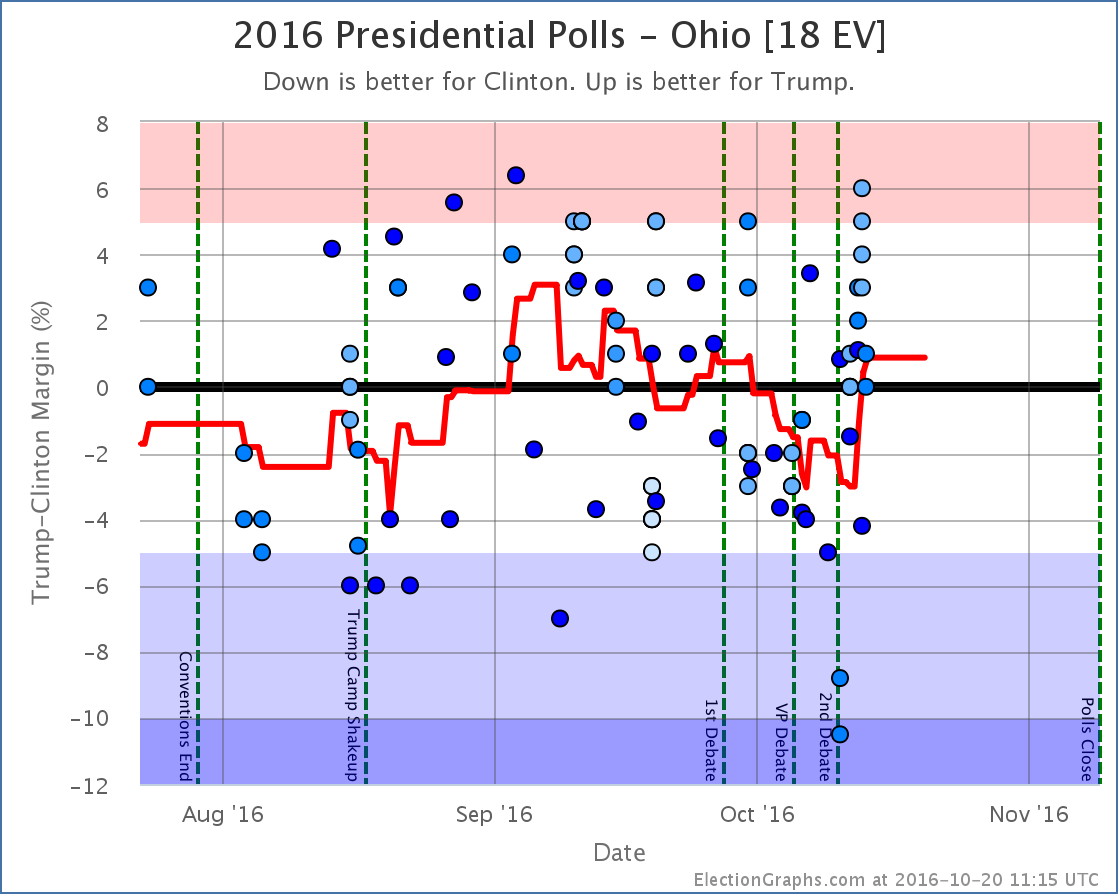
Trump now leads Ohio by 0.9%, but Ohio has been bouncing up and down right around the center line for months. It had been trending toward Clinton until a recent batch of polls that were better for Trump. Really could go either way.
Weak Trump to Weak Clinton
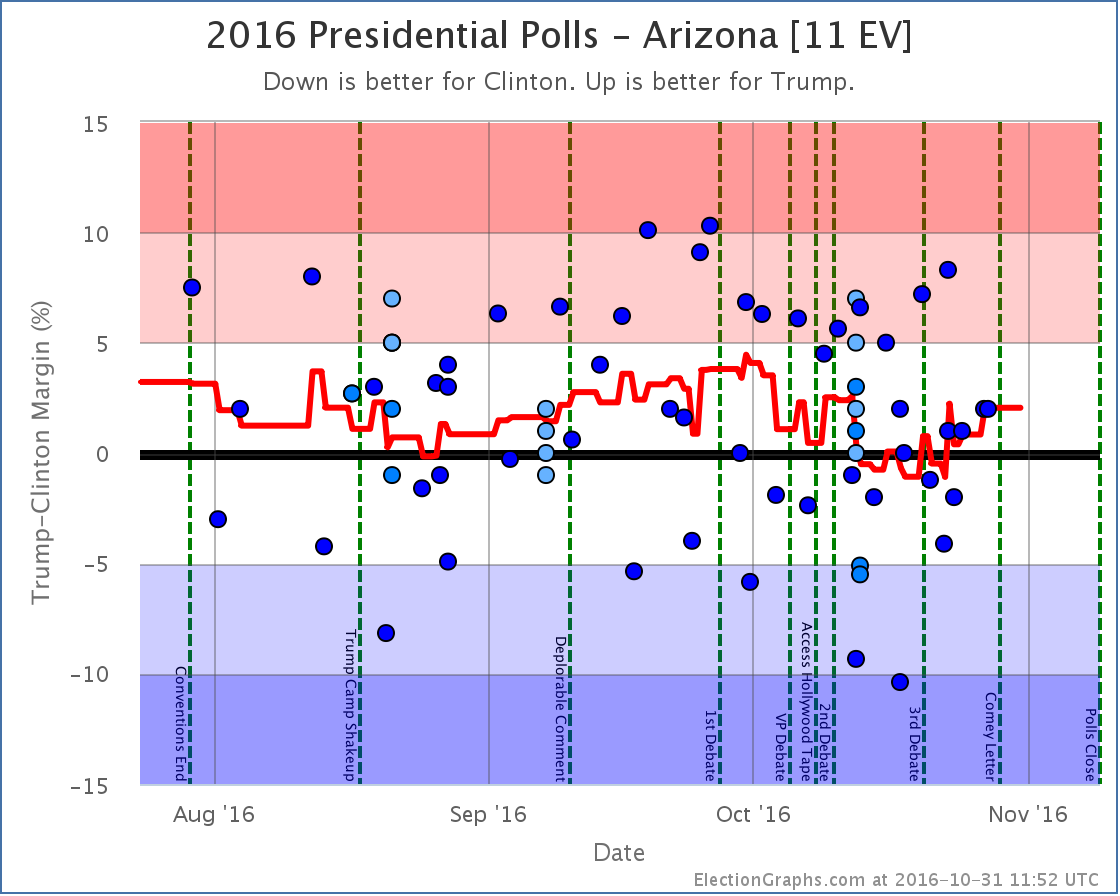
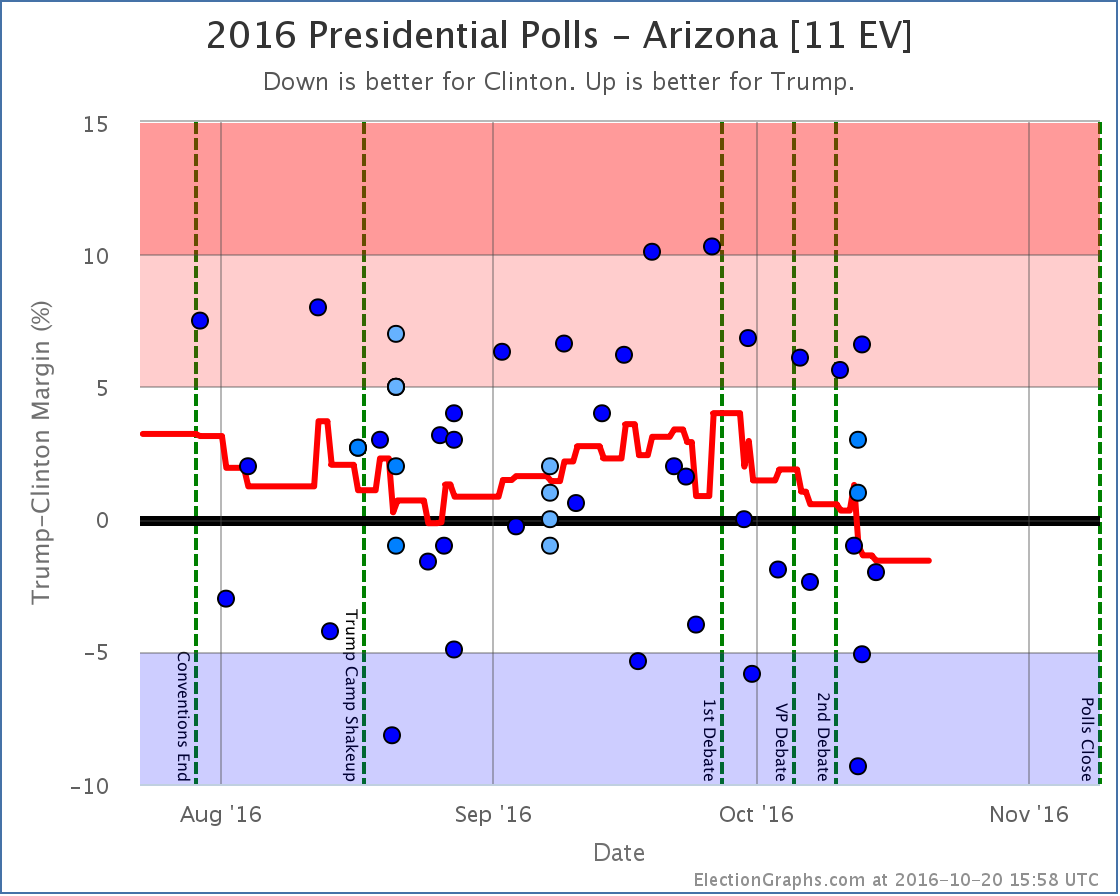
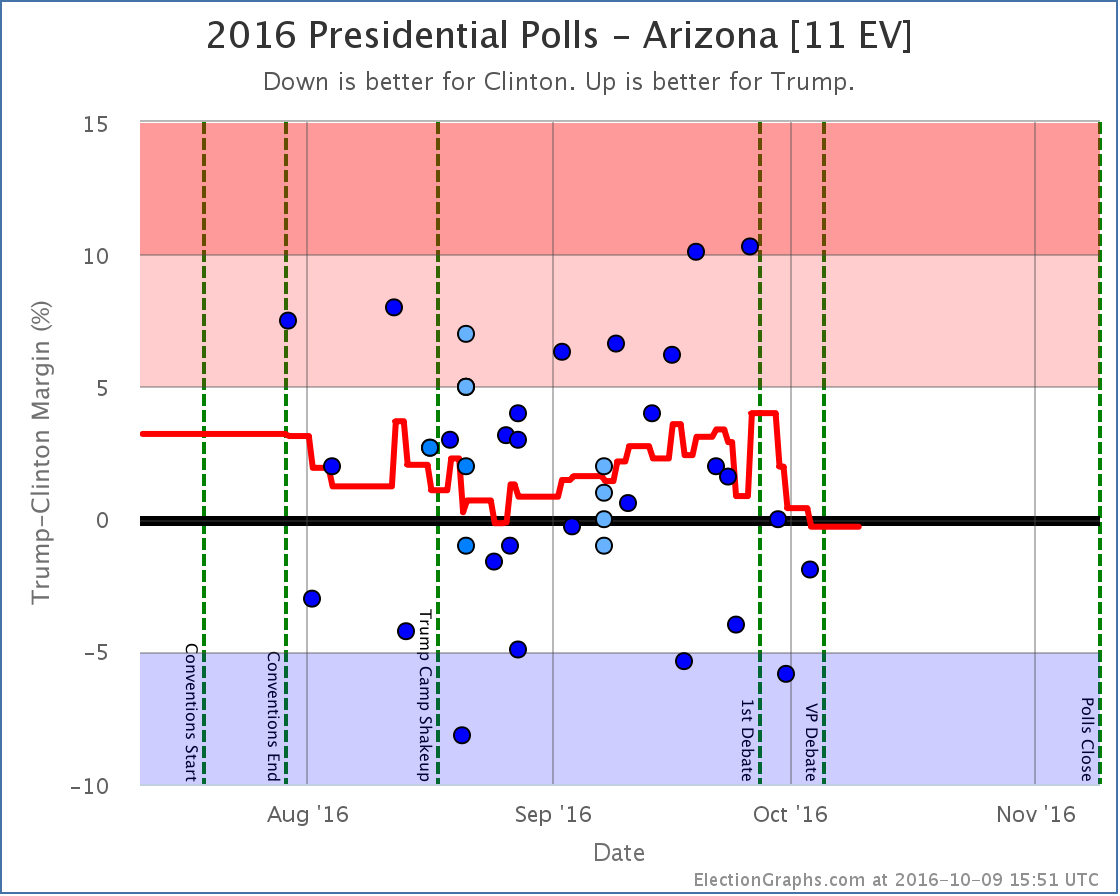
Clinton is now at +1.6% in Arizona. The state has been trending in her direction since the 1st debate. It is still close though, and this could be reversed. There is a reason we call the “weak” states weak.
Into reach for Trump
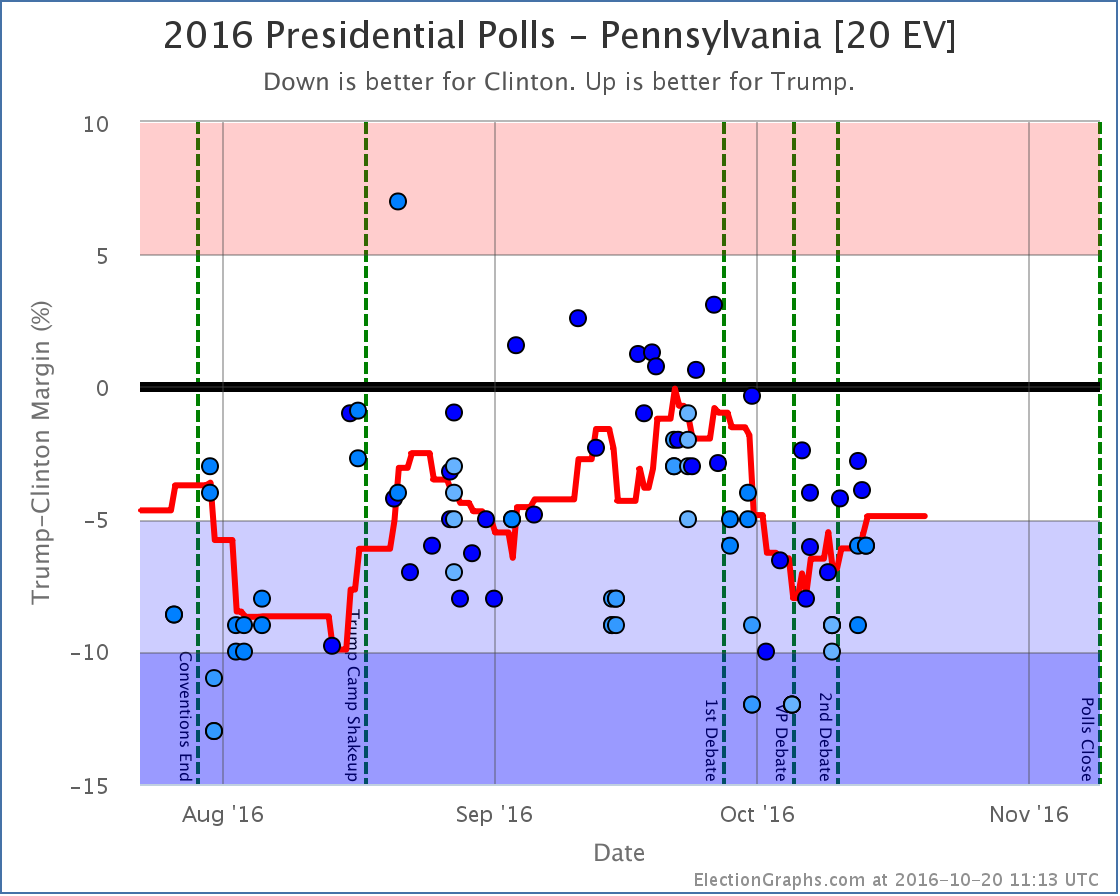
Clinton’s lead in Pennsylvania grew considerably after the 1st debate, but has been shrinking again since the VP debate. It now stands at only 4.9%, which means we once again consider it within reach for Trump. If Trump managed to stretch out and win Pennsylvania, his overall shot of winning the White House is significantly greater. But he has never led in the Pennsylvania poll average. So that will still take a significant move from where we are now…
Into reach for Clinton
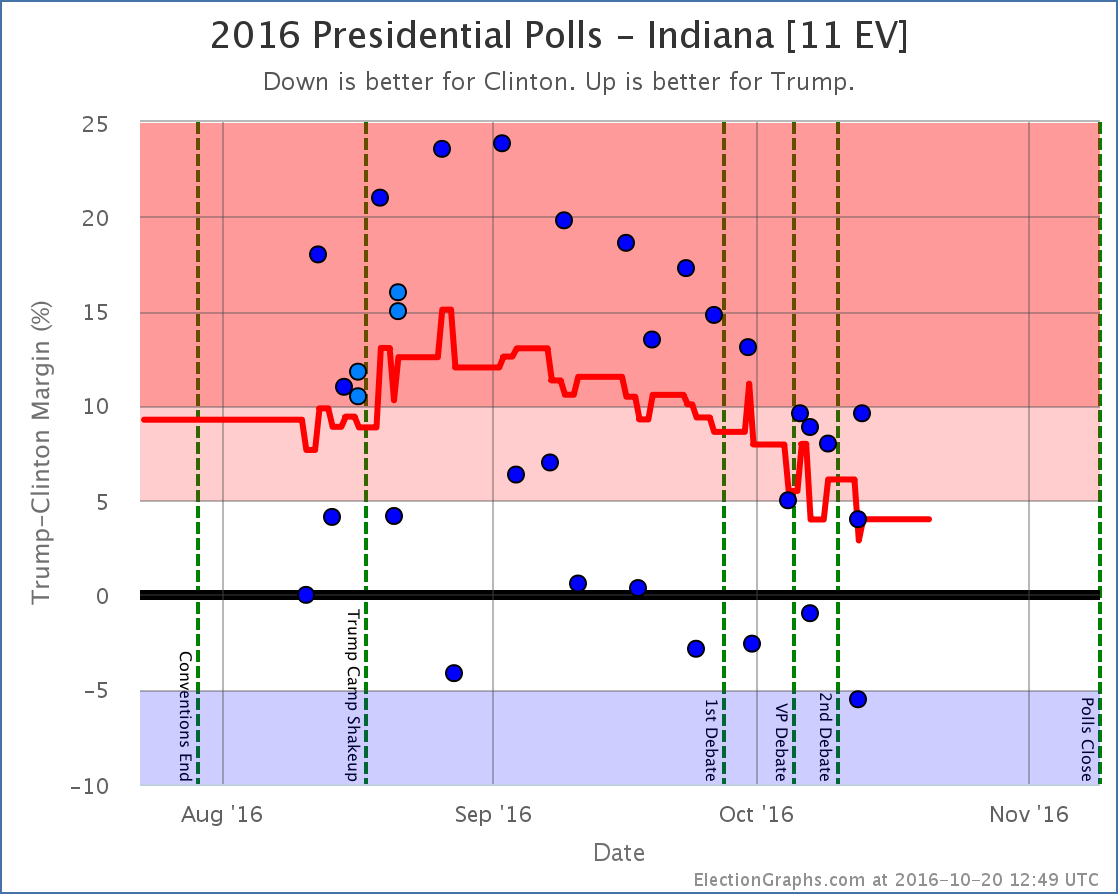
The Election Graphs average now has Trump’s lead in Indiana down to only 4.0%. This puts it in the “Weak Trump” category. I’m not sure I really believe this though. This is pulled downward by two Google polls showing Clinton actually leading in Indiana, which are outliers compared to the rest of the Indiana results. Without Google, the average would be Trump leading by 8.0%. Indiana is closer than it was a few months ago. It HAS been trending slowly away from Trump. But take Indiana as a swing state with a dose of salt until non-Google polls show it there too.
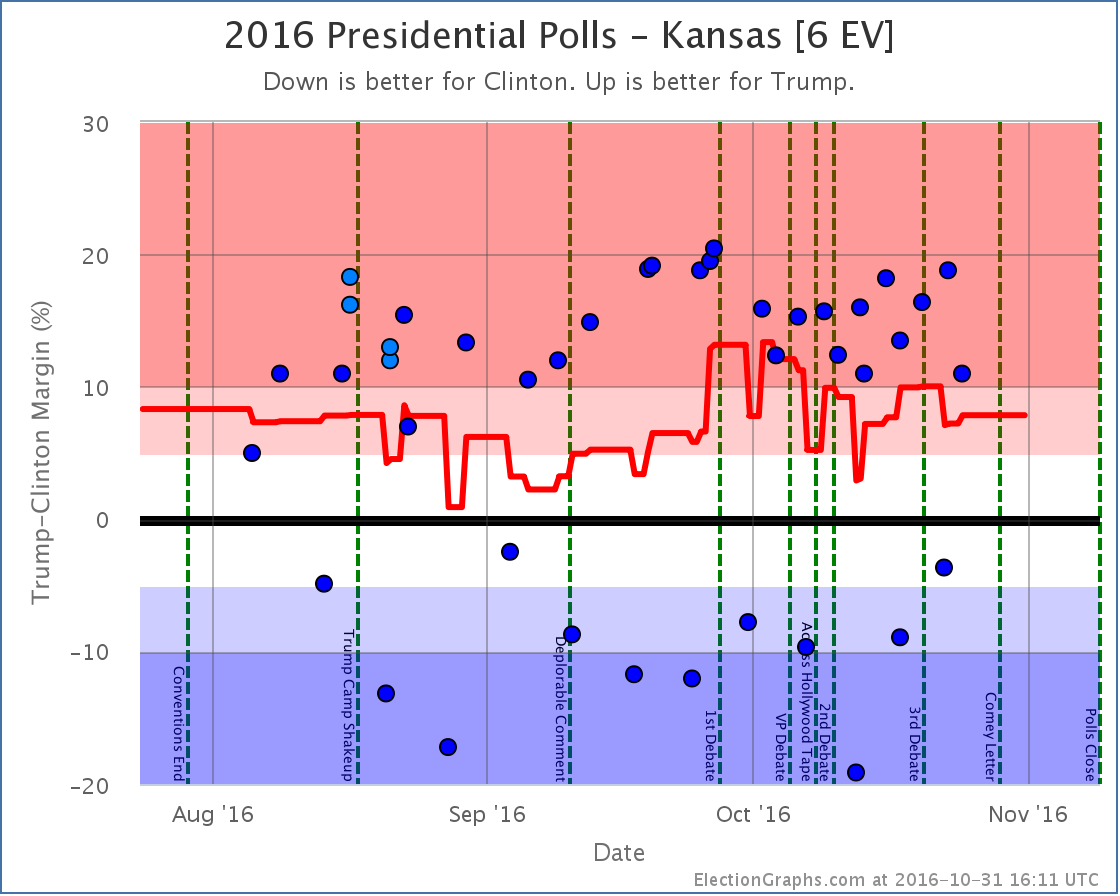
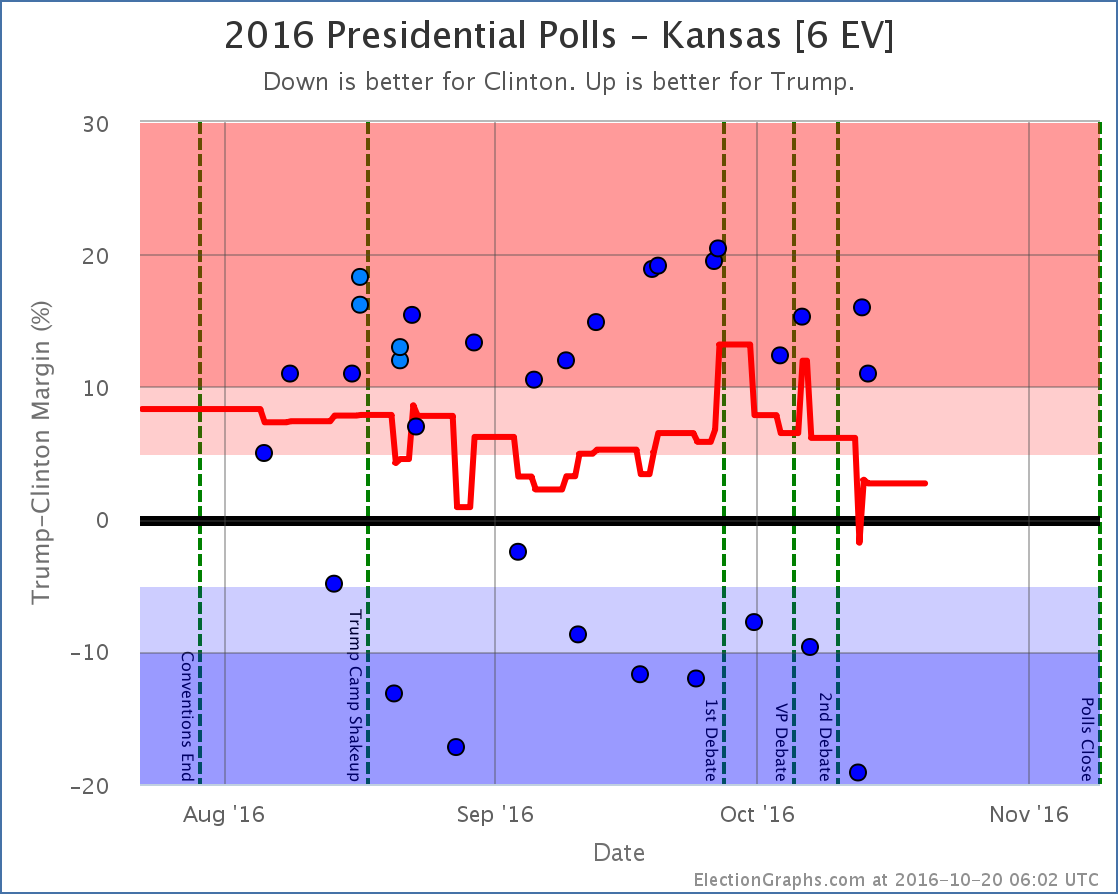
Use the rest of your salt for Kansas, and for the same reason. Google. Without the Google polls, the average in Kansas would not be Trump by 2.7%, it would be Trump by 15.0%. Kansas is lightly polled, so Google has an outsized influence. And the Google results are WAY off from what any other pollster has seen.
Also impacted the tipping point
A note about McMullin
In the last week or two McMullin has spiked in Utah. Some individual polls now even show him leading in Utah. All of the current Election Graphs metrics and charts operate under the assumption that no third party has a realistic shot at winning electoral votes. I have had the outline of a contingency plan on how to modify the site to accommodate 3rd parties that might win electoral votes for months, but activating it would take quite a lot of time and effort. If a 3rd candidate had gotten to that position a month or two ago, the site would definitely have been revamped to adjust for that possibility. As it is, there realistically is no longer time to do that before election day.
Right now the Real Clear Politics average in Utah has McMullin 6.4% behind the lead. The 538 average in Utah has him 11.1% behind the lead. If/when McMullin is within 5% according to either of these averages, I will add notes to both the Utah and National pages talking about the possibility of McMullin winning Utah’s 6 electoral votes, but I probably won’t try to revamp the site to change absolutely everything to account for the possibility. I’ll try to have something ready for 2020 just in case though. :-)
For more information…
This post is an update based on the data on ElectionGraphs.com. Election Graphs tracks a state poll based estimate of the Electoral College. All of the charts and graphs seen in this post are from that site. Additional graphs, charts and raw data can be found there. Follow @ElectionGraphs on Twitter or like Election Graphs on Facebook to see announcements of updates or to join the conversation. For those interested in individual general election poll updates, follow @ElecCollPolls on Twitter for all the polls as they are added. If you find the information in these posts interesting or useful, please consider visiting the tip jar.
States with new poll data added since the last update: All 50 states, DC, and the Maine congressional districts
Notable changes in: Arizona, Indiana, Maine (CD2), and the tipping point
National Summary
At this point we have many polls that are fully or partially after the “Trump Tape” release on the 7th, but this batch of polls still included many where most of the time in the field was before that. And of course the state averages here are based on at least the last five polls in each state, so reach even further back in time. The close states tend to be based on polls with middates going back 1-3 weeks.
All that is to say that the changes we are seeing now are starting to include the fallout from that event, but haven’t yet fully factored it in.
With that out of the way, the changes for this round:
The expected result moves from Clinton by 176 EV to Clinton by 154 EV
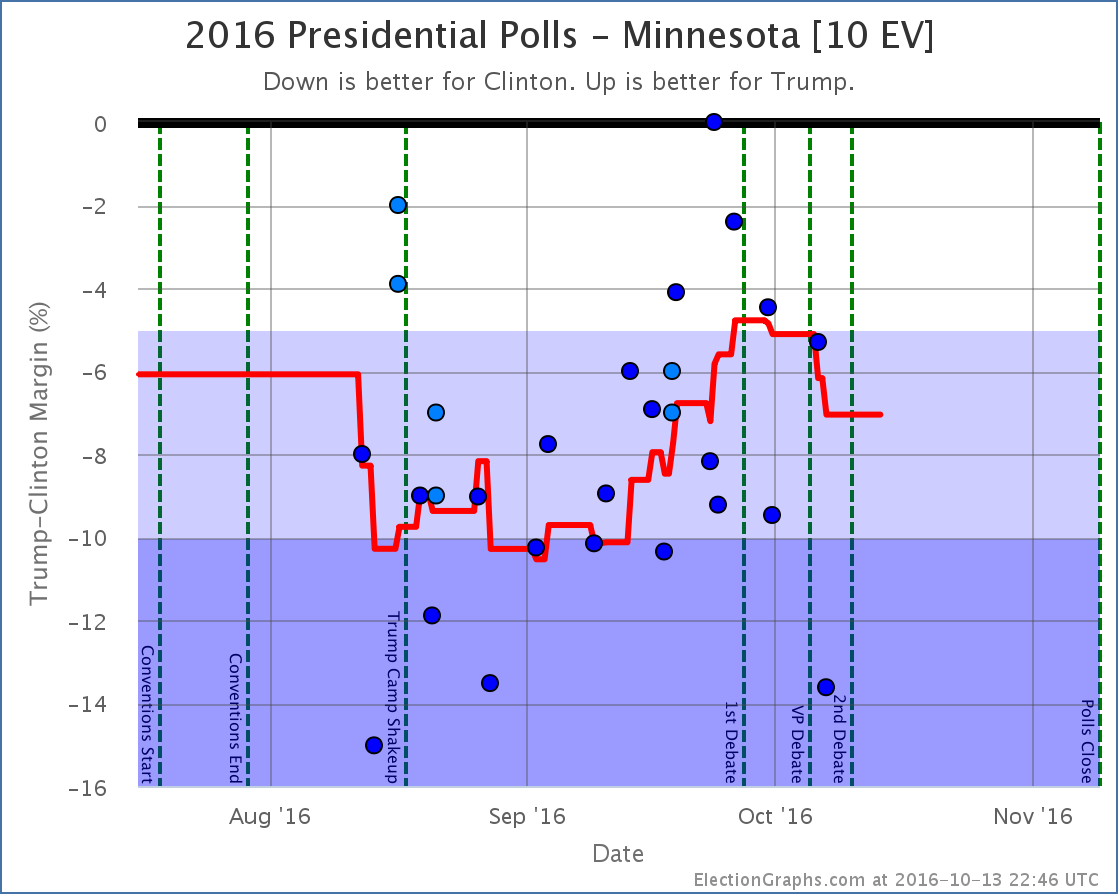
The tipping point moves from Clinton by 5.9% in MN to Clinton by 6.5% in PA
Clinton’s best case improves from winning by 202 EV to winning by 226 EV
So wait, the expected result moved toward Trump! Why is the title of this post about Trump’s drop continuing?
Well, basically because the improvement in the expected case is a result of Arizona moving from just barely Clinton, to just barely Trump. Either way it is really too close to call. It may flip back again with the next update. Or maybe it won’t.
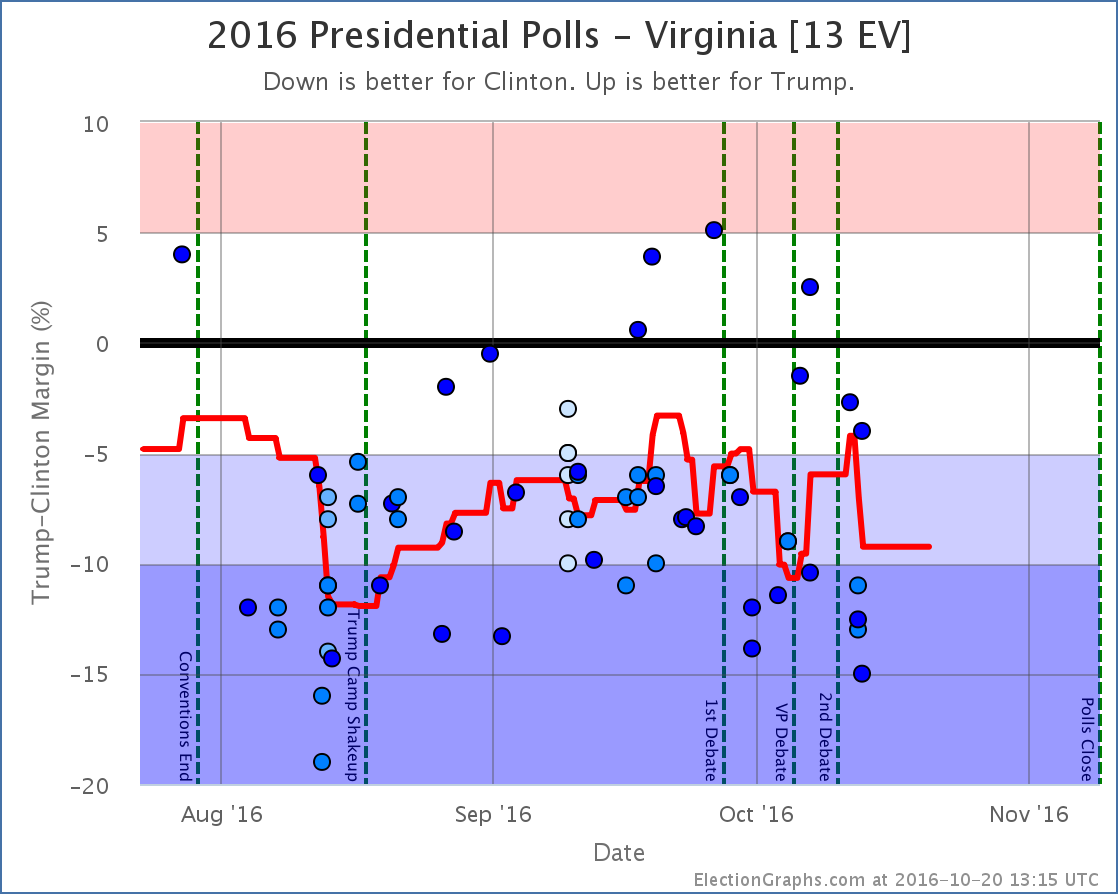
But meanwhile, polling changes in Minnesota, Virginia, and Pennsylvania moved the tipping point further toward Clinton, meaning that overall Trump has to move polls even further in order to actually flip the results of the election.
And Clinton expanded her best case a bit as well.
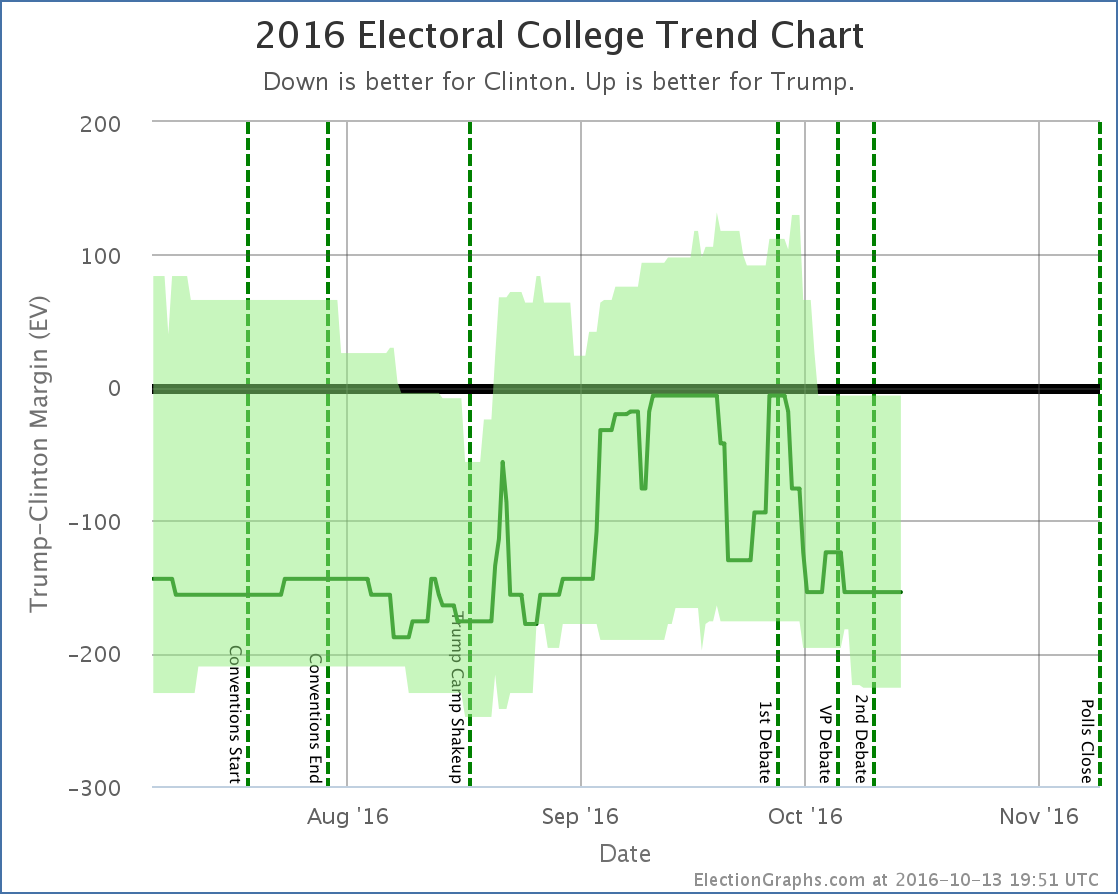
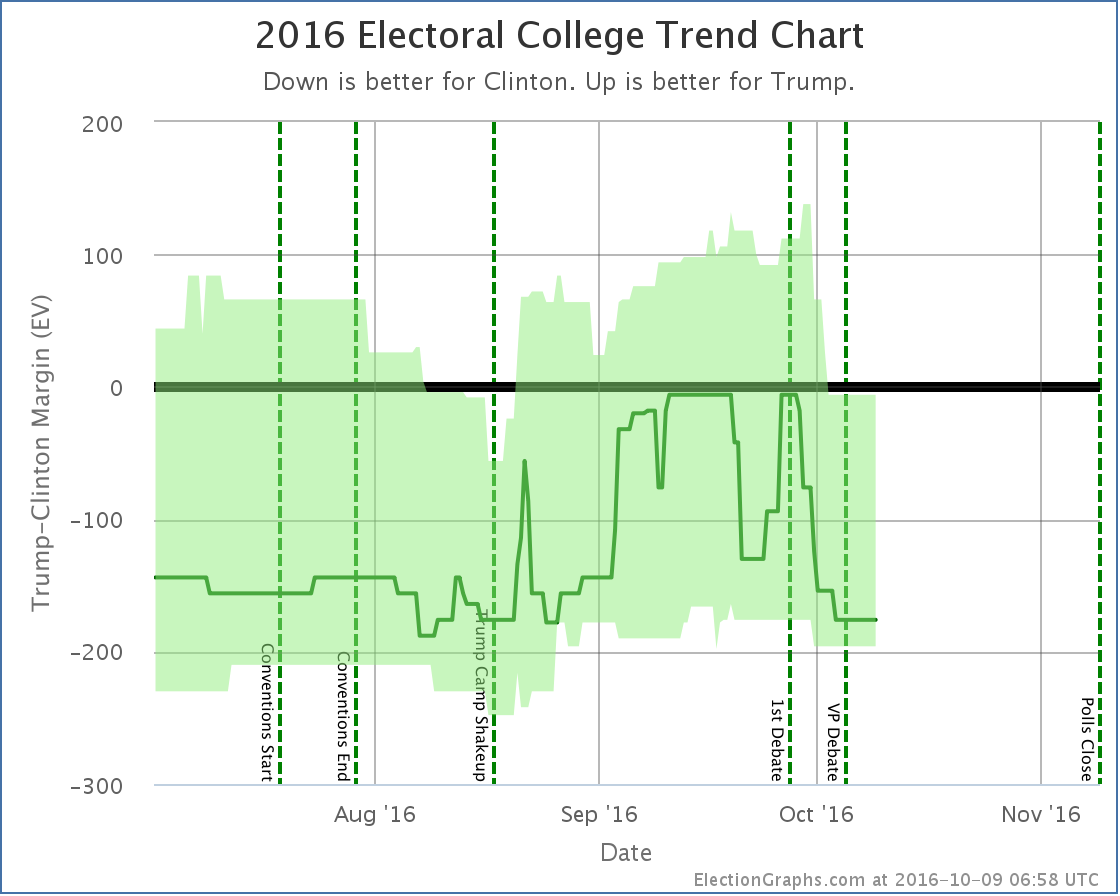
Here are the charts:
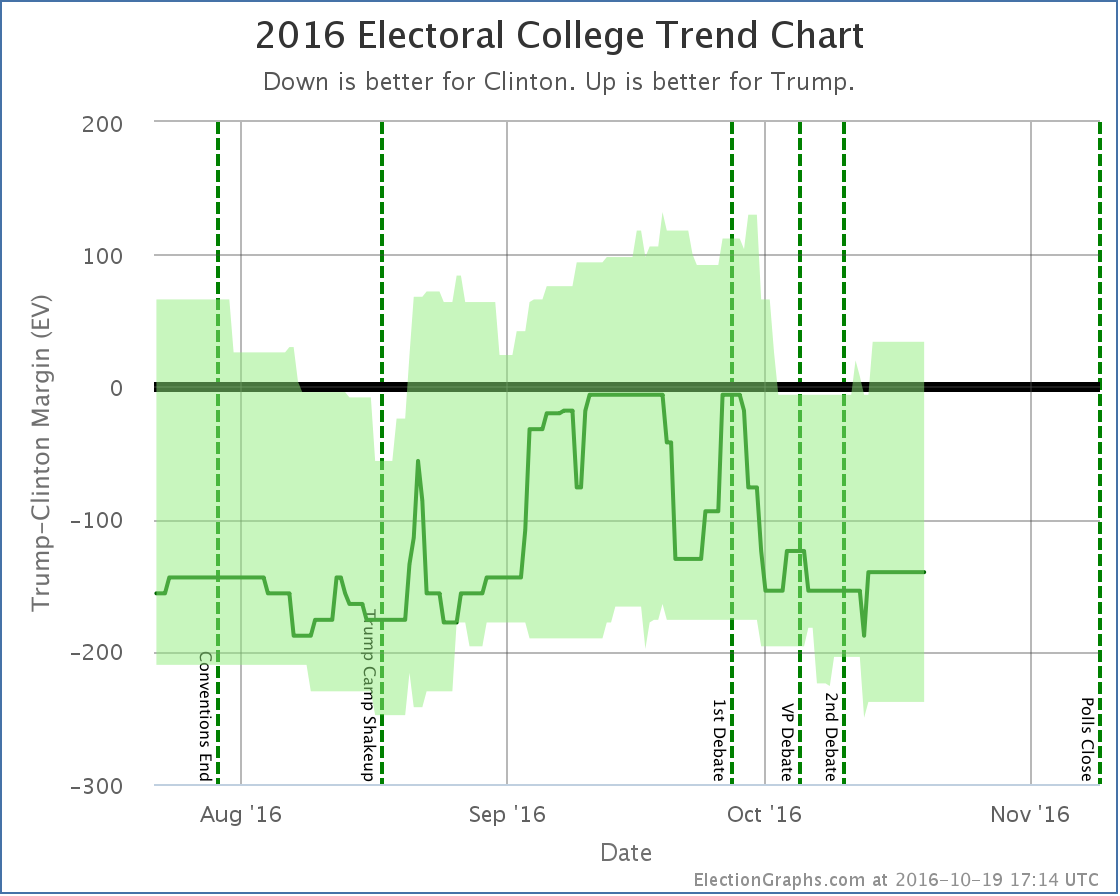
The trend in both charts is clear. After peaking right before the 1st debate Trump has been falling. This is more dramatic in the tipping point chart, but it is clear no matter which way you look at the race.
There is no time left for a Trump comeback from behind win from these levels. It would take something massive that would completely reverse everything we know about this race so far. It would be an unprecedented reversal. Impossible? No. Incredibly unlikely? Yes.
A few weeks ago Trump had managed to make this race close. But it was short-lived. Starting with the debate he has been dropping steadily. We don’t yet have signs that we have hit bottom either. There have been new negative stories about Trump almost every day. Further drops would not be surprising.
We’re no longer really talking about who will win this election. Clinton will win this election. The only question is by how much.
25.8 days left until we have the first actual election results.
State Details
Weak Clinton to Weak Trump
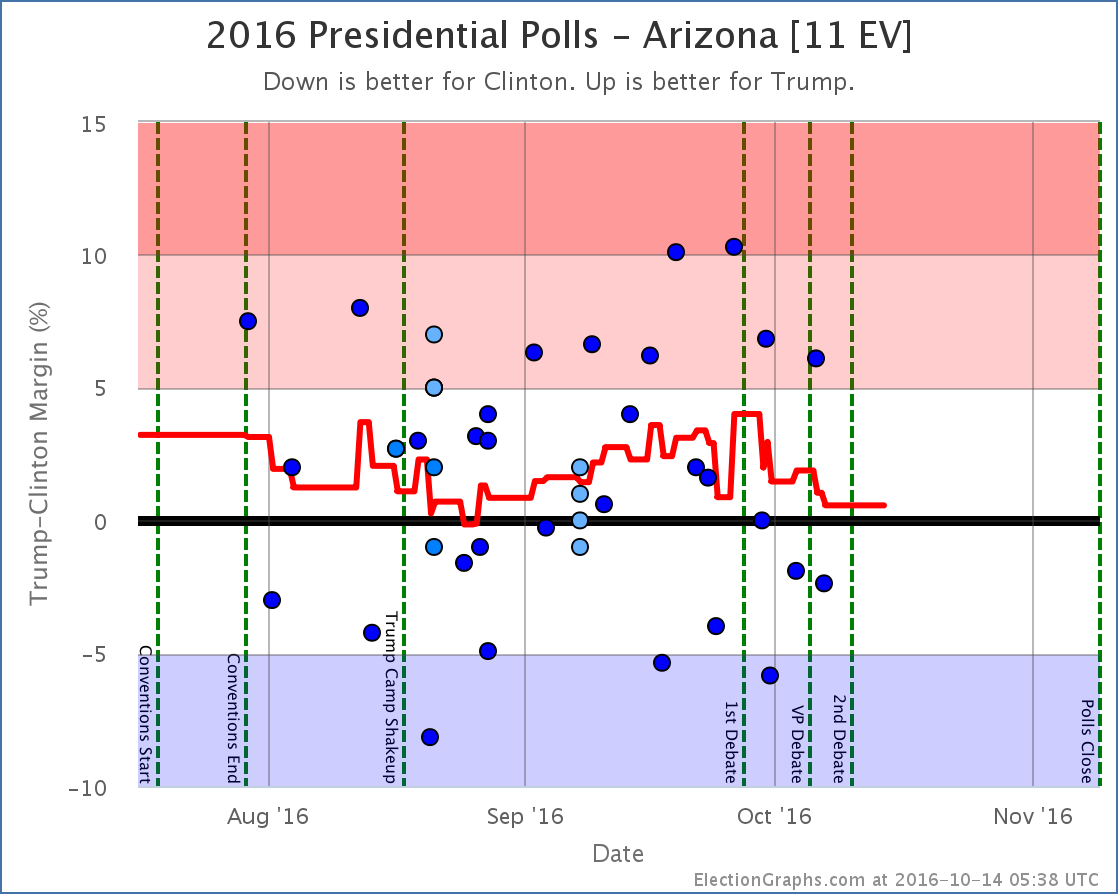
The latest polls not only move Arizona from Weak Clinton to Weak Trump, but since older polls were added, they actually moved the past curve Trumpward, such that we no longer have a recent period with Clinton in the lead at all. The trend has still been away from Trump toward Clinton since the 1st debate, but Clinton hasn’t pulled Arizona over to her side quite yet.
Moving into Clinton’s reach
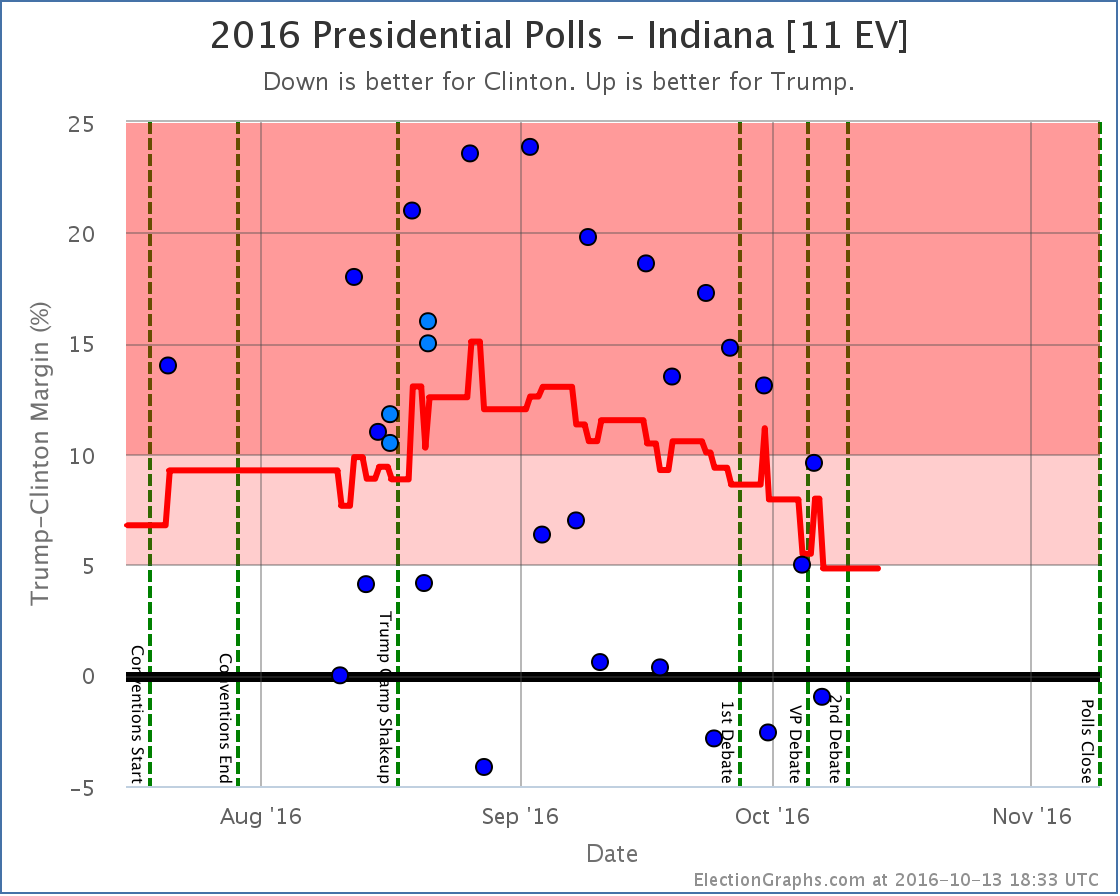
Trump’s lead in Indiana has been diminishing since late August. With the latest updates Trump is up 4.8%. Trump still leads, but it is now close enough that a Clinton win does not seem impossible. Still a stretch to be sure, but no longer unimaginable.
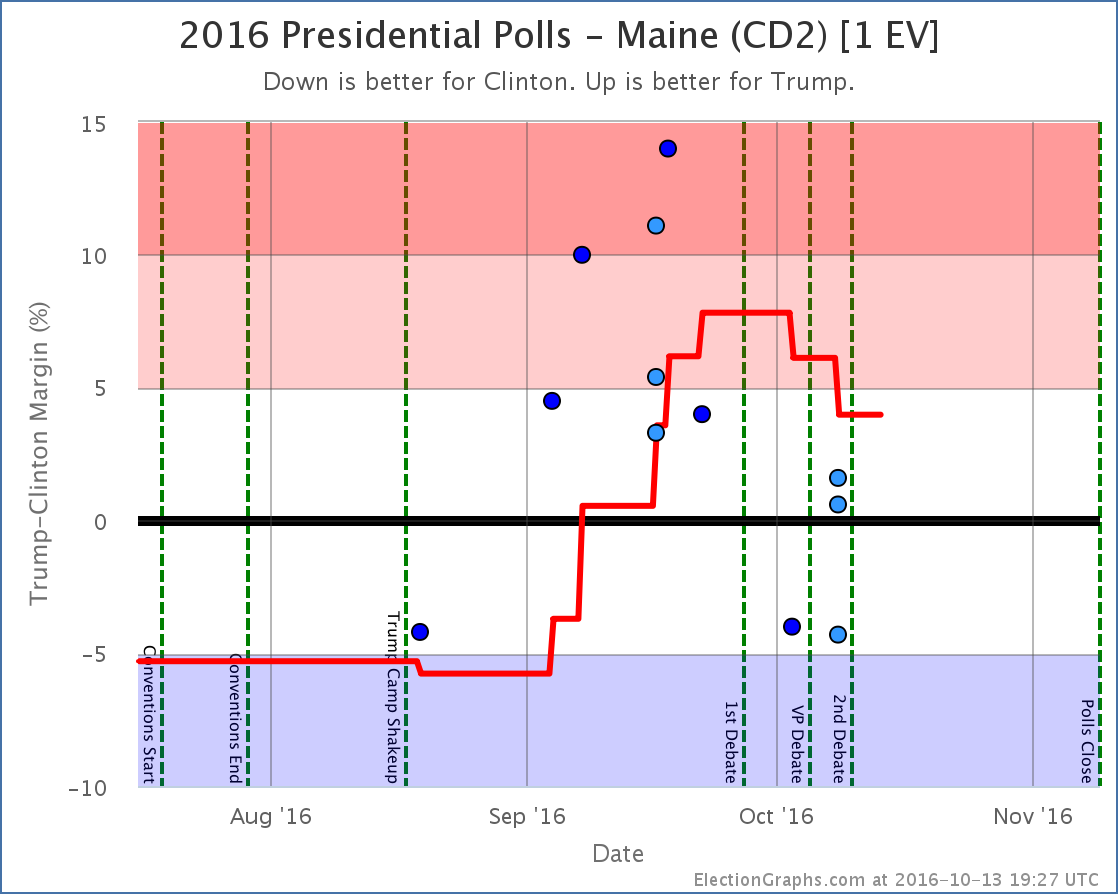
Maine’s 2nd congressional district had looked like it would definitely split from the state this cycle giving Trump a somewhat unusual pickup. With the post-debate polls, Trump still leads, but his lead is slipping, and so it now seems that this single electoral vote is now up for grabs. Clinton could steal it back.
States that moved the tipping point
For more information…
This post is an update based on the data on ElectionGraphs.com. Election Graphs tracks both a poll based estimate of the Electoral College and a numbers based look at the Delegate Races. All of the charts and graphs seen in this post are from that site. Additional graphs, charts and raw data can be found there. Follow @ElectionGraphs on Twitter or like Election Graphs on Facebook to see announcements of updates or to join the conversation. For those interested in individual general election poll updates, follow @ElecCollPolls on Twitter for all the polls as they are added. If you find the information in these posts interesting or useful, please consider visiting the tip jar.
States with new poll data added since the last update: Wisconsin, Florida, Ohio, Indiana, New Hampshire, Iowa, Virginia, Colorado, Alaska, Washington, Michigan, Arizona, Tennessee, Maryland, Massachusetts, Oregon, Illinois.
Notable changes in: Michigan and Arizona.
National Summary
As of this update, the most recent polls included in the state averages ended on Thursday. That means that as of yet we do not have any polling that would show the impact (or lack thereof) of Friday’s release of 2005 era Trump recordings that have dominated the news since then.
But even before those revelations, Trump was dropping quickly in the aftermath of the first debate and the leak of tax documents. This process continues:
The expected result moves from Clinton by 154 electoral votes to Clinton by 176
Trump’s best case moves from a 26 electoral vote win to a 6 electoral vote loss
The tipping point moves from Clinton by 4.5% in MI to Clinton by 5.9% in MN
Looking at the charts:
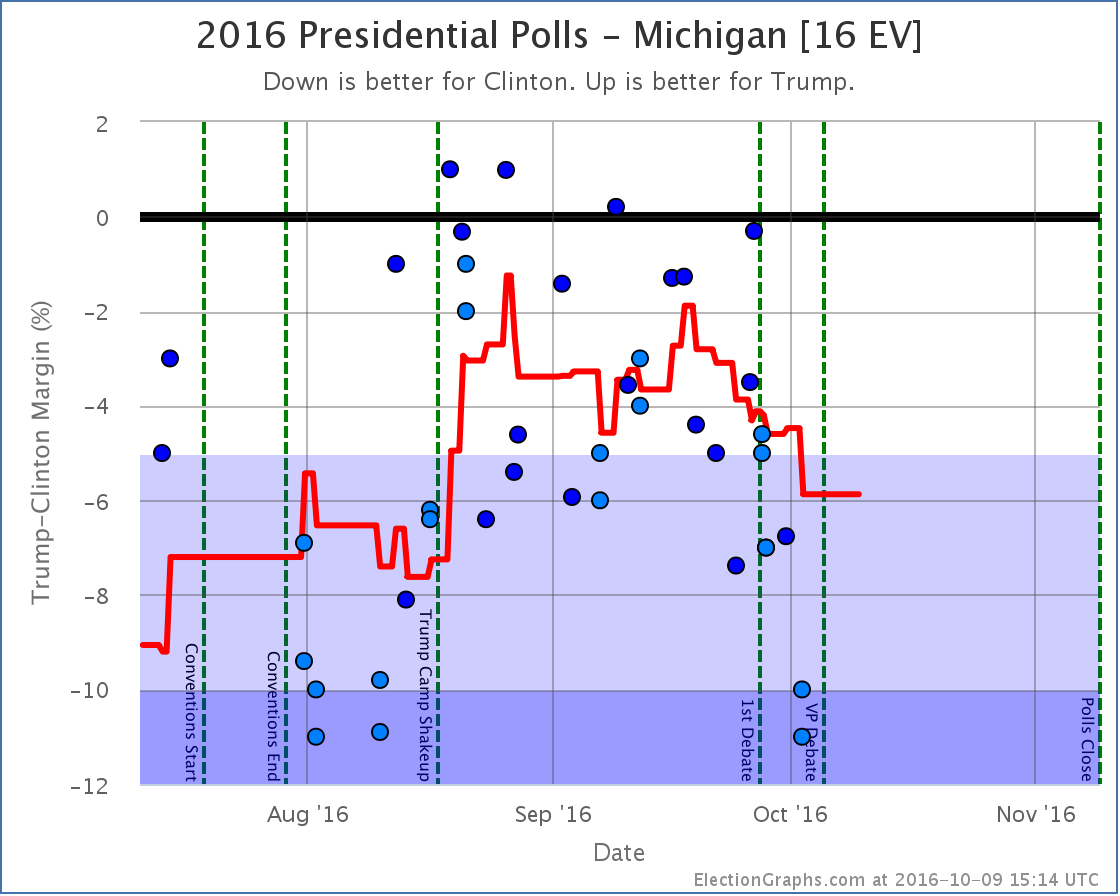
Clinton expands her expected win by taking the lead in Arizona. But perhaps more notable at this point is that her lead in Michigan expands to 5.9%, moving it from my “Weak Clinton” category into “Strong Clinton”.
Without Michigan, Trump no longer has a path to victory. He can win all the states he is ahead in, plus all the states where he is close (North Carolina, Arizona, Florida, Ohio, Iowa, and Nevada) and he would still come up short, losing to Clinton 272 to 266.
In order to win, Trump would need to not only pull all of those close states over to his side, but also reverse his fortunes in Michigan or other states where he is currently not just behind, but significantly behind.
Now, with all this, Trump’s numbers are actually still slightly better than he was doing at Clinton’s high water mark in mid-August. Trump came back from that and moved things to the point where he had almost tied the race. Can’t he do that again? Well, look carefully at that recovery. From Trump’s low point, it took about a month to reach the point where he had almost tied the race. A month.
We now have 30.3 days left until polls start to close on election day. Many people have already voted. Early voting is ramping up quickly in state after state. In order to catch up and win, Trump would have to have a recovery that was more significant… and quicker… than the successes he managed in August and September.
For any reversal, Trump has to pull out of the tailspin first… and the polls don’t yet reflect the latest major campaign events. Things are likely to get worse for Trump before they get better. If they get better. He is running out of time. It may already be too late.
As I write this the 2nd Presidential debate is in just a few hours. Hang on tight.
State Details
Here are the charts for the states whose movements caused the summary changes:
Weak Trump to Weak Clinton
Four of the five polls in the average right now have Clinton tied or ahead in Arizona. All three post debate polls do. Clinton’s lead in the average though is a very narrow 0.3% though. Trump could very well take the lead again with the next poll.
Weak Clinton to Strong Clinton
Movement away from Trump is visible starting in mid September. Trump’s debate performance did nothing to change this trend. Clinton now holds a fairly substantial lead in Michigan.
For more information…
This post is an update based on the data on ElectionGraphs.com. Election Graphs tracks both a poll based estimate of the Electoral College and a numbers based look at the Delegate Races. All of the charts and graphs seen in this post are from that site. Additional graphs, charts and raw data can be found there. Follow @ElectionGraphs on Twitter or like Election Graphs on Facebook to see announcements of updates or to join the conversation. For those interested in individual general election poll updates, follow @ElecCollPolls on Twitter for all the polls as they are added. If you find the information in these posts interesting or useful, please consider visiting the tip jar.
States with new poll data since the last update: Florida, Illinois, Pennsylvania, New Hampshire, Ohio, North Carolina, Nevada, New York, Texas, California, New Jersey, Minnesota, Georgia, North Carolina, Indiana, Arizona, Missouri, Massachusetts, Virginia, Tennessee, Washington, Michigan, Wisconsin, Mississippi, Oklahoma, Idaho, Maryland, Oregon, Maine (All), Louisiana, Colorado, Iowa, Nebraska (All), South Carolina, Alabama, West Virginia, Kansas, Kentucky, Utah, Arkansas, Connecticut, Delaware, New Mexico, Montana, Alaska
Wow, that is a lot of new polls. While there were some others, the big influence today is that Reuters/Ipsos has started to do a weekly nationwide tracking poll where they provide state breakdowns for any state where they have enough data. So from now until the election we should start getting regular data on a lot of states that usually don’t get polled.
As usual, most of the updates didn’t change the status of the model, but a few did, and all of these moves this time were toward Trump. Lets take a look state by state:
Arizona [11 EV]
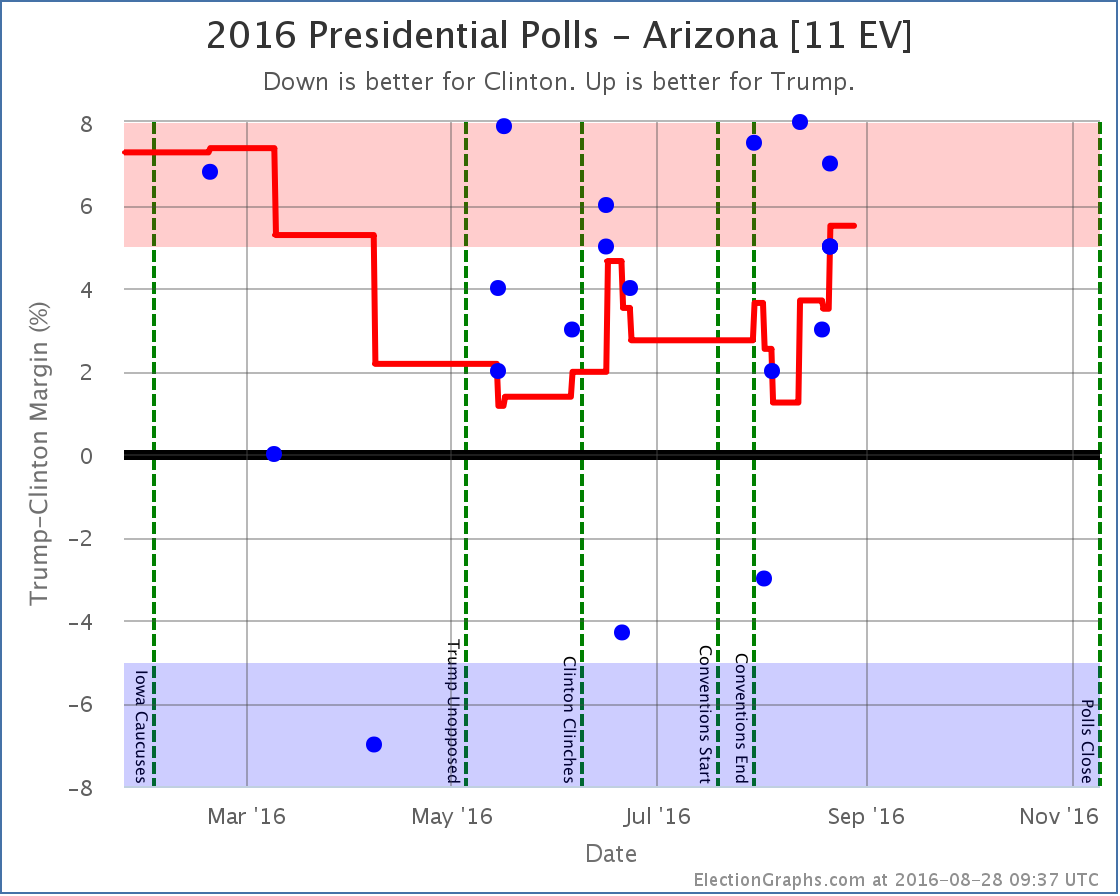
Ever since April Arizona has been looking like a possible target for Clinton… Trump ahead, but with only a narrow lead that Clinton might be able to flip. With the latest updates, Trump’s lead in the average increases to 5.5%, so we take it out of that category. The notion of a blue Arizona slips away from Clinton.
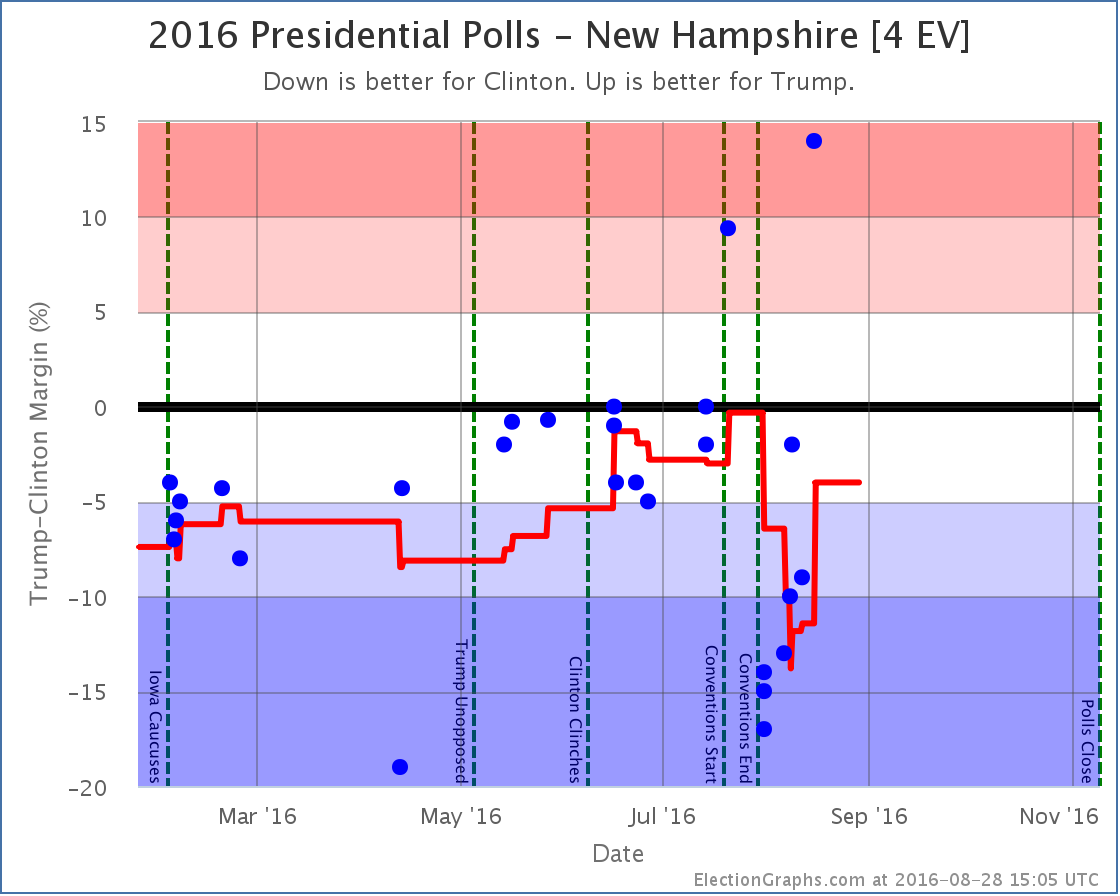
New Hampshire [4 EV]
Honestly, it looks like an outlier, but the most recent of those Reuters/Ipsos results I mentioned show Trump with a huge 14% lead in New Hampshire. The second best number in the average shows Clinton up by 2%, and that is also from Ipsos. All the other recent numbers in New Hampshire show a Clinton lead of at least 9%, and there has been no radical change in the campaign that would indicate a huge swing would be expected.
If these two Ipsos data points are really outliers, then new polls should quickly show that. For the moment though, the average moves to only a 4.0% Clinton lead due to the two Ipsos data points, so New Hampshire is once again categorized as a state Trump has a chance in.
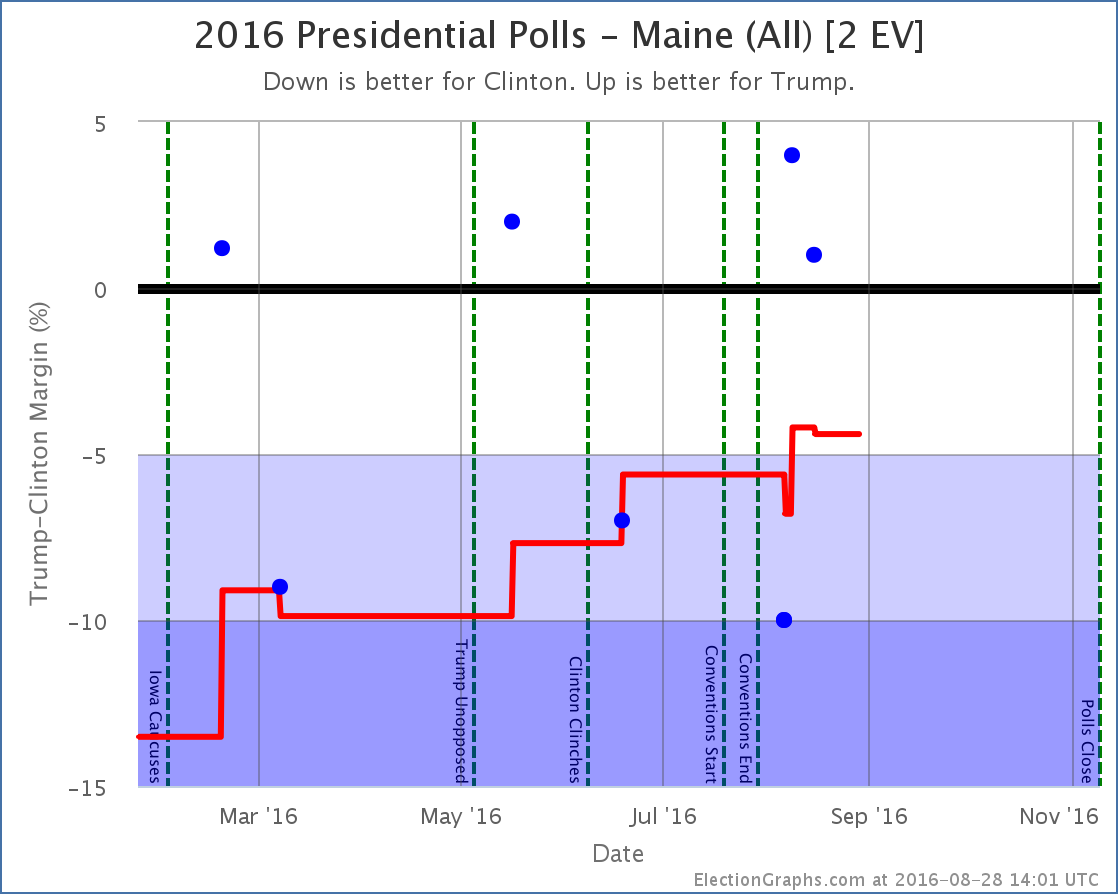
Maine (All) [2 EV]
Maine has been pretty sparsely polled this Election cycle, but what polls we do have show the state trending away from being a solid blue state to being close. The latest couple of results (both Ipsos) have Trump ahead, as have a few previous polls. The average is now only a 4.4% Clinton lead, so Maine is now in the “Weak Clinton” category, and it is included in Trump’s best case.
Now, Maine is one of the two states that splits electoral votes. For winning Maine at large, you only get 2 electoral votes. You then get 1 electoral vote for winning each congressional district. Now, mathematically, for Maine as a whole to have a 4.4% lead for Clinton, Trump would have to be doing even better than that in one of the two congressional districts. But right now the average in CD-1 is a 15.8% Clinton lead and in CD-2 it is a 5.3% Clinton lead. That can’t be! You would expect CD-2 to be Weak Clinton as well, or possibly even Weak Trump.
The problem is that while there has been very limited polling of Maine as a whole, there has been even less polling of Maine at a Congressional District level. There has only been ONE poll of Maine CD-2 this election cycle. It was in June and showed Trump up by 1%. The average is 5.3% Clinton because in order to fill out the average when there are less than five polls, I use previous election results.
New polling in Maine CD-2 is currently what I classify as the “Most Needed Poll” (followed be NE-2, NE-1, ME-1 and SD). Right now we don’t have enough polling evidence to show that CD-2 is actually Weak Clinton or Weak Trump rather than Strong Clinton, but given where Maine as a whole is, the ME-2 electoral vote has to be a possible pick up for Trump too, but it won’t be categorized that way here until there are enough polls backing that up directly.
National View
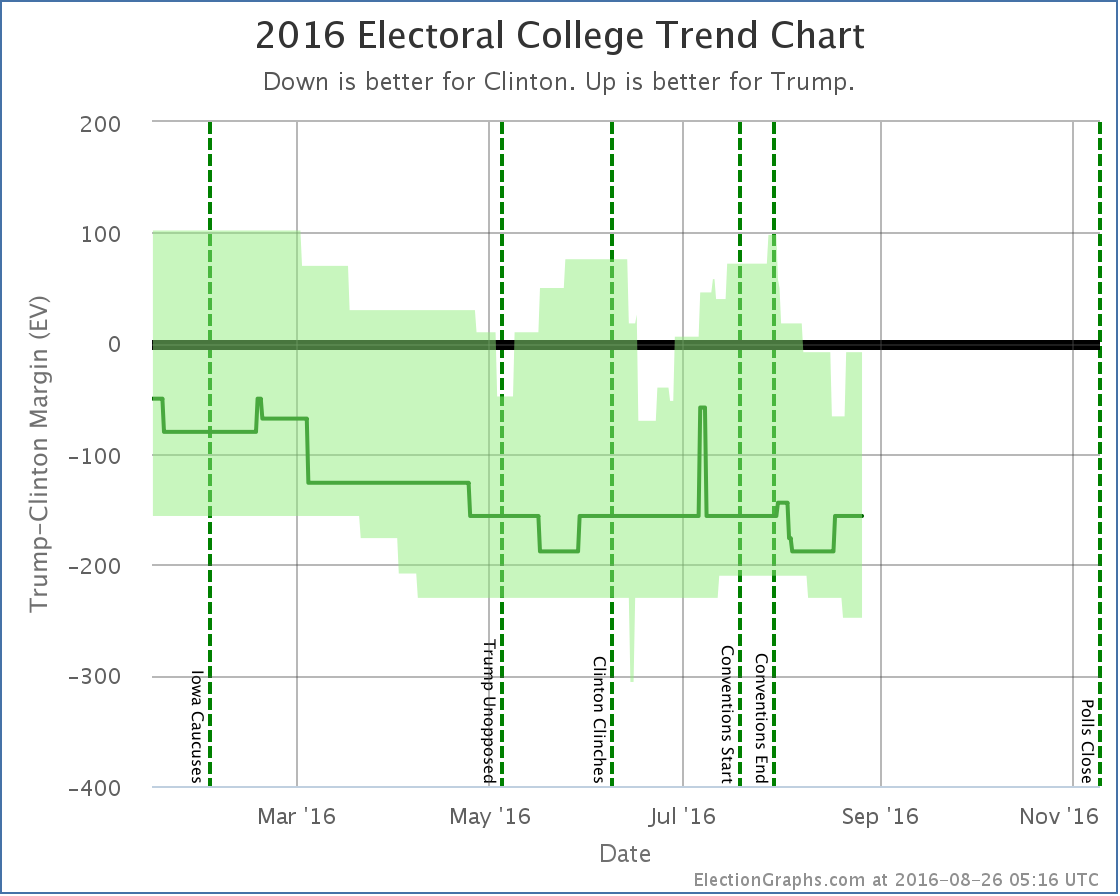
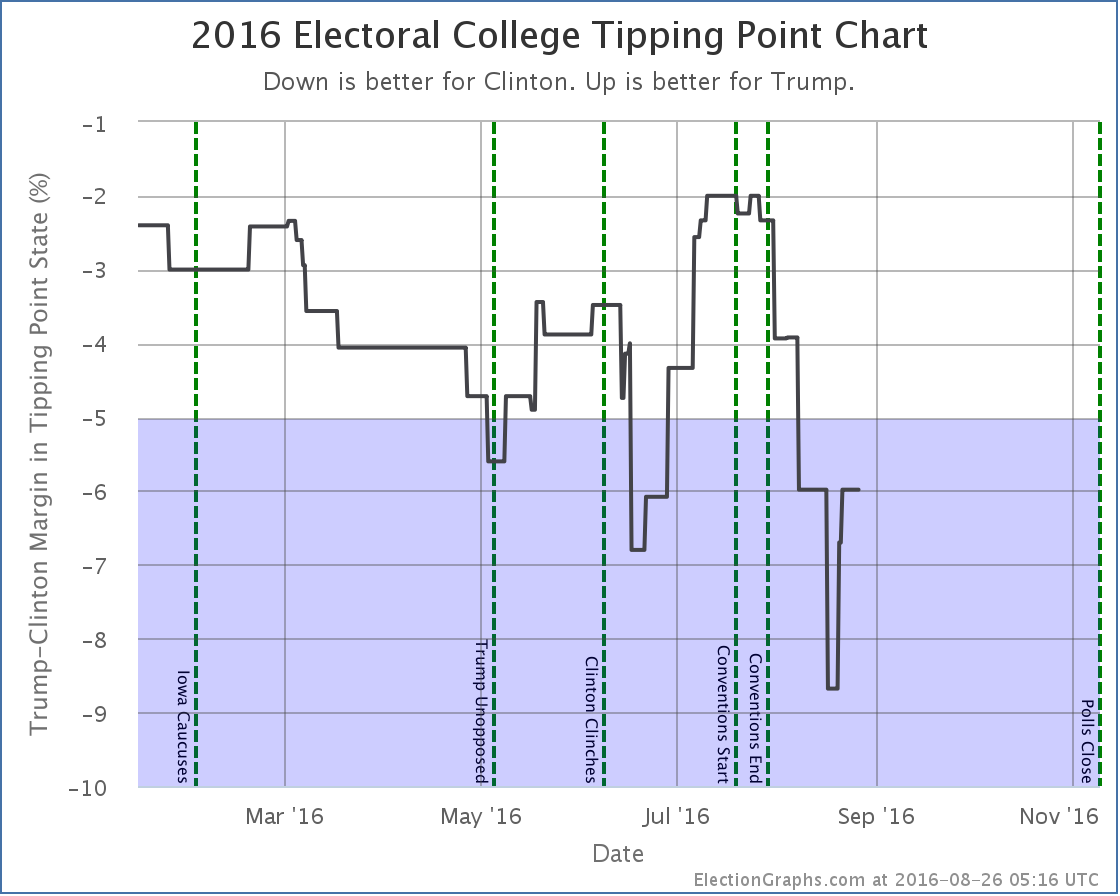
Before showing the new national trend chart and tipping point charts, a quick note. In addition to the new polls added in the most recent batch, I found a handful of older polls that I had somehow missed earlier in the year. These don’t change the current picture, but they change the past. Specifically, Trump’s position in the spring was significantly weaker than it looked at the time, mainly because Florida would have slipped out of his reach significantly earlier.
To be transparent on this change, rather than just show the new charts, I’ll show the before and after due to today’s update. First the trend chart as it appeared on Election Graphs as of the August 26th update post:
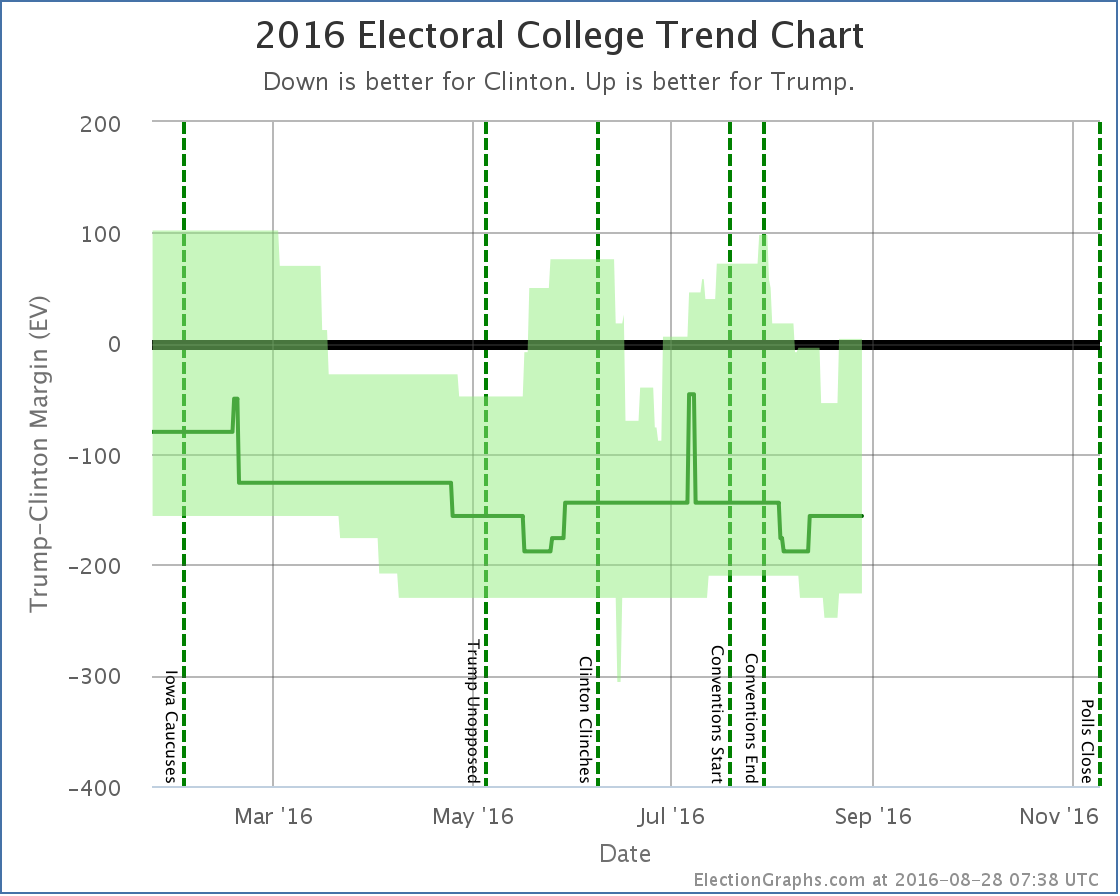
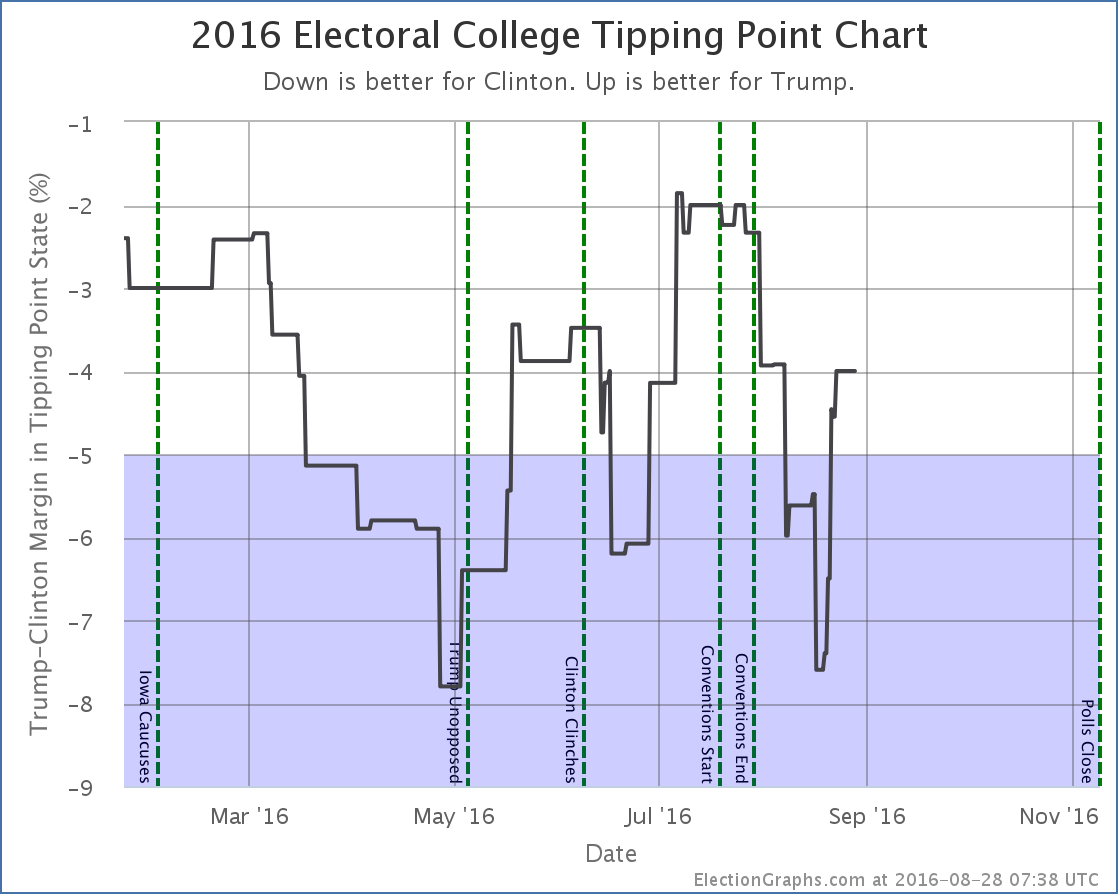
And here it is now:
Note that in addition to the bumps upward in Clinton and Trump’s current best cases, Trump’s best case in the spring is significantly depressed, enough so that his best case moved from a narrow win in most of April to a narrow loss. There are some other subtle differences between these two caused by the addition of these old polls I had missed at the time, but that is the big one, caused essentially by one March poll in Florida that I did not see until August. Apologies for that.
The difference in the tipping point graph is even more dramatic, with Florida worse for Trump than it previously looked, there was a lot more room for the tipping point to wiggle, and it was a lot worse during the spring than it looked.
Again the main impact is that the “missing polls” that I added make it clear that Trump was significantly worse off in the spring than I had shown at the time. In fact, it means that at the end of April he was actually below his recent bottom in mid-August.
There were only a handful of polls missed, but this goes to show that even with poll averaging, individual polls in critical states can make a big difference in the overall picture. (Especially when they appear to be outliers, such as the one Florida poll I missed that made the biggest difference. Oops.)
OK, enough hand wringing about things that may have been missed in the spring.
The big current news on the tipping point is that with changes in the averages in Michigan, New Hampshire, and Ohio, the tipping point comes roaring back in Trump’s direction. In this update it moves from a 6.0% Clinton lead in Connecticut to a 4.0% Clinton lead in New Hampshire, but this is a full 3.6% swing toward Trump since his low of 7.6% about 10 days ago.
Now, everything above still shows a Trump loss, but it is looking a lot closer than it did a couple weeks ago. The first part of August was disastrous for Trump, but he has been bouncing back since then. He is still very far behind, but maybe his latest reworking of his campaign is working. His best case is once again to win, although by a very narrow 4 electoral vote margin.
Will the recent trend continue and make this race look even closer? 72.2 days left for him to do it.
Notice on Methodology: In my August 13th update I solicited opinions on possibly changing how this site deals with the case when a pollster releases multiple results from a single poll. See the discussion in that comment thread for more details. Immediately after this post goes live I will be working to change the site logic so that if two results are released from a poll, each counts as only half a poll for purposes of the averages here. Similar logic will apply to tracking polls where samples overlap, but not completely, with polls weighted to reflect the fraction of the new result that is actually from a fresh sample.
As examples of the impact this could have, the three states mentioned in this post would change as follows: Arizona is a 5.5% Trump lead (Strong Trump) with the current logic, it would be a 3.9% Trump lead (Weak Trump) with the new logic. New Hampshire would move from a 4.0% Clinton lead (Weak Clinton) to a 8.4% Clinton lead (Strong Clinton). Maine (All) would move from a 4.4% Clinton lead (Weak Clinton) to a 3.7% Clinton lead (Weak Clinton). With these three examples, two of the changes favor Clinton, and one favors Trump.
At this point I will not be adding new polls to the averages until the math changes are complete and I have reported on the results with a blog post. (Unless my revisions fail and I’m forced to reschedule for another weekend.)
[Note added 21:39 UTC – Actually, as I’m starting in, I realize that tracking polls have a bunch of extra complications that multiple results in a single poll don’t have, so I’ll leave them alone and treat them as if they were completely independent for now. Without weighting tracking polls, the changes above would now be: AZ Trump +5.5% -> Trump +3.1%, NH Clinton +4.0% -> Clinton +4.0% (No change), ME-All Clinton +4.4% -> Clinton +2.0%.]
Note: This post is an update based on the data on ElectionGraphs.com. Election Graphs tracks both a poll based estimate of the Electoral College and a numbers based look at the Delegate Races. All of the charts and graphs seen in this post are from that site. Additional graphs, charts and raw data can be found there. Follow @ElectionGraphs on Twitter or like Election Graphs on Facebook to see announcements of updates or to join the conversation. For those interested in individual general election poll updates, follow @ElecCollPolls on Twitter for all the polls as they are added. If you find the information in these posts interesting or useful, please consider visiting the tip jar.
New polls since last update: Texas (x2), Arizona, Iowa, New Hampshire, Ohio, Pennsylvania, Wisconsin.
Well, that didn’t last long. Less than a week ago the polling average in Arizona moved to the blue side of the center line. With today’s update, Arizona is once again tinted the more familiar red color.
One of the two polls showing Clinton leading in Arizona falls off the average, and so it rises to a 1.7% Trump lead. Arizona is still looking close, which is itself remarkable given the electoral history there, but once again it is on the Trump side of the line.
The “expected case” where each candidate wins all the states where they lead in the poll average, no more, no less, now sits at Clinton 323, Trump 215. This is a 108 electoral vote win for Clinton. We are back where we were in mid-March.
With this scenario, Trump is still losing, but not by as much as either Romney (126 EV loss) or McCain (192 EV loss).
So to repeat a theme I have touched on a number of times before, yes, Trump is behind here. Clinton is winning. But we are NOT seeing a historically bad Republican candidate. Trump is actually doing better than his immediate predecessors at the moment.
And compared to both two months ago and one month ago, he is still up or flat on all four metrics tracked here at Election Graphs, not in the midst of and epic collapse. Or, at least, there isn’t one in evidence yet at the state level. If anything, it looks like he is still in the process of recovering from the collapse in support he did indeed see during the months the primaries were in full swing.
133.2 days until the polls start to close.
Note: This post is an update based on the data on ElectionGraphs.com. Election Graphs tracks both a poll based estimate of the Electoral College and a numbers based look at the Delegate Races. All of the charts and graphs seen in this post are from that site. Additional graphs, charts and raw data can be found there. Follow @ElectionGraphs on Twitter or like Election Graphs on Facebook to see announcements of updates or to join the conversation. For those interested in individual general election poll updates, follow @ElecCollPolls on Twitter for all the polls as they are added. If you find the information in these posts interesting or useful, please consider visiting the tip jar.
Since the last update there have been new polls in Arizona, Washington, Illinois, Iowa, Florida, Ohio, Pennsylvania, and Utah. The latest ones in Pennsylvania, Arizona and Utah made differences to the Electoral Graphs model. Two of these moves favored Trump, but one favored Clinton.
We’ll cover them in order of how many electoral votes each state has.
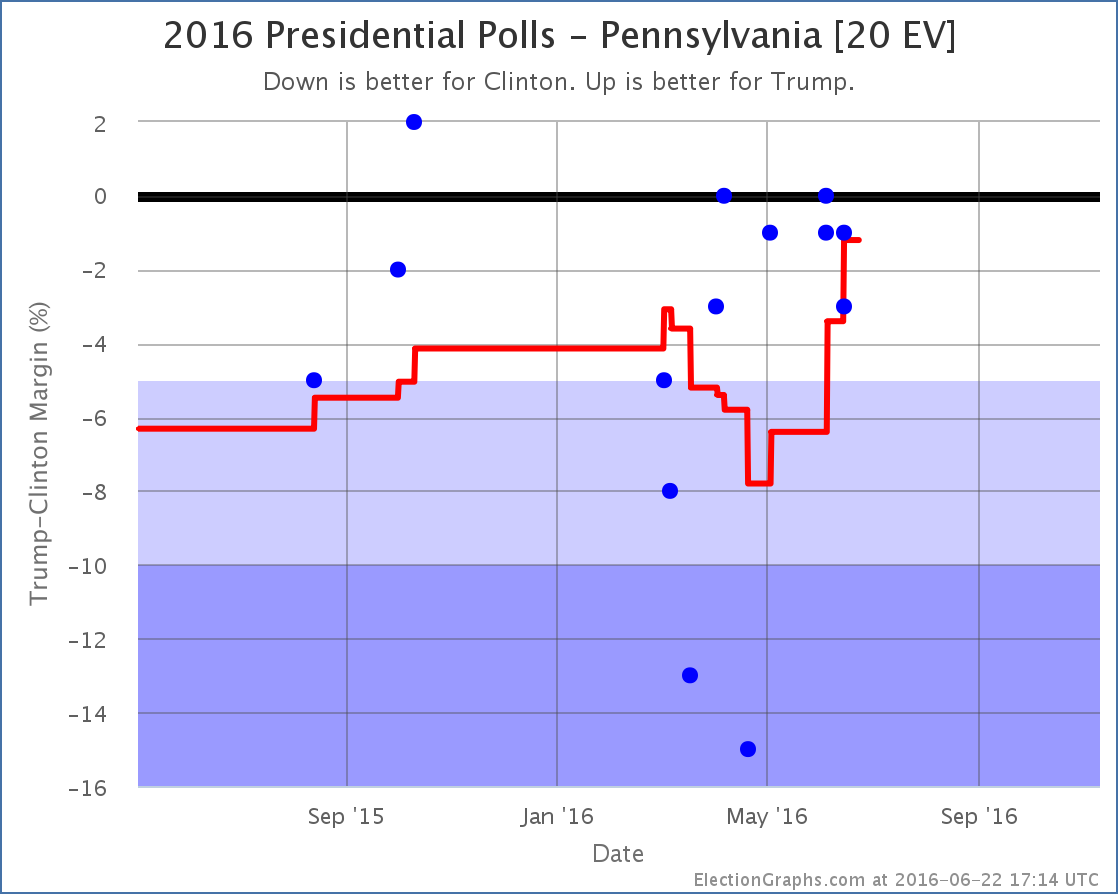
Pennsylvania (20 EV)
The polling average moves from Clinton by 3.4% to Clinton by 1.2% as a really good poll for Clinton (15% lead) from April rolls off the average, replaced by polls showing a close race. The state doesn’t change categories, it is still a “Weak Clinton” state, but this continues the Trumpward movement in Pennsylvania, and since Pennsylvania was the tipping point state, it moves the tipping point in Trump’s direction:
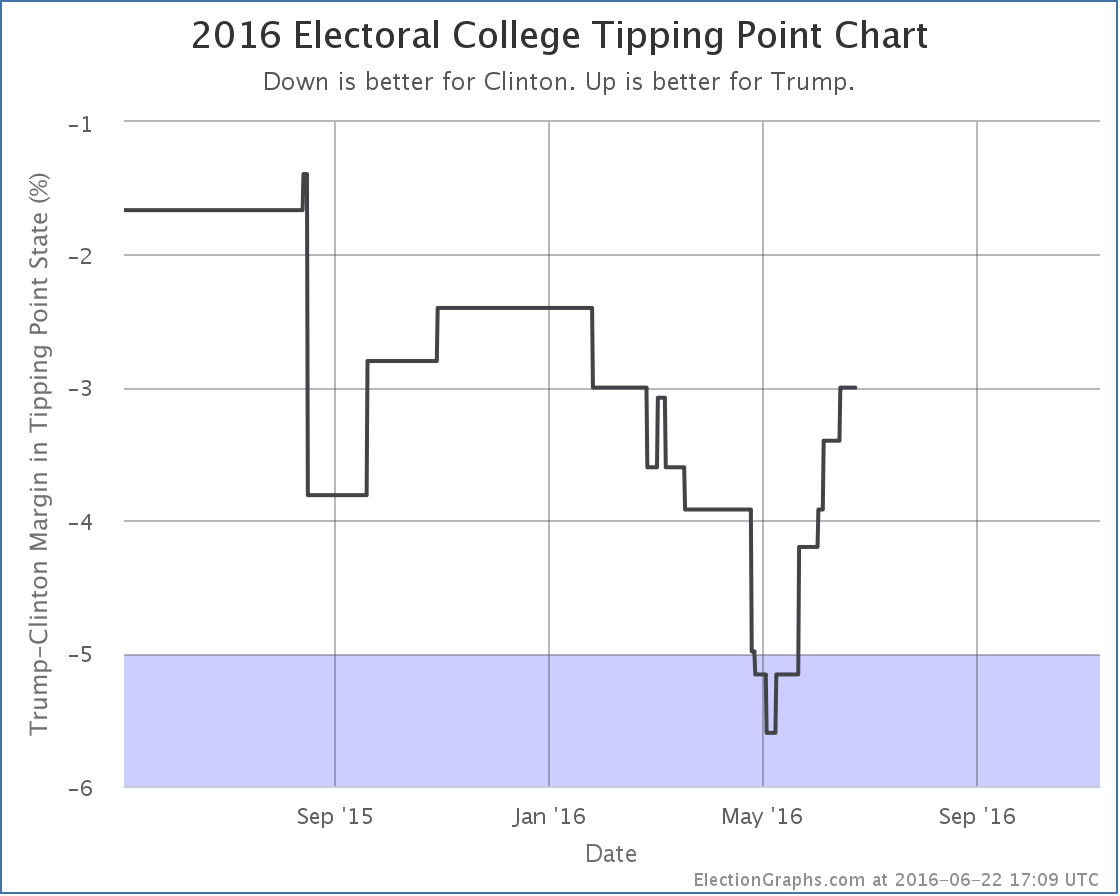
On the tipping point metric, Trump has been improving consistently since the beginning of May. This despite the continued downward trend in the national numbers. As I discussed last time, this has happened in enough states at this point that it seems like it may be a real thing. Trump is getting closer in some states, while simultaneously falling further behind nationally.
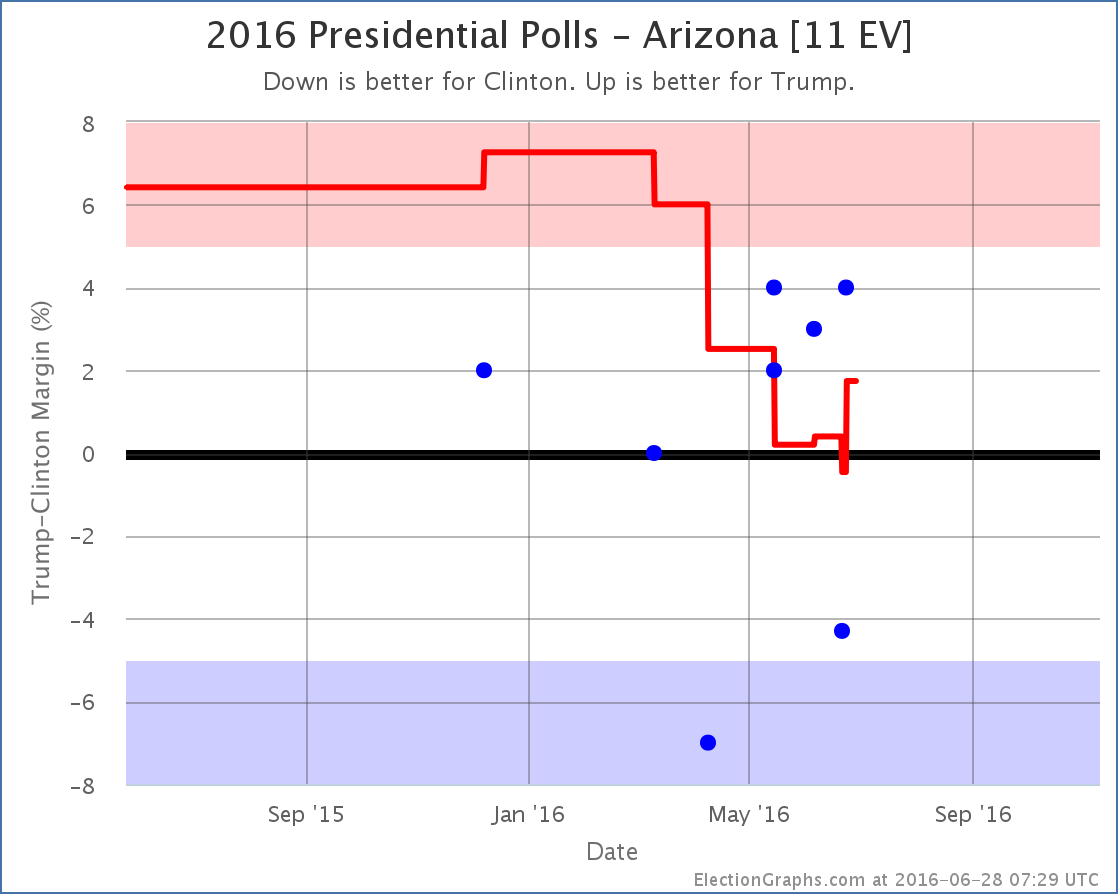
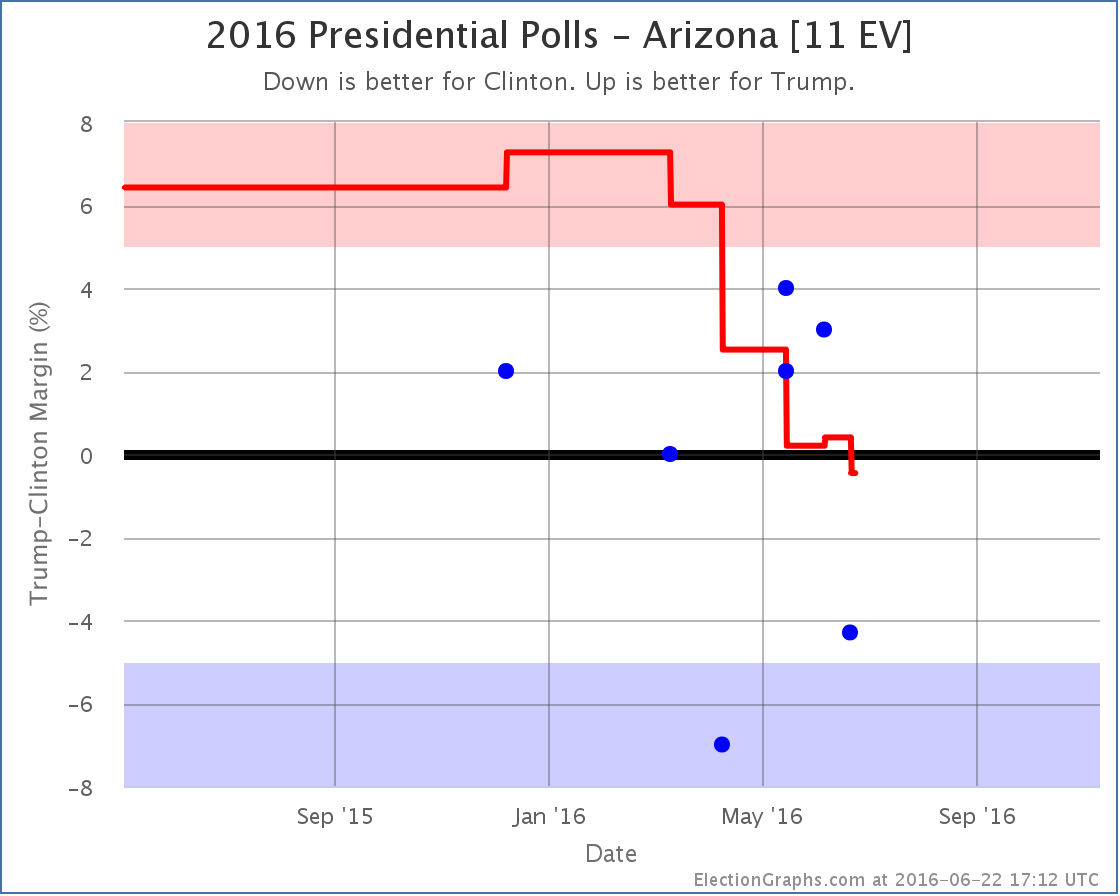
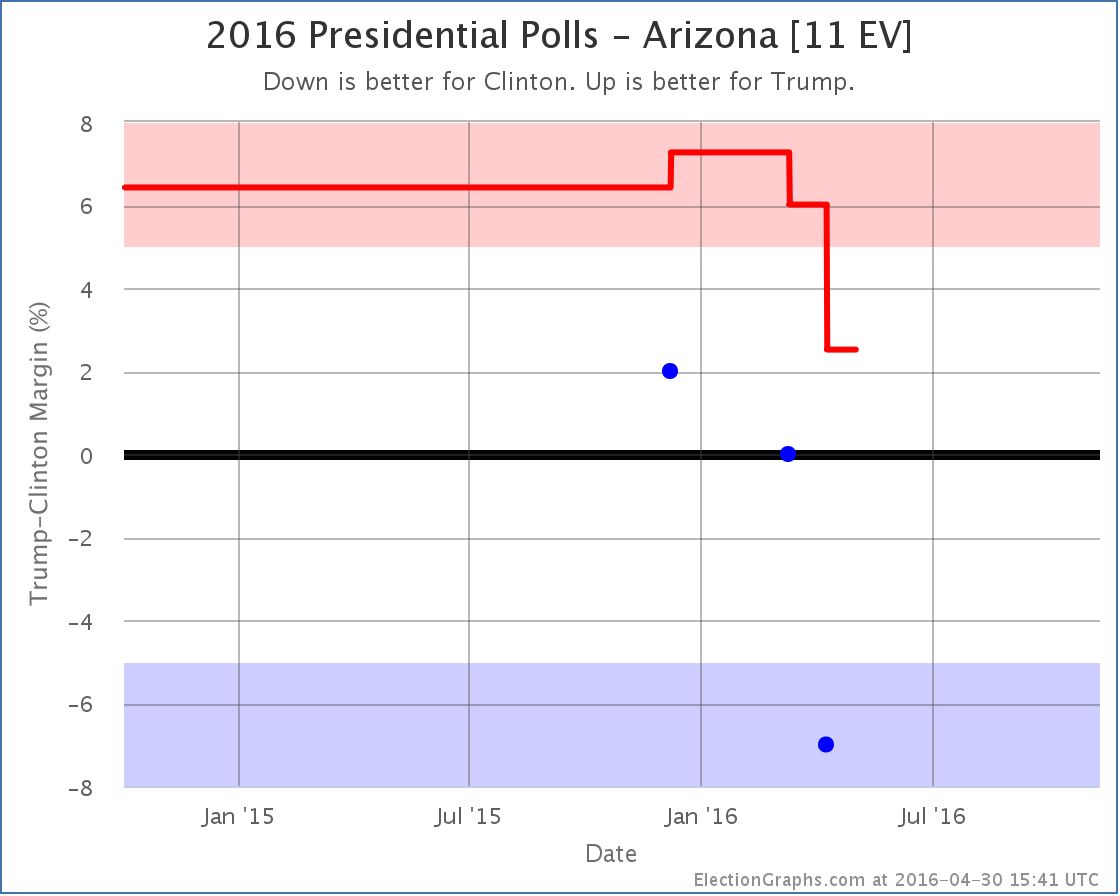
Arizona (11 EV)
While the tipping point was moving toward Trump, Arizona has been moving toward Clinton. With the latest updates, Arizona moves from an 0.4% Trump lead to a 0.5% Clinton lead. Either way, Arizona is currently looking like a state that could go either way. But for the first time this cycle, Arizona is now on the blue side of the line. Arizona hasn’t gone Democratic in a presidential election since 1996. That isn’t as long as a state like Utah, but it is still quite some time, and it is remarkable that the poll average is showing Democrats with a lead, no matter how small.
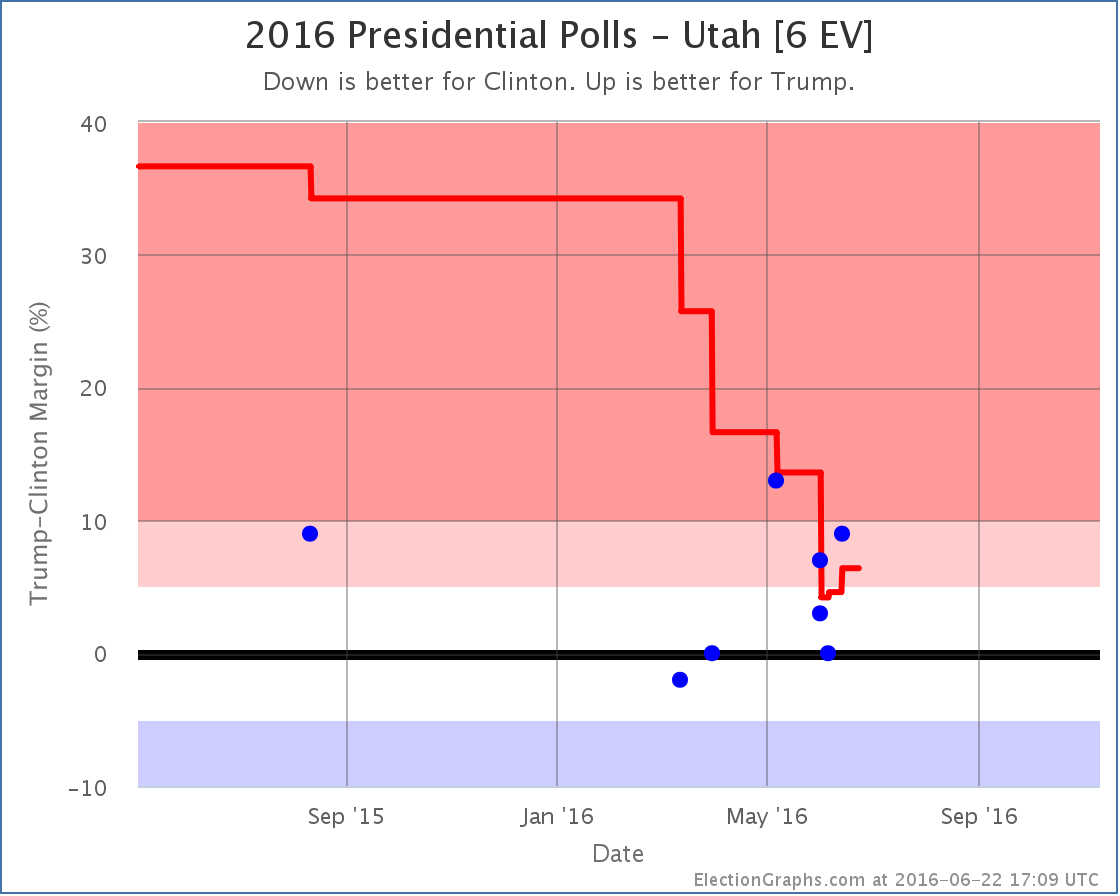
Utah (6 EV)
Meanwhile, as Arizona dips into the blue, Utah, which had briefly dropped into the competitive zone, once again looks a little stronger for Trump, and thus moves out of the category that could go either way. Having said that, we’re still looking at the smallest Republican margin in Utah in many decades. Just not quite as narrow as it looked.
National Summary
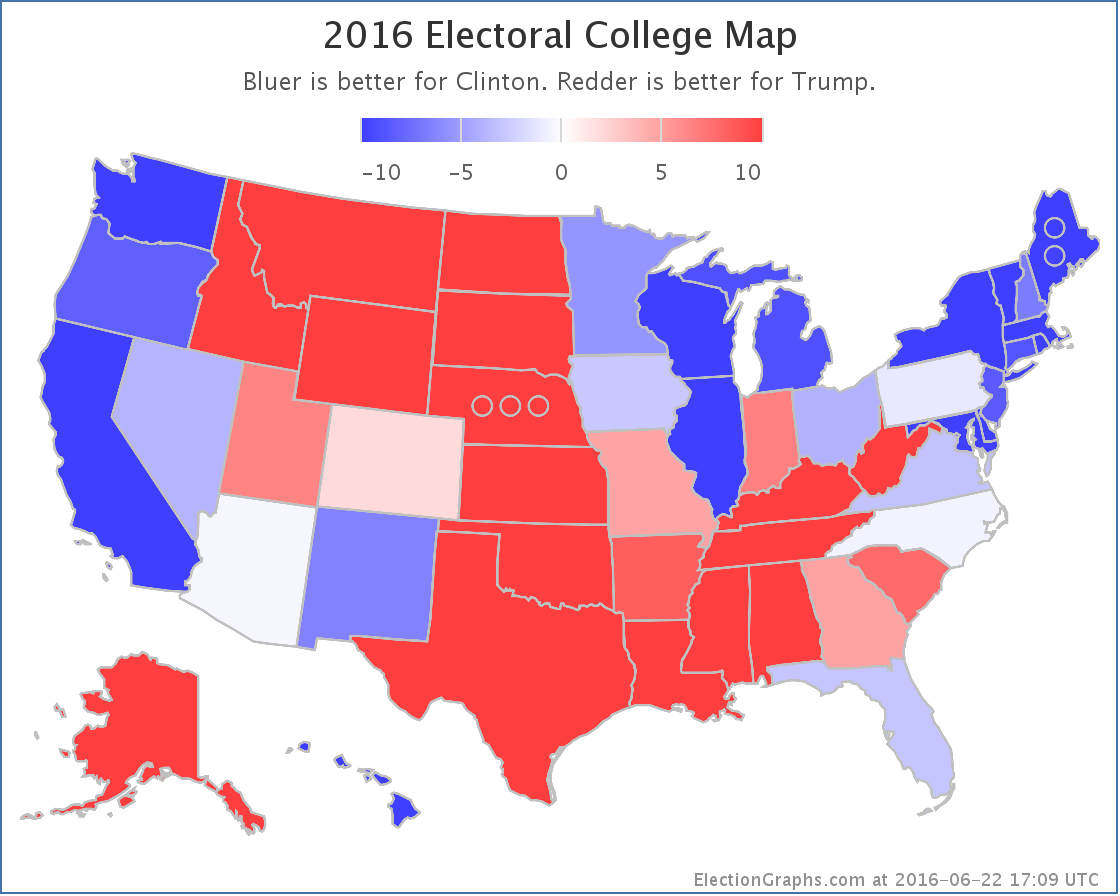
With Arizona flipping to the blue, improving the expected case for Clinton, and Utah pulling back out of the competitive zone, reducing Clinton’s best case, the national map now looks like this:
The center of the spectrum of the states (excluding the solid states where one candidate leads by more than 10%) looks like this:
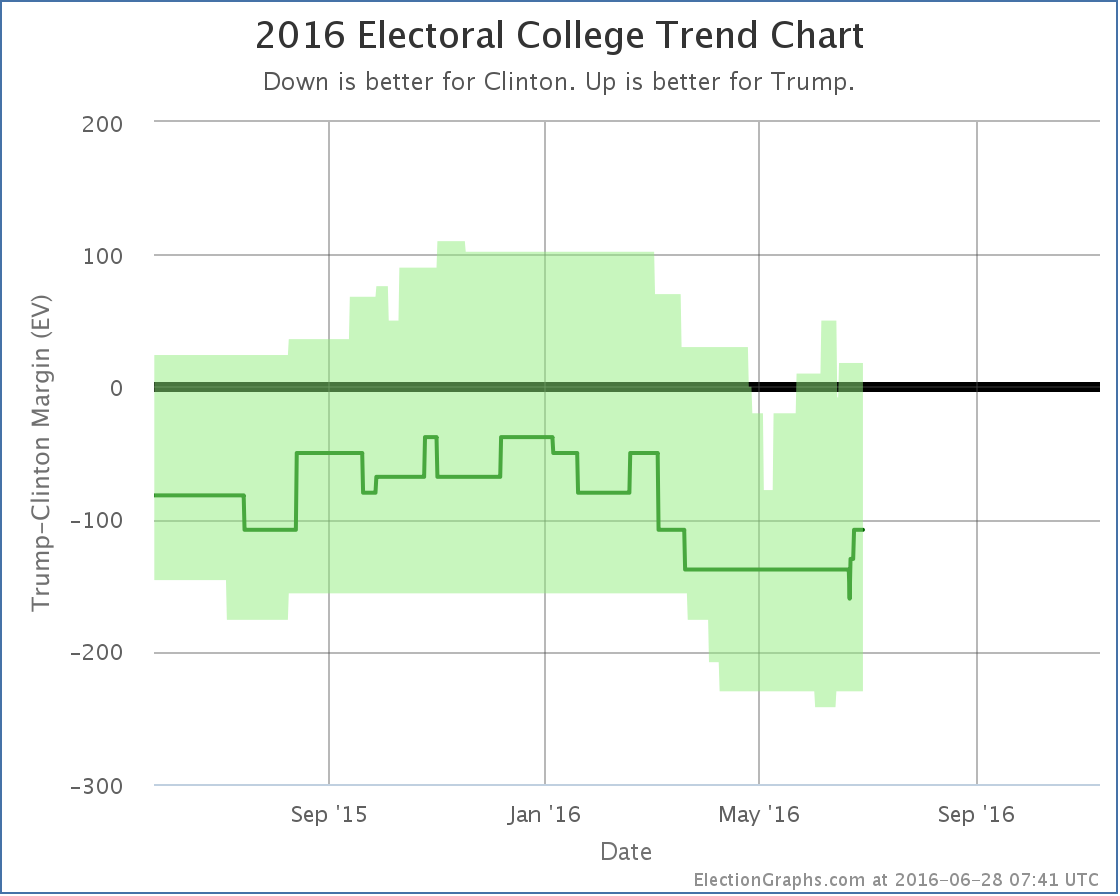
And the trend bubble…
It is hard to call a trend on this.
Look at the center line (the expected case) and every move since February has been toward Clinton.
Look at the top of the bubble (Trump’s best case) or the tipping point (see chart earlier in this post) and every move since early May has been toward Trump.
Look at the bottom of the bubble (Clinton’s best case) and things were moving toward Clinton until June, then started moving back toward Trump.
And of course the national polls have been moving toward Clinton for awhile now.
So what is really the trend? Well, all of them. They measure different things. Clinton’s absolute electoral college and popular vote leads are growing. But Trump is making more states close, which means his best case is improving, and the tipping point is getting closer. While meanwhile, for the moment anyway, Clinton’s best case may have hit a ceiling and be bouncing off it.
It is more complex than just looking at which direction a single number is going.
But in the end, if you have to look at only one number, it is probably the “expected” line. To win, Trump has to make that line move upward. It hasn’t been going that way for months, and it has never shown a Trump win.
Trump has 138.7 days to change that.
Note: This post is an update based on the data on ElectionGraphs.com. Election Graphs tracks both a poll based estimate of the Electoral College and a numbers based look at the Delegate Races. All of the charts and graphs seen in this post are from that site. Additional graphs, charts and raw data can be found there. Follow @ElectionGraphs on Twitter or like Election Graphs on Facebook to see announcements of updates or to join the conversation. For those interested in individual general election poll updates, follow @ElecCollPolls on Twitter for all the polls as they are added. If you find the information in these posts interesting or useful, please consider visiting the tip jar.
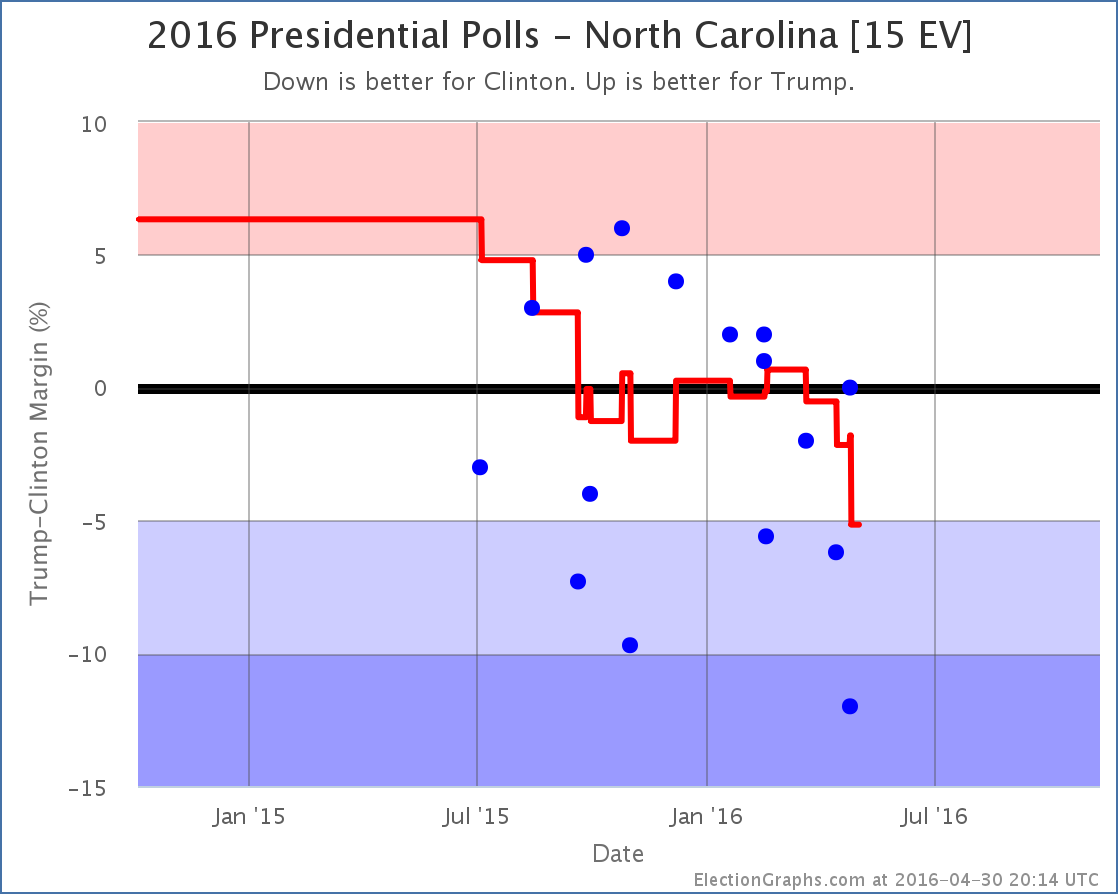
Since the last post here on the Electoral College back on April 19th there have been new polls in Maryland, Wisconsin, North Carolina (x3), Pennsylvania, New Hampshire, Indiana, and Arizona. Today the latest in Arizona and North Carolina make a difference to the ElectionGraphs.com estimates. There are two state category changes for Clinton vs Trump and one for Clinton vs Cruz. All three of these changes favor Clinton.
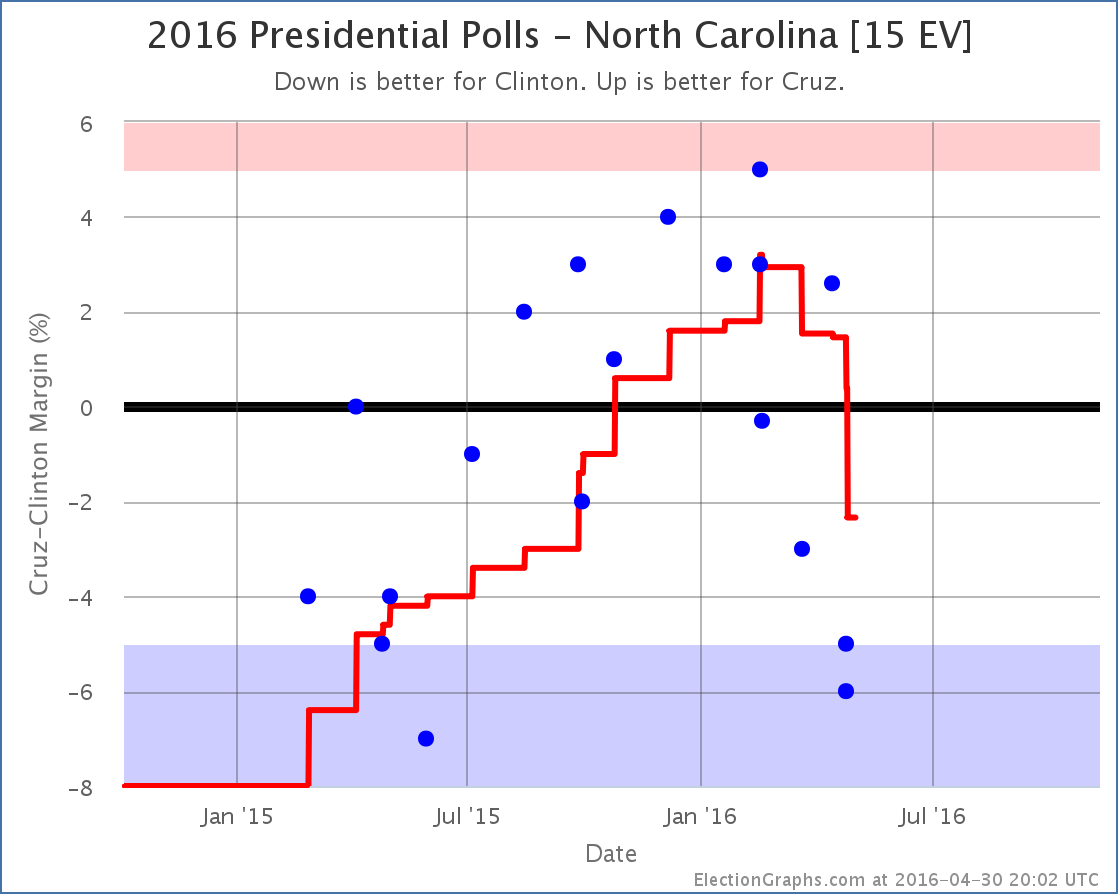
For quite a few months, the Clinton vs Trump poll average in North Carolina just bounced back and forth between Clinton and Trump. But as of now, the best Trump has done in the five most recent polls is a tie. The average has been trending downward since mid-March. The average is now a 5.2% Clinton lead. With that, North Carolina moves from “Weak Clinton” to “Strong Clinton”. This makes North Carolina blue enough that it isn’t considered a possible Trump pick up in the model any more.
Arizona has been very lightly polled. There have only been three polls of Clinton vs Trump so far. So the average still includes the 2008 and 2012 election results. Each of the polls so far has been worse than the last for Trump though. The average now is only a 2.5% lead for Trump. With that, it is a “Weak Trump” state that is within reach for Clinton.
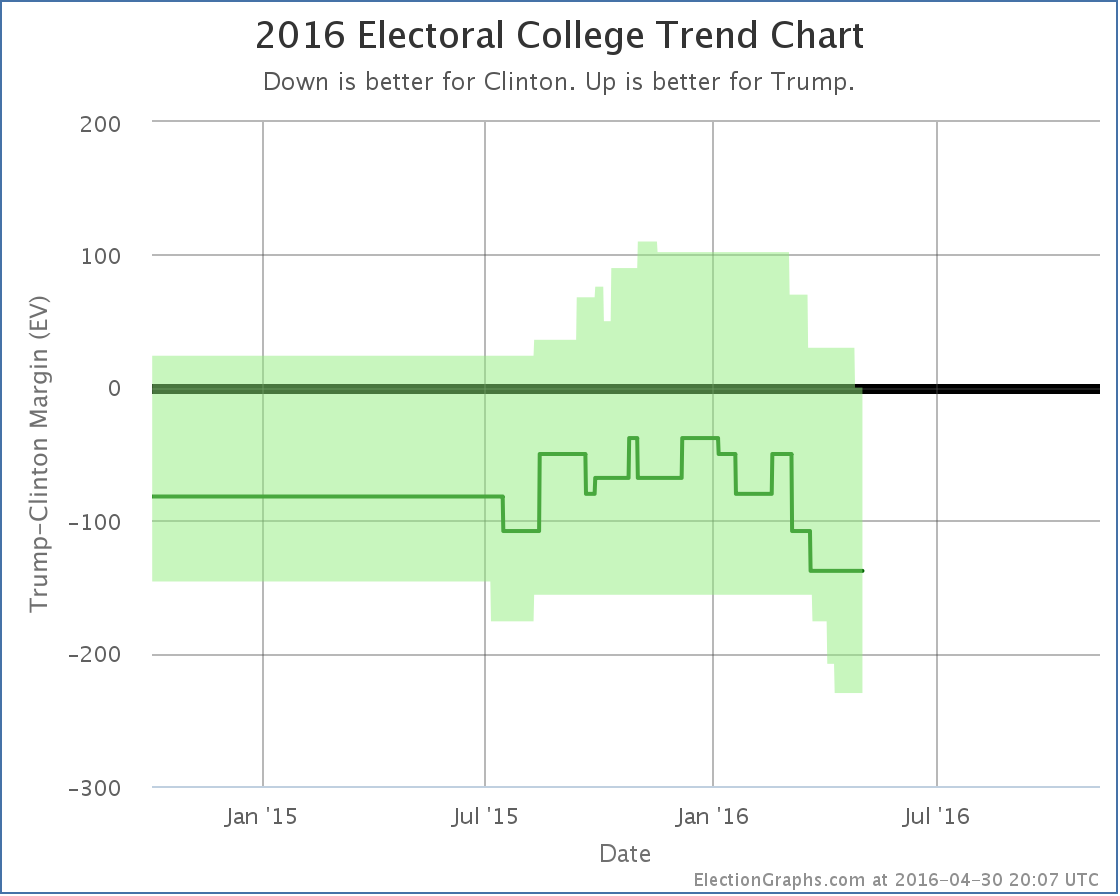
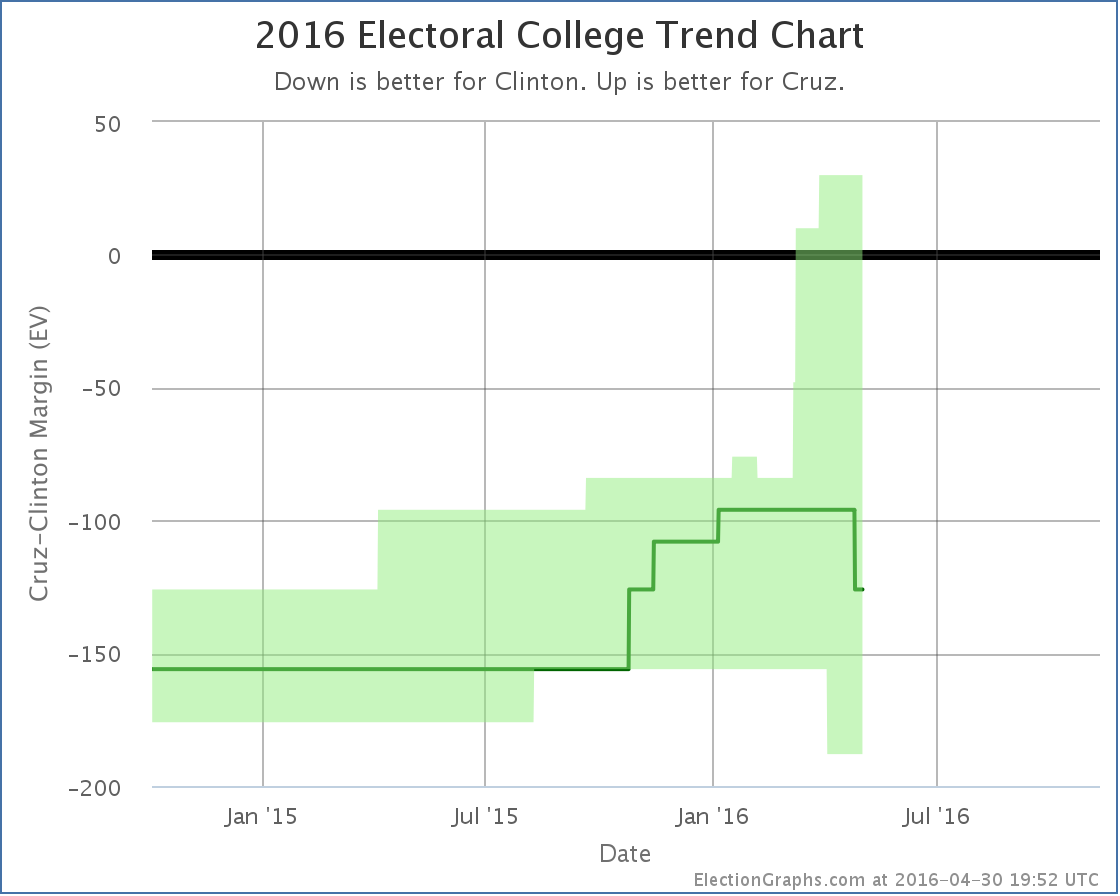
With these two changes, the overall trend in the expected range of possibilities looks like this:
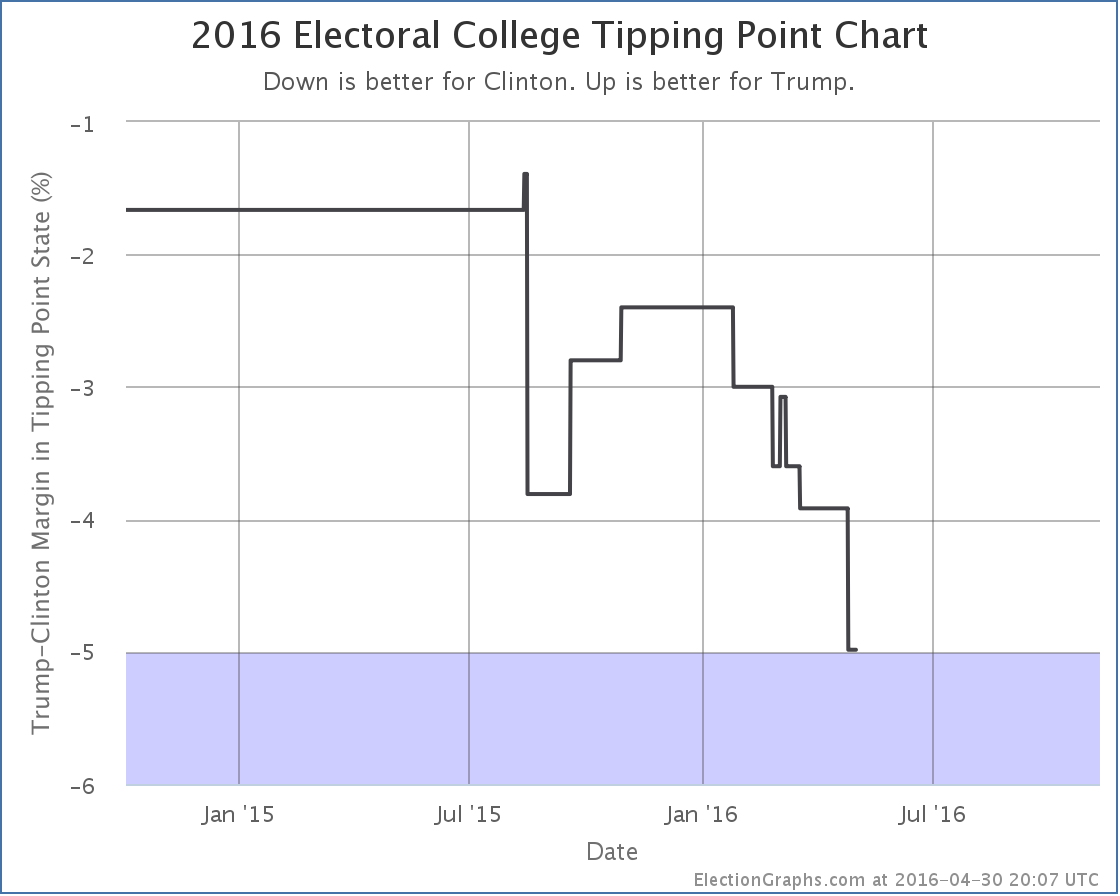
With North Carolina’s movement, the tipping point moved in Clinton’s direction as well:
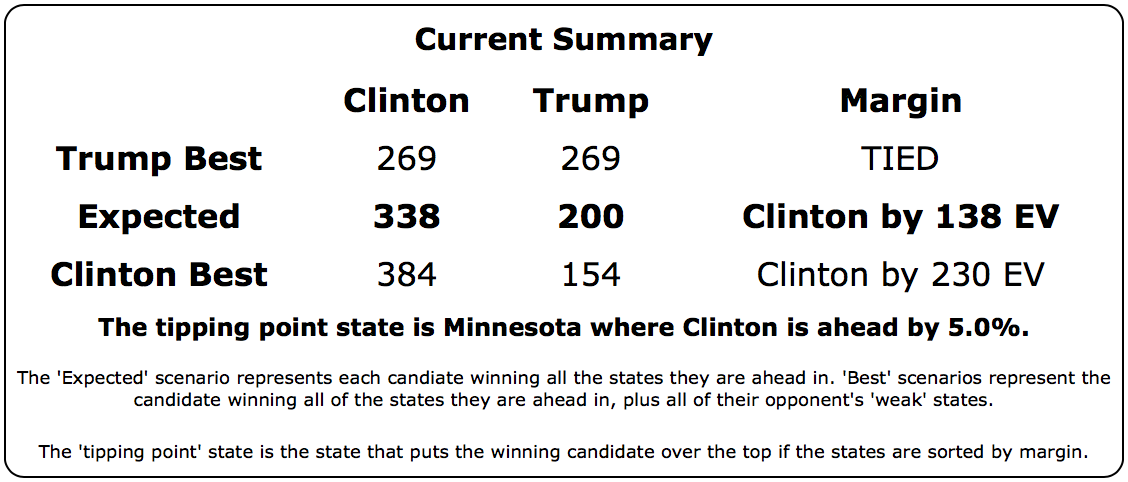
The downward trend that started around the New Year for Trump is continuing. The current summary now looks like this:
Yes, Clinton’s best case is better than it was with Arizona as a possible pickup.
But look at Trump’s current best case.
It is a 269 to 269 electoral college tie.
Can you even imagine a Clinton vs Trump race thrown into the House of Representatives? Wow.
Of course that won’t happen. But just like a contested convention, an electoral college tie is the kind of thing that gets political junkies excited. :-)
The bottom line on Clinton vs Trump is that after peaking around the New Year, Trump has been declining ever since. He is now at the point where if you give him not only all the states he is ahead in, but also the ones where Clinton is ahead by less than 5%, he only gets to a tie.
Things will undoubtedly change as both parties transition from primary mode to general election mode. The primary season has been very bad for Trump in terms of general election polling. The types of things he has been saying and doing that are winning him the Republican nomination are at the same time souring the general election voter against him.
The question is if he can turn that around once he is the official nominee. (Assuming nothing surprising happens to stop that of course.)
Clinton vs Cruz
Oh yeah, Cruz is still in this too.
Cruz had been doing better and better in North Carolina. Until mid-March. Since then things have been moving against him. With this update, the lead in the state flips back to Clinton. This moves Cruz’s “expected case”:
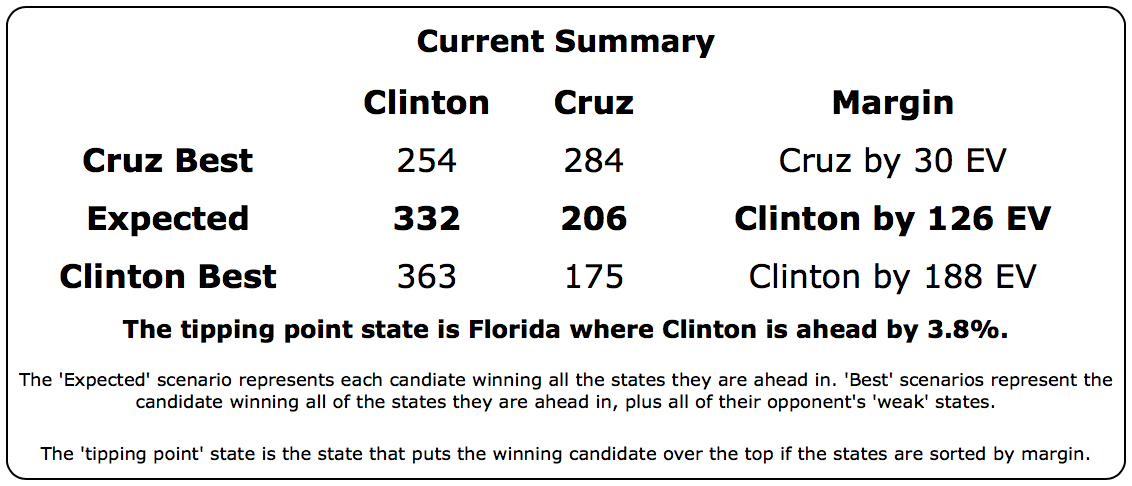
The new summary looks like this:
Notice that in all four of the key metrics, the expected case, the two best cases, and the tipping point, Cruz is doing better than Trump against Clinton.
Of course, Trump is on track to be the nominee and Cruz is not, absent some sort of coup at the convention via a rules change, a last minute Trump implosion, or something like that. Republican voters do not seem to be prioritizing “electability” this time around.
191.8 days until polls start closing on election day though. A lot will change between now and then. So we shall see…
Note: This post is an update based on the data on ElectionGraphs.com. Election Graphs tracks both a poll based estimate of the Electoral College and a numbers based look at the Delegate Races. All of the charts and graphs seen in this post are from that site. Additional graphs, charts and raw data can be found there. All charts above are clickable to go to the current version of the detail page the chart is from, which may contain more up to date information than the snapshots on this page, which were current as of the time of this post. Follow @ElectionGraphs on Twitter or like Election Graphs on Facebook to see announcements of updates or to join the conversation. For those interested in individual general election poll updates, follow @ElecCollPolls on Twitter for all the polls as they are added.
[Update 04:10 UTC to add the “Maybe everything is going Trump’s way…” sentence.]
[Update 04:52 UTC to add in some inexplicably missing words where a sentence stopped before it was complete.]
When I did my last update there hadn’t been any recent polls in either Arizona or Utah, but the results there ended up matching pretty well with the results of the few polls that came out since then. Namely, Trump won Arizona which was straight up winner take all, and Cruz got over 50% in Utah, so he got all of the delegates there.
So the net for the night was Trump +58, Cruz +40.
Adding in other delegate adjustments since the March 15th results we have a net change of:
Trump +62, Cruz +43, Rubio -3
So effectively, Trump got 60.78% of the delegates since the last update. He only needed 53.07% to improve his position.
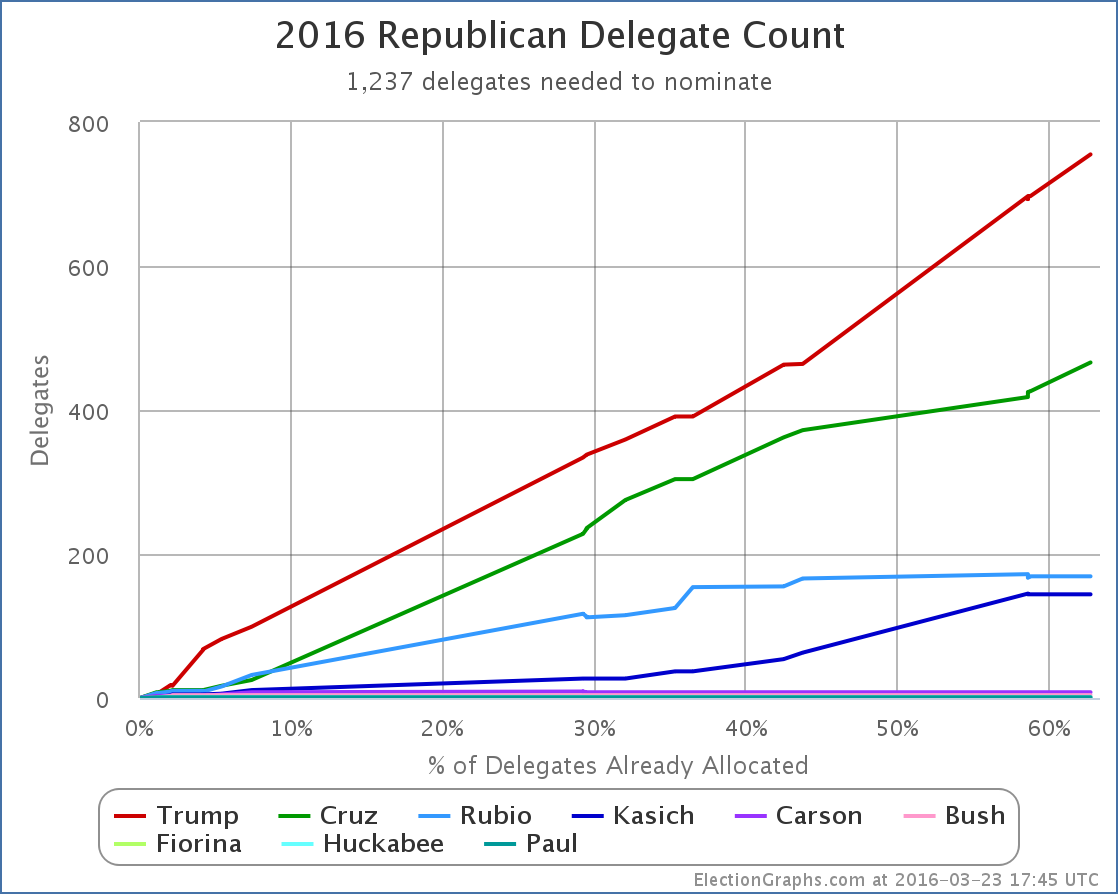
So what does this look like?
The raw delegate count is now Trump 755, Cruz 466, Rubio 169, Kasich 144, Carson 8, Bush 4, Fiorina 1, Huckabee 1, Paul 1
Trump’s pace of delegate accumulation actually looks like it has accelerated, while everybody else has slowed down.
But the raw delegate counts are not the right thing to look at.
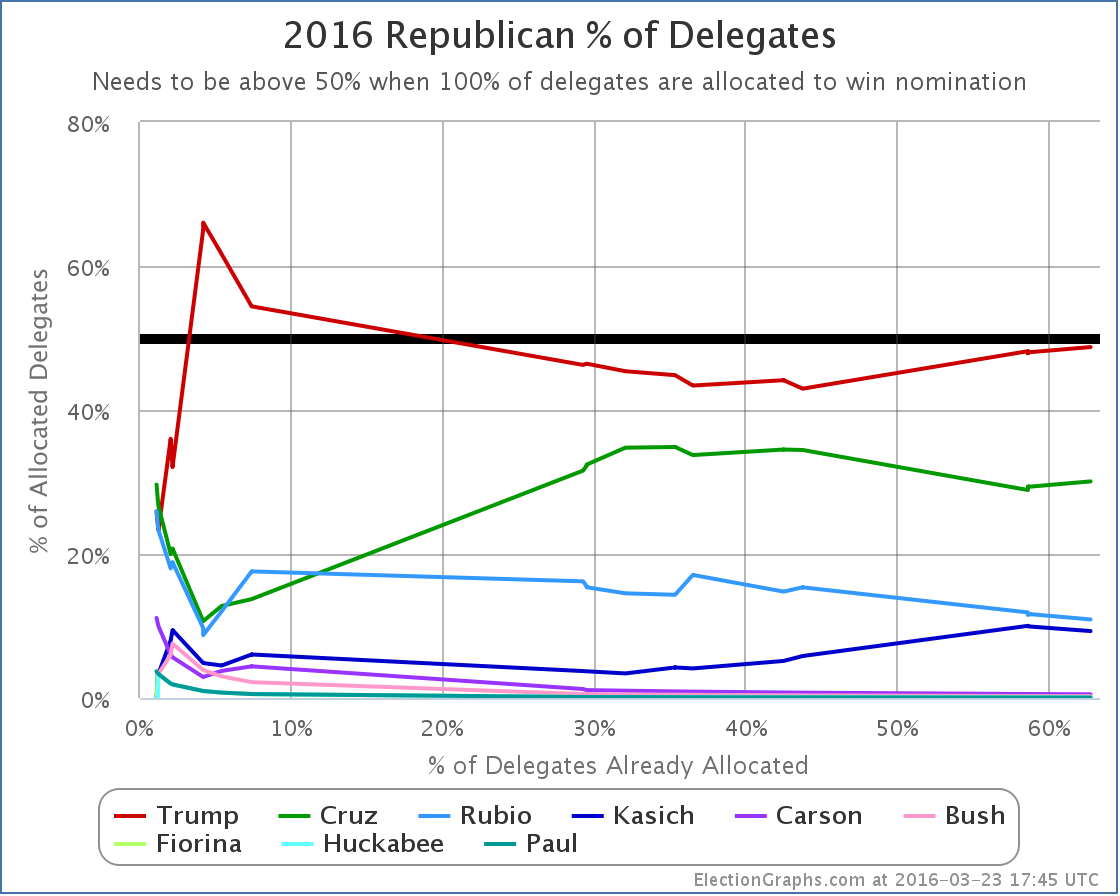
In percentages of the delegates so far, both Trump and Cruz improved. But of course Cruz is nowhere near the 50% line. Trump meanwhile is now at 48.74%. He doesn’t have a majority. Close. Very close. But not quite.
But % of delegates so far isn’t the right thing to look at either.
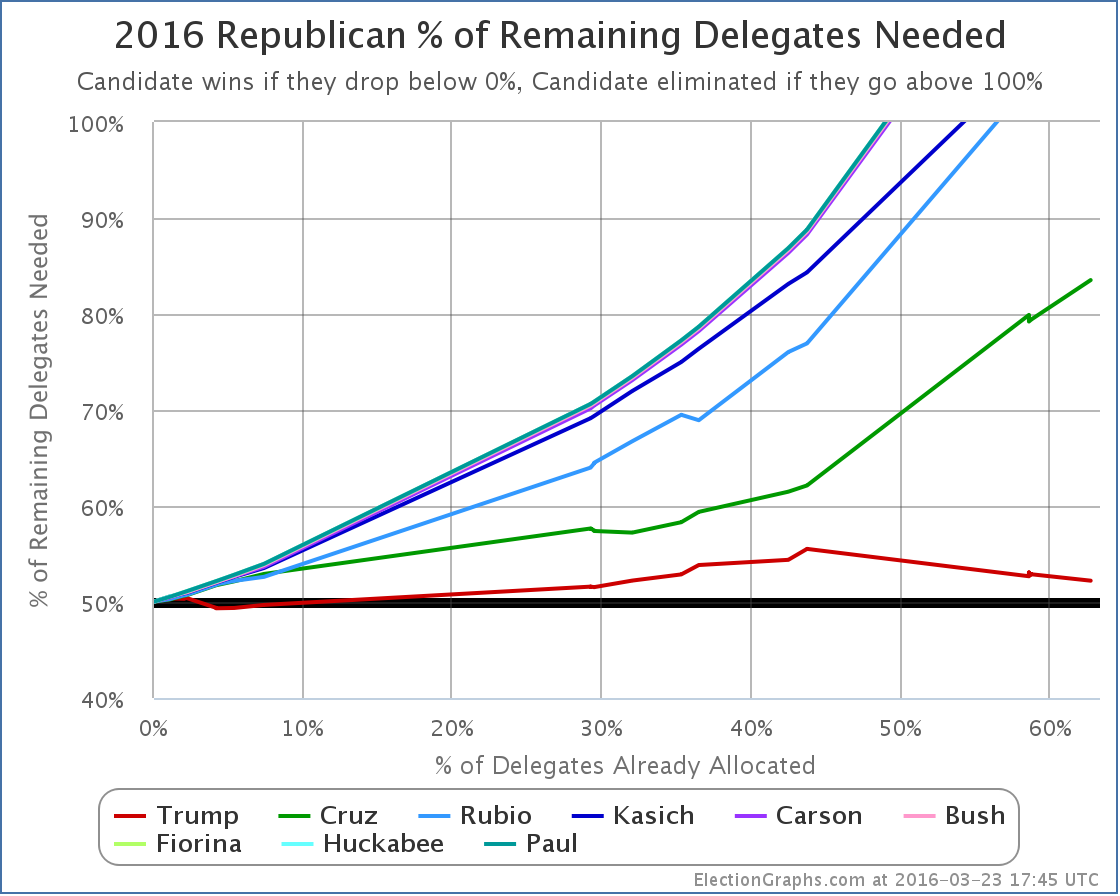
This is the real graph to watch. The percentage of the remaining delegates that Trump needs to win in order to get to the convention with a majority of delegates. This has been dropping in the last couple of contests.
Trump now needs 52.22% of the remaining delegates to win the nomination outright.
Now, some of those “remaining delegates” are 18 delegates who have already been selected as officially “uncommitted” delegates, and there will be more uncommitted delegates coming out of some of the states that have yet to vote. Probably a few dozen to as many as 100. These delegates are essentially like the Democratic superdelegates in that they can vote however they feel like and are not bound to the results of any primaries or caucuses.
If you wanted to calculate the percentage Trump would need without uncommitted delegates, it would be higher. But just like superdelegates are part of the process on the Democratic side, uncommitted delegates are part of the process on the Republican side, and to get a fair picture you need to include them.
You just have to realize that winning not only includes earning pledged delegates, but also convincing uncommitted delegates to vote for you.
It is a real possibility that we could get to the end of the primaries and caucuses in June without knowing if Trump has an outright win, or if he’ll come up short on the first ballot at the convention. It might end up depending on what those uncommitted delegates decide to do.
We are still right on the edge between a Trump win and a convention where nobody wins on the First ballot. And which way that goes may end up depending on the uncommitted delegates. What percentage of the uncommitted delegates Trump would need… if he even needs them at all… will depend on how he continues to do in getting pledged delegates between now and June.
But meanwhile, the pace of primaries and caucuses now slows down quite a bit. So there will be a lot of waiting before we know.
[Update 2016-04-01 17:15 UTC – Alaska gave back Rubio’s delegates after he asked, and Oklahoma finalized their results. Net change: Rubio +4, Cruz -2, Trump -3. This does not substantially change the analysis above.]
[Update 2016-04-04 05:43 UTC – Most of Colorado’s delegates will be determined next weekend, but the 6 representing the 1st and 6th congressional districts were determined this weekend, and all 6 went to Cruz. With this and the change above, Trump’s percentage of remaining needed to win is up to 52.83%. Adding this note here rather than doing a full post on those six delegates.]
[Update 2016-04-04 14:15 UTC – As of April 4th there were 28 “unbound” Republican delegates, with more to come soon. These are free agents like the Democratic superdelegates. I have started to track them individually when there is evidence of a known preference. So far, adding them in nets: Cruz +3, Trump+2.]
[Update 2016-04-06 02:01 UTC – Added in tentative evaluations of the uncommitted delegates from North Dakota. Net: Cruz +7, Trump +1, Kasich +1.]
Note: This post is an update based on the data on ElectionGraphs.com. Election Graphs tracks both a poll based estimate of the Electoral College and a numbers based look at the Delegate Races. All of the charts and graphs seen in this post are from that site. Additional graphs, charts and raw data can be found there. All charts above are clickable to go to the current version of the detail page the chart is from, which may contain more up to date information than the snapshots on this page, which were current as of the time of this post. Follow @ElectionGraphs on Twitter or like Election Graphs on Facebook to see announcements of updates or to join the conversation. For those interested in individual general election poll updates, follow @ElecCollPolls on Twitter for all the polls as they are added.