- 04:49:53 Got home late. After dark. Alex was waiting. Wanted to show me that he was RIDING HIS BIKE. He was SO proud of himself! I am so proud too!
- 04:53:53 Retweeted @jennsteele 03:41:26 @abulsme @imbou You *could* see an apple watch tonight. Well, on TV. On The Voice. And I guess only Sam right now (time zone)…
- 04:57:11 .@jennsteele @imbou I've "seen" many Apple Watches in the "on a screen" sense. Waiting for an "in the wild" sighting! in reply to jennsteele
- 04:59:20 .@jennsteele @imbou Even if I go see one in an Apple Store, which I haven't done yet, it won't count as in the wild, which is different. :-) in reply to jennsteele
- 04:59:27 Retweeted @jennsteele 04:58:19 @abulsme @imbou Come to a gym in San Francisco if you want to see the watch "in the wild". *eyeroll* in reply to abulsme
- 05:01:12 .@jennsteele @imbou Sad to say I don't have a San Francisco gym in my upcoming plans. :-) in reply to jennsteele
- 05:01:19 Retweeted @jennsteele 04:59:05 @abulsme @imbou Note: the eyeroll was not for you. People around here are ridiculous. Like glassholes giving presentations. Sigh. in reply to abulsme
- 05:02:41 .@jennsteele @imbou I'm still not sure I have seen a Google Glass in person. Maybe from a distance. Not thinking I have missed much… in reply to jennsteele
- 05:03:25 Retweeted @jennsteele 05:02:35 @abulsme @imbou You could fix that lack of SF gym thing. :) in reply to abulsme
- 05:03:45 .@jennsteele @imbou I'm good. Thanks. in reply to jennsteele
- 05:03:59 Retweeted @jennsteele 05:03:27 @abulsme @imbou I couldn't believe that someone was giving a presentation wearing glass. It's like holding your phone in front of your face! in reply to abulsme
- 05:04:55 .@jennsteele @imbou Wait, so I shouldn't do that? in reply to jennsteele
- 05:06:25 Retweeted @jennsteele 05:06:07 @abulsme @imbou Erm. Um. I have no words. in reply to abulsme
- 05:36:37 Retweeted @BeautifulMaps 2015-05-11 16:03:21 All of US history has occurred within a single Pluto orbit @NASANewHorizons http://t.co/2YJeiaw4tJ
- 07:38:08 Added 2016 NC poll results from @gravismarketing. Details at @ElecCollPolls and http://t.co/484fZNHZiD . Blog post on a status change soon.
- 08:49:21 [Abulpost] Electoral College: Clinton vs Paul in NC flips back to Clinton http://t.co/ypLd2zx21a
- 13:17:38 Retweeted @imbou 13:15:22 @jennsteele @abulsme the only time I saw someone with glass was a father with his kid in the park, which was just creepy in reply to jennsteele
- 13:21:45 .@imbou @jennsteele See now, that seems fine to me. Never had issues with these kinds of use cases. Implementation just seemed weak. in reply to imbou
- 16:41:21 Retweeted @imbou 13:40:19 @jennsteele @abulsme yeah let act like i am playing with my son when I am really not… Focus on your son at the park!!! in reply to imbou
- 16:44:54 .@imbou @jennsteele Inevitable (& I want!): Permanent searchable archive of everything I see or hear, shareable at will, or under subpoena. in reply to imbou
- 18:44:31 Retweeted @jennsteele 18:36:25 @imbou @abulsme Y'know, the glasshole in the park might have been taking a video of his kid. in reply to imbou
- 18:45:44 .@jennsteele I think @imbou was thinking taking video instead of playing with kid, not random creepy dude watching kids. Could be wrong. in reply to jennsteele
- 20:25:29 Retweeted @imbou 20:24:58 @abulsme @jennsteele the guy wasn't recording in reply to abulsme
- 20:26:32 .@imbou @jennsteele Texting? Emailing? Swiping on Tinder to find a new mom for the kid? What disturbed you? in reply to imbou
- 20:47:24 Retweeted @imbou 20:38:02 @abulsme @jennsteele the fact that he could have been instead of paying attention to his child. If you go to the park its to play! in reply to abulsme
- 20:47:30 Retweeted @imbou 20:43:53 @abulsme @jennsteele I got some jerkoff with a go pro strapped to his head recording his Disney trip, that's annoying too… in reply to abulsme
- 20:49:26 .@imbou @jennsteele You play with one hand, read Twitter with the other. Duh! in reply to imbou
- 20:49:52 .@imbou @jennsteele You caught me! That was me! in reply to imbou
|
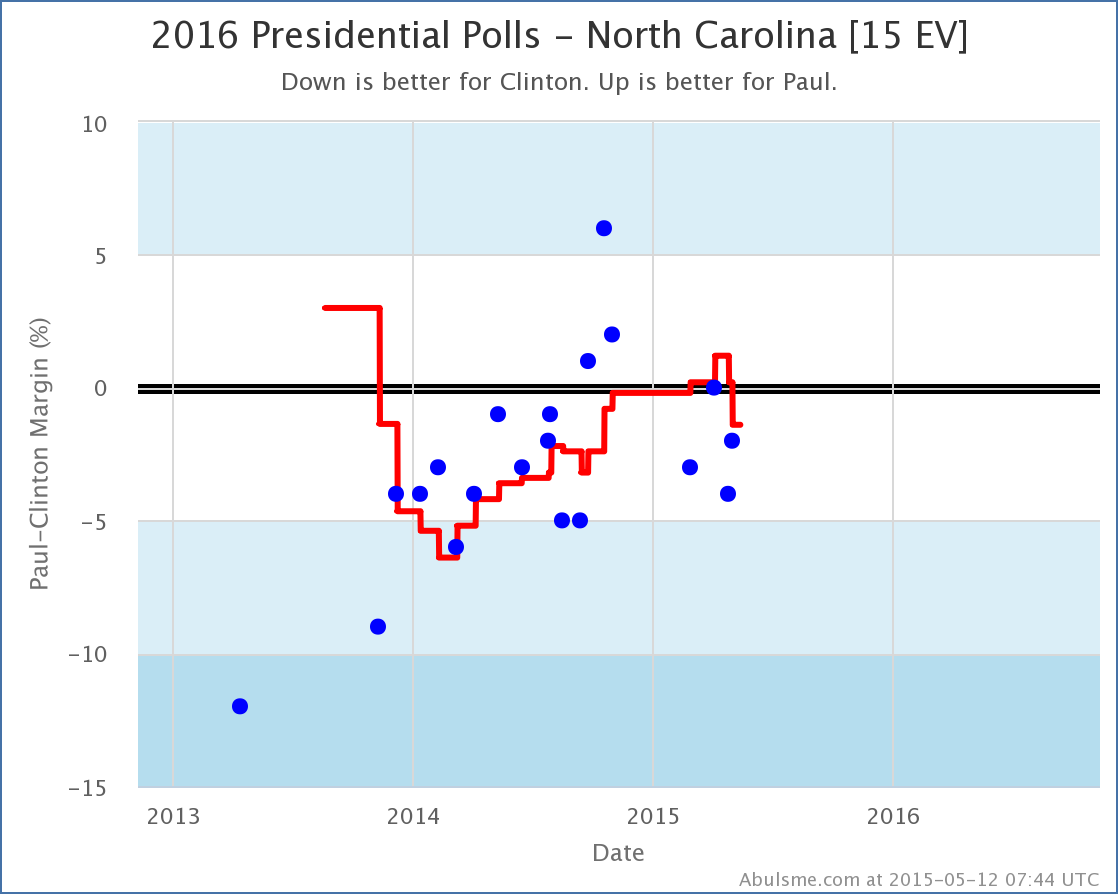
Today’s new poll from Gravis in North Carolina scrambles up the “five best polled candidate combinations” by the metric I use a bit, with Clinton vs Huckabee now the “best polled”, followed by Clinton vs Bush, Clinton vs Paul, Clinton vs Christie and Clinton vs Rubio. (This is basically because Clinton vs Huckabee is now very close in a state that has been very well polled.) That’s just bookkeeping though, there was one status change of note: Clinton vs Paul
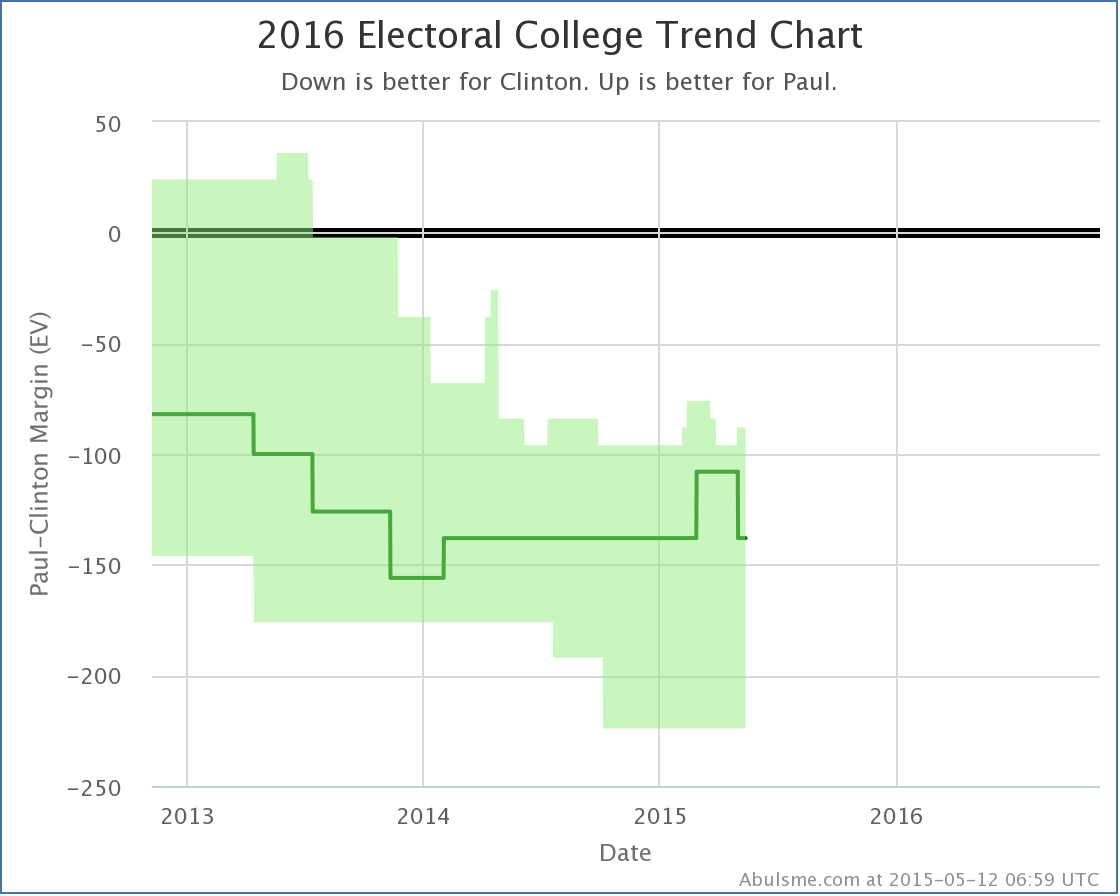
The newest poll in North Carolina bumps a poll from last October that had Paul ahead by 6% out of the poll average. With that poll gone, the average changes from Paul ahead by 0.2% to Clinton ahead by 1.4%. But the bottom line here is that all but one poll in the past year shows less than a 5% gap between Paul and Clinton. This is a close state. Yes, all but a few have shown Clinton ahead, so calling this “Weak Clinton” seems fair, even if you go beyond the last five polls. But it is close, and could flip back to Paul easily enough. For now though, North Carolina returns to the Clinton side of the fence, and so the “Expected Case” moves 30 electoral votes toward Clinton:
With this Paul is back to losing to Clinton by 138 electoral votes, which is where he has been for most of the last year. Note: This post is an update based on the data on my 2016 Electoral College Analysis Site. All of the charts and graphs seen here are from that site. Graphs, charts and raw data can be found there for the race nationally and in each state for every candidate combination that has been polled at the state level. In addition, comparisons of the best polled candidate combinations both nationally and each in each state are available. All charts above are clickable to go to the current version of the detail page the chart is from, which may contain more up to date information than the snapshots on this page, which were current as of the time of this post. Edit 15:20 UTC to fix a typo.
In the latest Curmudgeon’s Corner with Sam and IvГЎn:
Length this week – 1:17:49
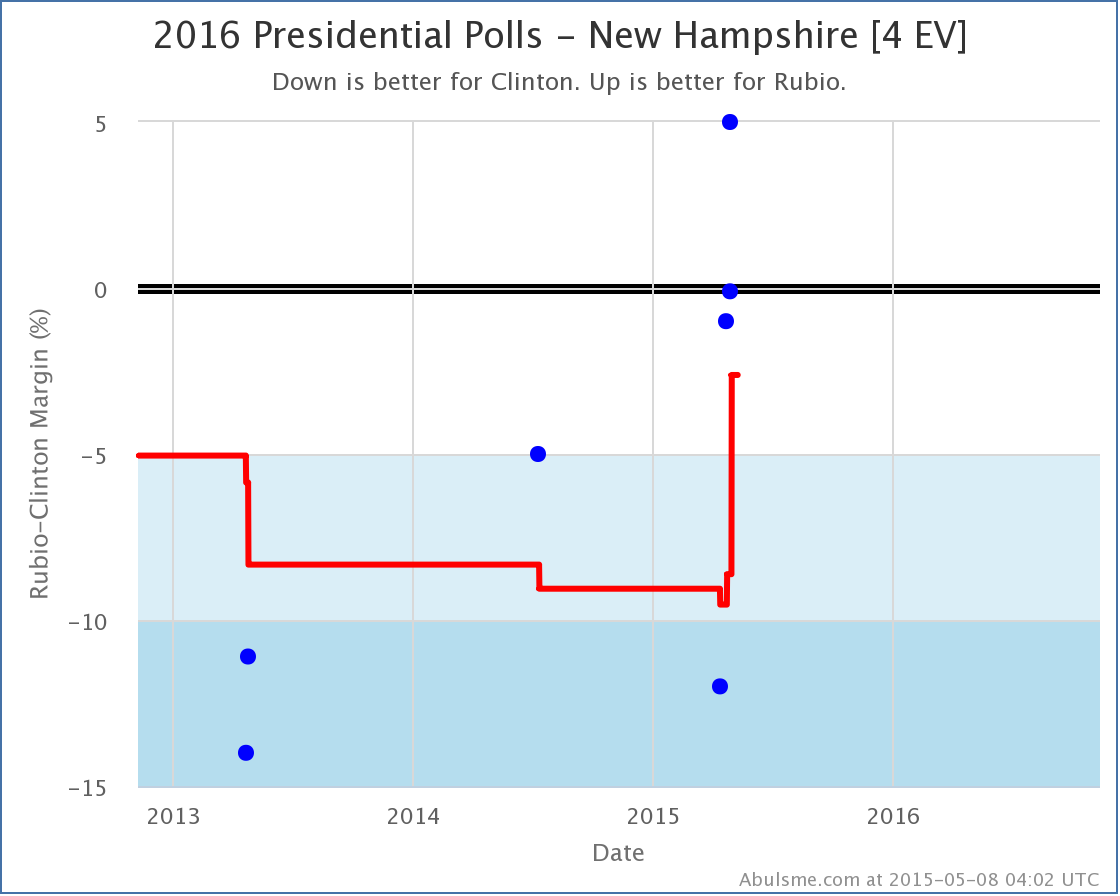
Today there was yet another poll in New Hampshire, this time from WMUR, as well as one in New Jersey from Monmouth. Today’s changes actually lead to Clinton vs Walker bumping Clinton vs Rubio off my “five best polled candidate combinations” list, at least according to my metric. Even though Clinton vs Rubio isn’t in the top five any more, since it WAS in the top five prior to this update, I’ll briefly cover the change. Just like Bush and Paul improved their situation in New Hampshire polling yesterday, today’s poll data boosts Rubio in New Hampshire, and Clinton’s lead falls to less than 5%.
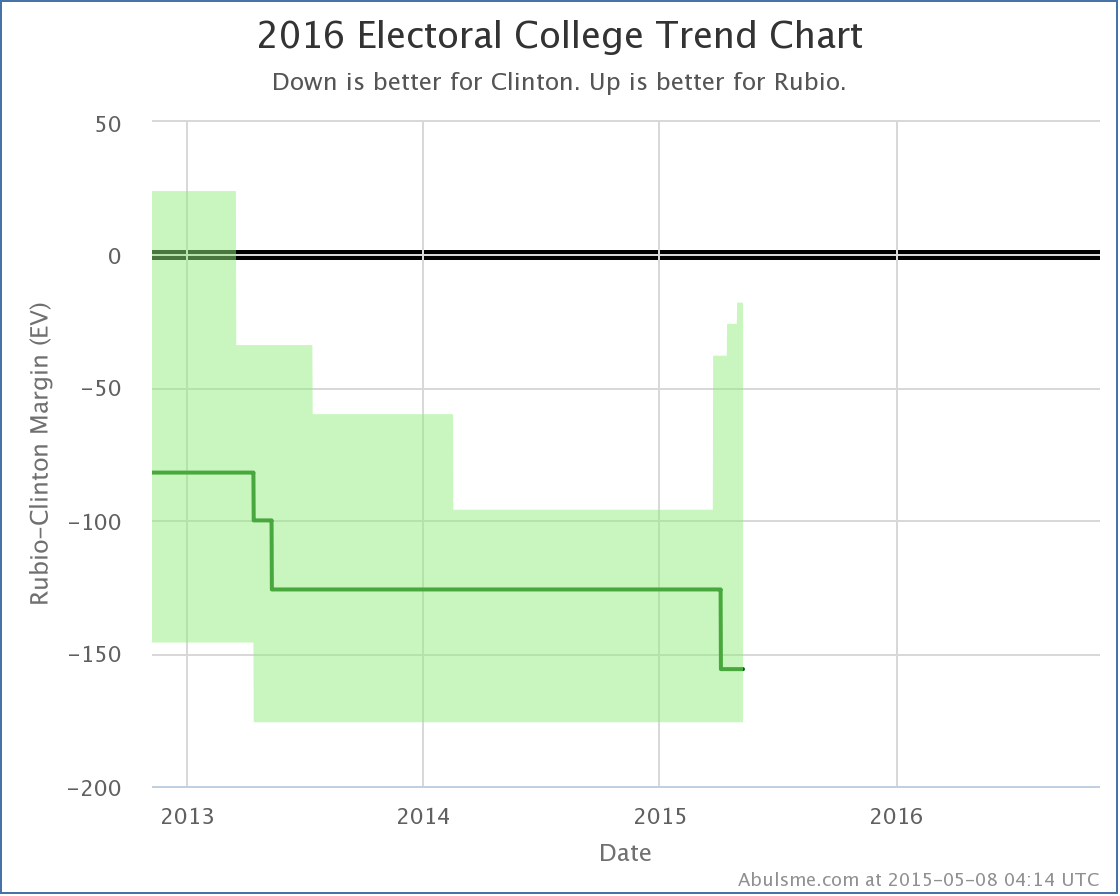
Notice the huge range here. Just within the last month, polls have ranged from Clinton up by 12% to Rubio up by 5%. That is a crazy range. I don’t feel a lot of confidence about what is really going on in New Hampshire. The average at the moment though puts New Hampshire in the “Weak Clinton” category vs Rubio, so Rubio’s best case improves:
This doesn’t put Rubio quite as close as Bush, but still puts his best case at losing to Clinton by only 18 electoral votes. So there are a couple of the Republicans now threatening to actually make a race out of this. Note: This post is an update based on the data on my 2016 Electoral College Analysis Site. All of the charts and graphs seen here are from that site. Graphs, charts and raw data can be found there for the race nationally and in each state for every candidate combination that has been polled at the state level. In addition, comparisons of the best polled candidate combinations both nationally and each in each state are available. All charts above are clickable to go to the current version of the detail page the chart is from, which may contain more up to date information than the snapshots on this page, which were current as of the time of this post. |
||