On this week’s Curmudgeon’s Corner, Sam and Ivan do the six smaller topics thing again, although one of the topics is a multi-topic bundle, so you could perhaps say there were actually eight. In any case, they do talk a little bit about “serious” stuff like the Cuomo sexual harassment charges, Texas and other places lifting pandemic restrictions, and a little on Biden’s Saudi Arabia and Syria actions. But they also spend time on lighter subjects like Sam getting a new phone, a movie that means a lot to Ivan, SpaceX explosions, reactions to weather changes, and even Daft Punk. Enjoy the show!
Click below to listen and subscribe!
1-Click Subscribe in iTunes View Podcast in iTunes View Raw Podcast Feed Download MP3 File Follow the podcast on Facebook Support us on Patreon
Show Details:
Recorded 2021-03-05 Length this week – 2:06:35
(0:02:02-0:42:16) Round 1
Ivan: Sam’s phone
Sam: Sam Movie: Wall Street (1987)
(0:43:37-1:29:40) Round 2
Ivan: Cuomo sexual harassment
Sam: Loosening Covid restrictions
(1:30:49-2:06:15) Round 3
Ivan: Tidbits
Sam: Biden Saudi Arabia and Syria actions
The Curmudgeon’s Corner theme music is generously provided by Ray Lynch.
Our intro is “The Oh of Pleasure” (Amazon MP3 link)
Our outro is “Celestial Soda Pop” (Amazon MP3 link)
Both are from the album “Deep Breakfast” (iTunes link)
Please buy his music and support his GoFundMe.
On this week’s Curmudgeon’s Corner Sam and Ivan once again do it lightning round style. Eight topics, averaging about 15 minutes each. This week we have the calming of the news cycle, the pandemic, impeachment, the crisis in Texas, Sam watching Back to the Future, the death of Rush Limbaugh, the Mars rover landing, and Ted Cruz. Plus some special contributions from Sam’s son Alex. Enjoy!
Click below to listen and subscribe!
1-Click Subscribe in iTunes View Podcast in iTunes View Raw Podcast Feed Download MP3 File Follow the podcast on Facebook Support us on Patreon
Show Details:
Recorded 2021-02-20 Length this week – 2:03:02
(0:00:34-1:18:23) Round 1
Sam: The Calm
Ivan: Pandemic
Sam: Impeachment
Ivan: Texas
(1:21:38-1:58:53) Round 2
Sam: Movie: Back to the Future (1985)
Ivan: Rush Limbaugh
Sam: Mars Rover
Ivan: Ted Cruz
The Curmudgeon’s Corner theme music is generously provided by Ray Lynch.
Our intro is “The Oh of Pleasure” (Amazon MP3 link)
Our outro is “Celestial Soda Pop” (Amazon MP3 link)
Both are from the album “Deep Breakfast” (iTunes link)
Please buy his music and support his GoFundMe.
On this week’s Curmudgeon’s Corner, Sam and Ivan talk presidential transition and pandemic, along with a bit about how Americans interact with death. On the transition, the main theme is the Texas SCOTUS case that altogether predictably failed, along with all the drama surrounding that effort. On the pandemic, along with the usual stats update, discussion of people congregating for the holidays, the potential impact of the new vaccines, and some thoughts on how Biden will handle things compared to Trump. And that is that.
Click below to listen and subscribe!
1-Click Subscribe in iTunes View Podcast in iTunes View Raw Podcast Feed Download MP3 File Follow the podcast on Facebook Support us on Patreon
Show Details:
Recorded 2020-12-12 Length this week – 1:46:01
(0:00:22-0:23:51) Miscellany
Agenda
Year-end shows coming soon!
Interactions with death
(0:24:41-1:16:20) Presidential Transition
Texas vs Everyone
Election 1876 and Election 2000
Transactional Trump
Trump true believers and political violence
Electoral College shenanigans
What remains for Trump?
2016 denial vs 2020 denial
Polarization
(1:17:37-1:45:40) Pandemic
Stats update
People congregating
Vaccine
Ivan sets a bad example
Vaccines
Biden vs Trump policies
Sam health update
The Curmudgeon’s Corner theme music is generously provided by Ray Lynch.
Our intro is “The Oh of Pleasure” (Amazon MP3 link)
Our outro is “Celestial Soda Pop” (Amazon MP3 link)
Both are from the album “Deep Breakfast” (iTunes link)
Please buy his music and support his GoFundMe.
On this week’s Curmudgeon’s Corner, Sam and Ivan cover ten separate topics for about ten minutes each, including recent developments in several countries, a 1940’s era movie Sam watched, the Congressional impeachment investigations, Joe Biden’s latest gaffes, the Epstein suicide, and much more. Tune in for a very full show!
Click below to listen and subscribe!
1-Click Subscribe in iTunes View Podcast in iTunes View Raw Podcast Feed Download MP3 File Follow the podcast on Facebook Support us on Patreon
Show Details:
Recorded 2019-08-17 Length this week – 1:59:02
(0:01:49-0:13:44) Ivan: Feedback
(0:15:30-0:24:36) Sam: Sam Movie: Double Indemnity (1944)
(0:25:56-0:36:57) Ivan: Epstein Suicide
(0:37:34-0:48:29) Sam: Impeachment Investigations
(0:49:45-0:59:19) Ivan: Steve King Comments
(1:00:04-1:09:00) Sam: Sam Book: The Ideas Industry (2017)
(1:10:10-1:20:32) Ivan: Biden Gaffes
(1:22:33-1:32:54) Sam: Election Graphs: Blue Texas
(1:34:37-1:44:49) Ivan: Argentina / Hong Kong / Moscow
(1:45:53-1:58:41) Sam: Greenland
The Curmudgeon’s Corner theme music is generously provided by Ray Lynch.
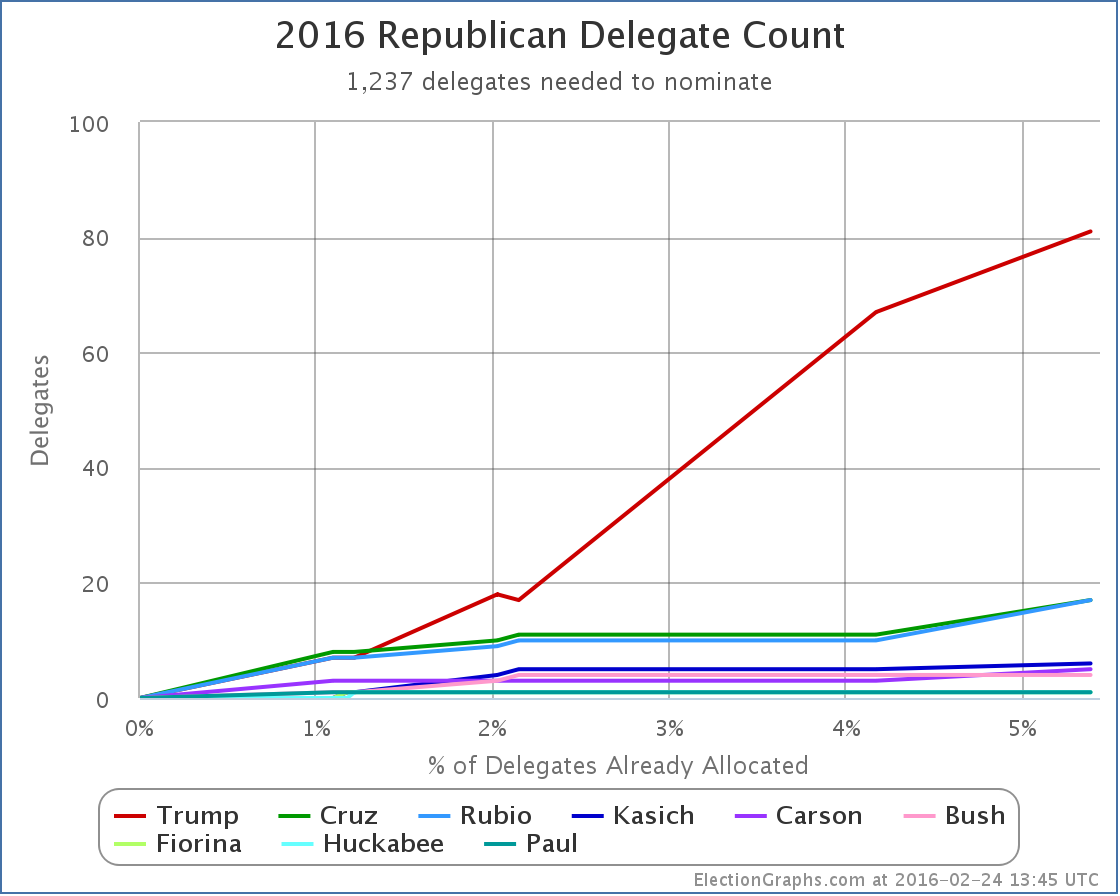
Once again the headline out of a state is Trump winning. In Nevada the delegate count was:
14 Trump, 7 Rubio, 6 Cruz, 2 Carson, 1 Kasich
To be on the glide path for a 1st ballot victory though, Trump needed 15 of the 30 delegates. So he fell slightly short.
Now, don’t misunderstand. This is still an impressive victory, and looking at the upcoming states he has a clearer path to victory than anybody else. His margins were higher in Nevada than many people expected. But if today’s performance was replicated in all of the other states, Trump would come to the convention with more delegates than anybody else, but not the majority needed to win outright. Of course as we continue more people will drop out, and the amount with which states give bonuses to the winners increases, so that still seems like an unlikely final outcome.
Right now Trump continues to do everything he needs to do to win. Lets look at some of the graphs, then we’ll do a quick look at the March 1st “Super Tuesday” states.
The overall delegate count is now:
81 Trump, 17 Cruz, 17 Rubio, 6 Kasich, 5 Carson, and 7 for people who have dropped out
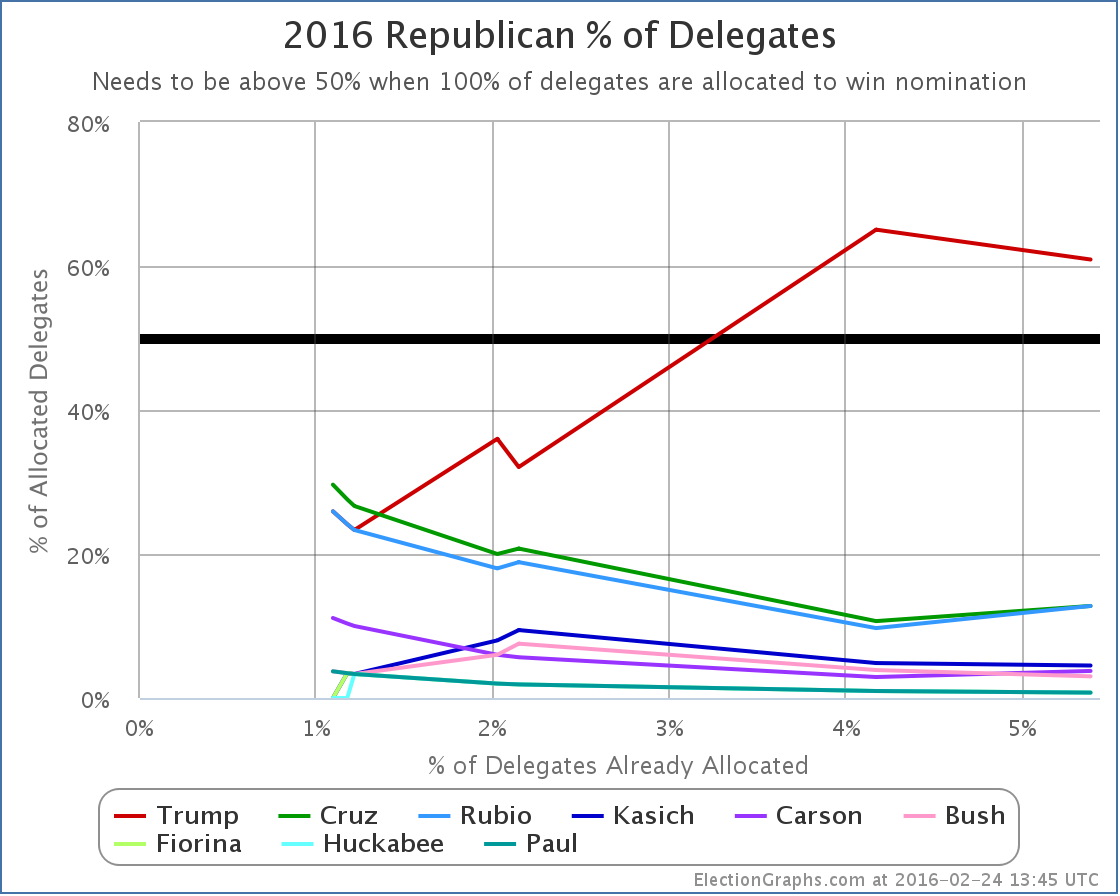
Trump continues to dominate. Lets look at this as percentages:
The “winners” here were actually Cruz, Rubio and Carson. Each of them improved their proportion of delegates with Nevada’s results. Trump actually went down. He doesn’t have to worry too much about that though. He still has a majority of the delegates allocated so far, and he is far far ahead of any of his opponents.
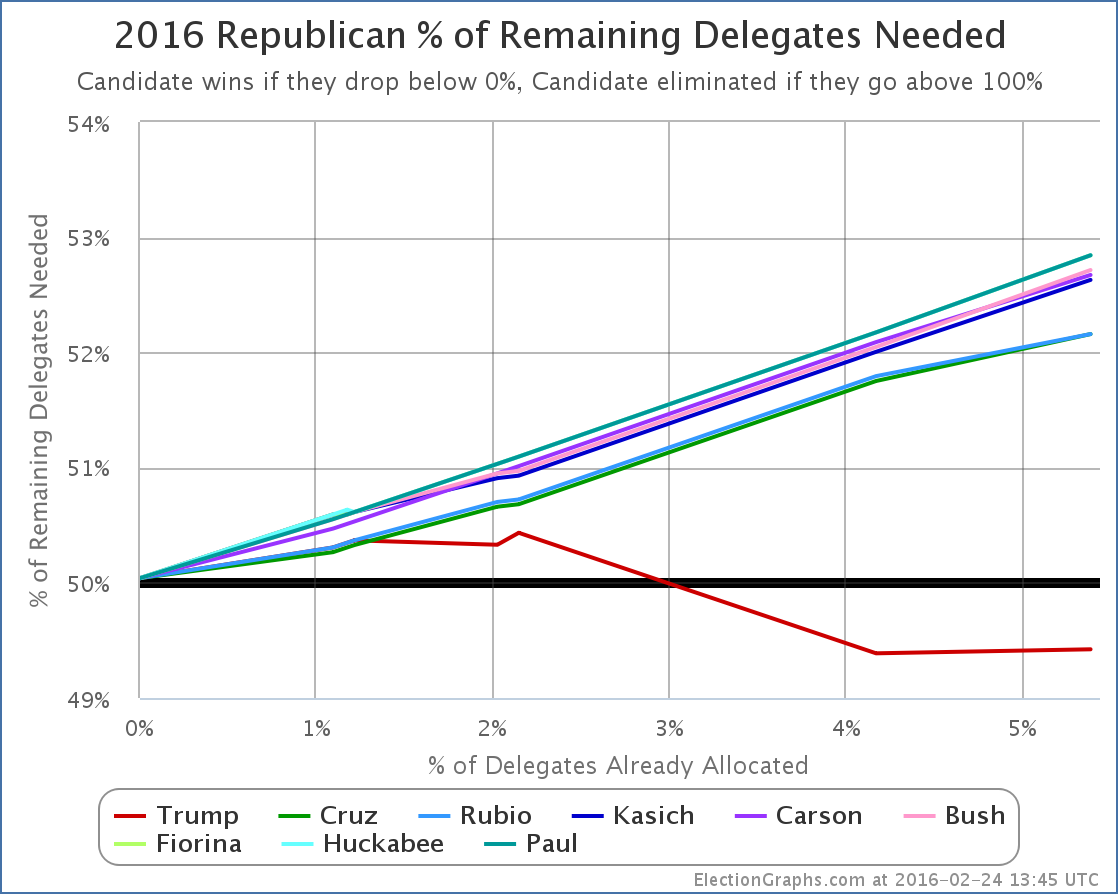
Finally, lets look at the “% of remaining delegates needed to win”, which I argue is the single most important thing to look at to understand where the race really is:
Because Trump got 14 delegates instead of 15 delegates, his line goes up a little bit. (Remember, on this chart down is good, up is bad.) The red line goes from needing 49.39% of the remaining delegates to needing 49.42%. This is a relatively trivial difference though. It is basically flat. Trump’s situation is very close to unchanged.
Meanwhile, the other lines keep going up at a decent pace. Kasich and Carson add about 0.6% to their numbers. Cruz and Rubio add about 0.4%.
This should be obvious, but the more they lose, the harder it is to catch up.
Many people are still talking about how as consolidation happens, the remaining non-Trumps will do better and the picture will change. Maybe, but nobody new announced they were dropping out after the Nevada results (yet anyway). So it looks like we may still go into March 1st with a five person race.
Lets run a hypothetical using current polling on the Super Tuesday states and see where we end up using RCP poll averages for the five remaining candidates. We’ll make delegate estimates based on the specific delegate allocation rules in each state.
That gives Trump 47.1% of the super Tuesday delegates, Cruz 39.4%, and everyone else much less.
Trump needs 49.4% of the delegates to be on the path to an outright win though! So 47.1% would be in the realm where heading to a contested convention might be possible! Still unlikely, as the additional states in March will add up fast, and more candidates are likely to drop out. Still though, possible!
Adding in the existing delegates, we’d have a post-Super Tuesday race that looks like this:
375 Trump, 263 Cruz, 84 Rubio, 17 Kasich, 11 Carson, 7 for candidates who have already dropped out
Now, these are estimates based on current polling, and very few of these states were well polled as of this post, so much of the above is based on one or two polls, or using the national averages rather than state polls. And I had to make the assumption that all congressional districts would mirror state results (which is unlikely to be true). And Wyoming actually elects individual delegates rather than doing things based on candidate preference, so it may be an oddball in the end. And of course things are likely to change further before people actually vote next Tuesday. But… the general outlines of this aren’t likely to be too far off.
If this is even remotely close to where we are on March 2nd, we end up with Trump very close to the 50% of delegate mark. (The above has him EXACTLY at that mark.) He would need just a LITTLE bit more to actually push him over the edge to a clean win.
The flip side of that though is the combination of all the anti-Trumps would need just a LITTLE bit more in order to have this be on the path to a contested convention. I mentioned earlier that this is still an unlikely outcome. It is. After March 1st, the disproportionality of delegates given to the winner increases, and after March 15th we have pure winner take all states as well. If Trump remains in the overall lead, even with a plurality, then that is all it takes to push him over the edge.
If the anti-Trumps want to have any hope here at all, they need to be in a position by mid-March that they can win not just a few, but many states of the winner-take-most and winner-take-all variety. And frankly, the most likely scenario even then is just forcing a contested convention where Trump still has the most delegates, not someone else winning outright.
The anti-Trumps would have a hard road to get to an outright win. Cruz would need 56.8% of the remaining delegates to catch up and win after March 1st if things played out like my estimates above.
If you had to make a guess based on what we know now, a Trump nomination is far more likely than any other… and with an outright delegate majority on the first ballot, not after a contested convention.
6 days until Super Tuesday. We’ll see how close my estimates above turn out to be.
Update 2016-02-26 07:17 UTC – On February 22nd New Hampshire certified the results of their primary. In the final tally Trump had one more delegate than previous estimates, and Rubio one less. This did not seem worthy of a separate post, but a note here seemed appropriate. The totals on ElectionGraphs.com have been updates appropriately. This does not substantively change any of the analysis above.
Note: This post is an update based on the data on ElectionGraphs.com. Election Graphs tracks both a poll based estimate of the Electoral College and a numbers based look at the Delegate Races. All of the charts and graphs seen in this post are from that site. Additional graphs, charts and raw data can be found there. All charts above are clickable to go to the current version of the detail page the chart is from, which may contain more up to date information than the snapshots on this page, which were current as of the time of this post. Follow @ElectionGraphs on Twitter or like Election Graphs on Facebook to see announcements of updates or to join the conversation. For those interested in individual general election poll updates, follow @ElecCollPolls on Twitter for all the polls as they are added.
[Edit 16:28 UTC to correct math on % of remaining Cruz would need after Super Tuesday, I’d originally shown a higher number around 61%.]
[Edit 2016-02-27 17:06 UTC to fix place where Kasich had been autocorrected to Quash.]
[Edit 2016-02-28 22:03 UTC to add dropped out candidates to the after Super Tuesday estimate.]
Earlier this week, Andrew Sullivan had a series of posts exploring trends in Texas that may eventually make it a swing state. (Part 1, Part 2, Part 3) This prompted me to wonder what the actual numbers were and what the trend might look like.
Demographic trends may well cause changes in the electoral balance in Texas at some point in the future, but looking at actual historical election results shows no such trend so far.
Similar to the chart I did of national trends on Sunday, the chart above shows the Democratic proportion of the two party vote (ignoring third parties) over the last 100 years, this time just for Texas. Over this timescale, clearly the trend is from a very reliable Democratic state prior to 1950 to a solid Republican state since 1970.
Looking just since 1970, one could argue that the trend is fairly flat, but if you look at how winning Democratic presidents have done, you see that Clinton did not match Carter’s numbers (Carter actually won Texas in 1976) and then Obama has not matched Clinton’s numbers. Each winning Democratic president has done worse in Texas than the one before.
Now, one could say that Obama did better in Texas than Kerry or Gore, and that would be quite true. But it seems like that is more just a factor of being a winning candidate, and thus having higher levels of support overall.
And in the most recent timeframe you can look at, Obama 2012 didn’t do as well as Obama 2008.
There may be underlying demographic trends that will eventually favor Democrats in Texas, but they haven’t actually started to bend the curve there quite yet.
But wait! There is another way of looking at this!
I hinted at it when I mentioned that the winning Democratic candidates (Obama, Clinton, Carter) got a boost compared to the losing Democratic candidates (Kerry, Gore, Dukakis, Mondale) just by virtue of being winners.
You can correct for this by looking at how Texas voted relative to the national vote rather than just looking at Texas in isolation. If you take the Democratic percentage of the two party vote in Texas, and subtract from that the Democratic percentage of the two party vote nationwide, you get a measure of how much more (or less) Democratic Texas is than the country at large. With this, you get the following chart:
I’ve left out the red and blue coloring this time because it clutters up the image, but this chart is a lot less noisy. You still see a very clear trend with Texas becoming less Democratic and more Republican over the last 100 years (compared to the rest of the country).
In this view however you CAN see an inflection point at the 2000 election. Up until 2000 Texas was clearly getting more Republican (compared to the rest of the country) with almost every election. Then that trend seems to stop.
In 2000 Texas was 11.2% more Republican than the nation.* Each election since then the difference between Texas and the national average has been slightly less. In 2004 Texas was 10.3% more Republican. In 2008 it was 9.6%. And in 2012 the preliminary numbers have it at 9.4%.
At that rate Texas still has a LONG time to go until it is really close to the national numbers. But with this view, you actually do see a trend with Texas’s Republican lean (relative to the rest of the country) decreasing slightly over the past few elections.
* I’m being slightly sloppy with language here, to be more correct I would say that the Democratic proportion of the 2 party vote was 11.2% less in Texas than the Democratic proportion of the 2 party vote nationwide.
No states were called between 01:45 UTC and 02:00 UTC, but a ton were called between 02:00 UTC and 02:15 UTC:
Romney: KS, LA, NE-All, NE-1, ND, SD, TX, WY, MS
Obama: MI, NY, NJ
All of these were no brainer expected states, except for Michigan. Michigan is the first state of the night to be called where the margin was less than 5% in the polls, so winning this state made a difference between the “best cases” that I present. Obama was ahead here by 4.5%, so a win here was predicted, but it was a close state and one that Romney really needed.
As of the final update I made on election day, Michigan was the tipping point state. That means Romney had to win all the states he was doing better in than Michigan PLUS Michigan in order to win. He just lost Michigan, which means he now needs a state he was further behind in that Michigan in order to win.
This is very bad news to Romney. His path to victory is now not quite impossible, but very close. Let’s look:
With all the states he has already won, plus the uncalled states where Romney was ahead by more than 5%, he had 190 electoral votes. Then the areas he was ahead in:
Nebraska 2nd (1): 3.8% Romney lead
North Carolina (15): 1.4% Romney lead
That gets Romney to 206. He needs 63 more electoral votes. Looking at the remaining states that haven’t yet been called:
Iowa (6): 2.0% Obama lead
Florida (29): 2.3% Obama lead
Colorado (9): 2.4% Obama lead
New Hampshire (4): 2.8% Obama lead
Maine 2nd (1): 2.8% Obama lead
Virginia (13): 3.6% Obama lead
Pennsylvania (20): 4.8% Obama lead
Nevada (6): 4.8% Obama lead
If Romney wins all of those through Pennsylvania, it gets him to 288 electoral votes, which wins him the Presidency. If he doesn’t win Pennsylvania to win, he needs every other one of those states, including Nevada, which would get him to 274. If he does win Pennsylvania, then he could afford to lose Virginia, New Hampshire and Maine’s 2nd (and Nevada).
But that is a very tall order! And there will be another update coming soon…
Charts from the Abulsme.com 2012 Republican Delegate Count Graphs page. When a candidate gets down to 0%, they have clinched the nomination. If they get above 100%, they have been mathematically eliminated. The first chart is by date, the second is by “% of Delegates Already Allocated”. These numbers include estimates of the eventual results of multi-stage caucus processes which will be refined as the later stages occur.
This is what we have been waiting for seemingly forever. By the beginning of March it was clear that no other candidate than Romney had the ability to get to 1144 absent a miracle. By the beginning of April it was clear that the non-Romney’s also were not going to be able to collectively block Romney absent a miracle. But Romney still needed to actually get to 1144. Slowly but surely he did so through April and May. Today he finally goes over the top. (At least with the count I use, which uses the Green Papers soft count plus the DCW Superdelegate Count. Other counts may differ.)
Since this is “the end” lets include a couple of additional graphs with two other views of the race:
All of these charts show how Romney completely dominated this race from the very beginning. There was NEVER a point in the entire campaign where Romney was not ahead in delegates. It was only even close for a few days after Gingrich won South Carolina. The rest of the time, this whole campaign has just been a story of Romney slowly but surely pulling further and further ahead.
Now lets look specifically at today’s results from Texas.
Prior to today, none of Texas’s 155 delegates had been allocated. As of this update we have Romney 105, Paul 18, Santorum 13, Gingrich 7, Bachmann 2, TBD 10. Yes, that is right, at this late state, Michelle Bachmann mounts a comeback it seems. In any case, an overwhelming Romney win.
Romney also picked up two super delegates from Colorado today.
So net for the day: Romney +107, Paul +18, Santorum +13, Gingrich +7, Bachmann +2. Romney gets 72.8% of the delegates awarded today. This is way more than the 12.9% of the remaining delegates he needed to be on track to get to 1144 before “the end”. This was actually enough to push him over the edge.
My count now has the totals as: Romney 1159, Santorum 268, Gingrich 150, Paul 143, Bachmann 2
Now, by the Green Papers “hard count” that only counts delegates that are officially bound to Romney and theoretically have no discretion or ability to change their mind, we have Romney 1012, Santorum 245, Gingrich 143, Paul 93, Bachman 2, Huntsman 2… so by that count Romney still has a little bit further to go. The soft count also includes estimates for how delegates with discretion will vote and for how the remaining processes that are not yet final will play out. I also add in the super delegates who have publicly stated a preference. This is all reasonable. So I feel confident having using the count we have used all along, and considering Romney to have gotten to the 1144 magic number as of today.
Since we are hitting this major milestone today, I’ll take advantage of this time to highlight the comparisons with the 2008 races. More comparisons with 2008 can be found here.
First, to make comparisons easier, the 2012 race on a full 0%-100% scale:
Then what the equivalent graph looked like in 2008:
Looking at these two, in 2008 McCain had two non-trivial opponents compared to the 3 Romney had this time. In 2008, McCain pulled away from the other candidates starting around the 10% mark. In 2012 Romney was ahead from the very beginning. By the the 5% of delegates awarded mark (after Florida), Romney opened up the gap and none of the others ever came close again. Both Romney and McCain got to the “40% of remaining needed to win” mark at almost exactly the point where 50% of the delegates had been awarded. These two years look pretty similar.
Another view comparing Romney 2012 to McCain 2008 looks at % of total delegates earned by the eventual winner vs % of total delegates allocated. This was originally prompted by a post at Enik Rising. Looking at both candidates on the same chart we see this:
Despite all the talk at various points in time about Romney having problems closing the deal by comparison to 2008, this shows clearly that no such thing was happening. Any perception to that effect was due only to the fact that the calendar was more spread out this year than in 2008. Comparing the two curves, sometimes Romney was ahead, sometimes McCain was ahead, but for the most part these two lines tracked each other closely.
Finally, just for completeness, here is what an actually close race looks like on the “% of remaining delegates needed to win” chart… specifically, the Democrats in 2008:
With that, we wrap up the regular coverage of the Republican delegate race for 2012. There may be additional updates for specific milestones… if Paul manages to pass Gingrich in the delegate count… the final totals once all the state delegate selection processes are actually over… or the final roll call count at the convention… but as for regular updates this is it.
Thanks for everybody who has been reading and enjoying these updates over the last five months.
Chart and map from the Abulsme.com 2012 Electoral College Prediction page. Both assume Obama vs Romney with no strong third party candidate. Both show polling as it currently exists. Things will change before election day. On the map red is Romney, blue is Obama, gold states are too close to call. Lines on the chart represent how many more electoral votes a candidate would have than is needed to tie under several different scenarios. Up is good for Obama, Down is good for Romney.
One state changes status today, and once again it is a move in Romney’s direction.
Texas, which was never a swing state by any means, but which for awhile looked like it might be a state where Romney would at least need to watch his back and play a little defense just to be sure it didn’t surprise anyone by starting to get competitive, is now moving back into the “Strong Romney” camp as Romney’s lead in the five poll average jumps to 11%. This is a surprise to precisely no one. :-)
Since Texas was never a swing state, this does not change the summary.
Romney
Obama
Romney Best Case
282
256
Current Status
235
303
Obama Best Case
170
368
The general trend in Romney’s direction which I mentioned last time continues. But to make a big positive difference in his situation, Romney needs to be pulling current “Weak Obama” states into the swing state category. Strengthening his lead in states he is already nicely ahead in may feel good, but it doesn’t have an impact on the election.
Unfortunately, I also have a correction to make regarding some older Wisconsin data. Thanks to a tip from Darryl at HorsesAss I found that I had mistakenly included a Washington State poll from February in the Wisconsin data (as well as in the Washington State data). The end result of this is that prior to today on the chart showing the history of the race so far, Wisconsin had been classified as a “Strong Obama” state from March 2nd to April 19th. With the erroneous poll backed out, Wisconsin should only have been “Strong Obama” from March 30th to April 19th. Starting with the chart in today’s post, the light red line indicating the number of excess electoral votes Romney would have if he won all swing states plus all of Obama’s weak states has been corrected to reflect this. Notes have also been placed in the March 2nd and March 30th updates to point out this correction.
In either case, since May 17th I have classified Wisconsin as a “Lean Obama” swing state.
Sorry for the error. It happens every once in awhile. :-)