This is the website of Abulsme Noibatno Itramne (also known as Sam Minter).
Posts here are rare these days. For current stuff, follow me on Mastodon
|
With the final results all but inevitable, these updates will be somewhat mechanical absent something unexpected happening.
After Indiana, Trump needed 36.02% of the remaining delegates to win.
In Nebraska and West Virginia, Trump seems to have gotten all 70 of the available delegates. (There may end up being some oddness due to West Virginia geographic restrictions on delegate allocation that shifts this slightly.)
In other changes since Indiana due to uncommitted delegate preference changes in American Samoa and Louisiana as well as Louisiana’s Rubio delegates moving to Trump, there were net changes of: Trump +14, Cruz -3, Rubio -5.
So total change since Indiana: Trump +84, Cruz -3, Rubio -5
So Trump actually got 111% of the delegates since Indiana. (Over 100% is possible since he actually took delegates from his opponents as well as collecting “new” delegates.)
So Trump obviously well exceeded the required numbers to be on pace for a win.
Updated graphs:
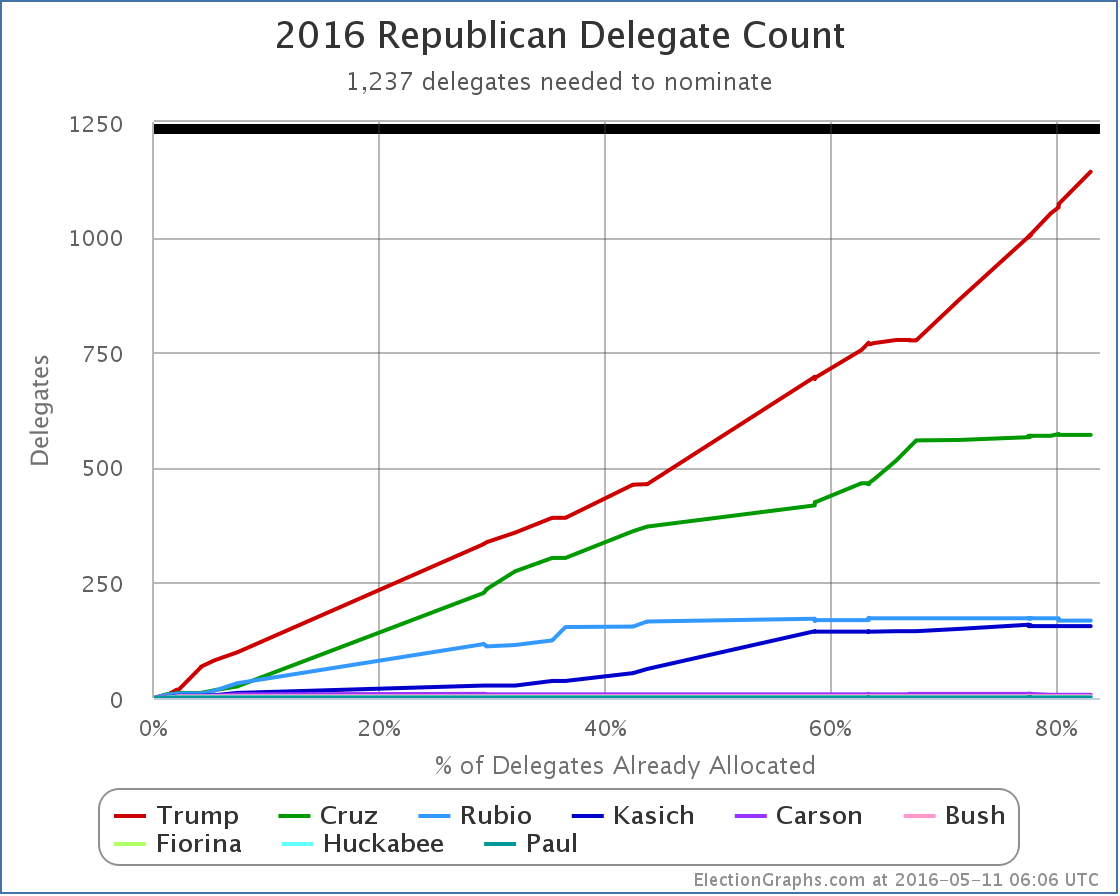
New delegate totals: Trump 1142, Cruz 571, Rubio 168, Kasich 156, Carson 7, Bush 4, Fiorina 1, Huckabee 1, Paul 1.
There are 421 delegates left. Trump needs 95 of them.
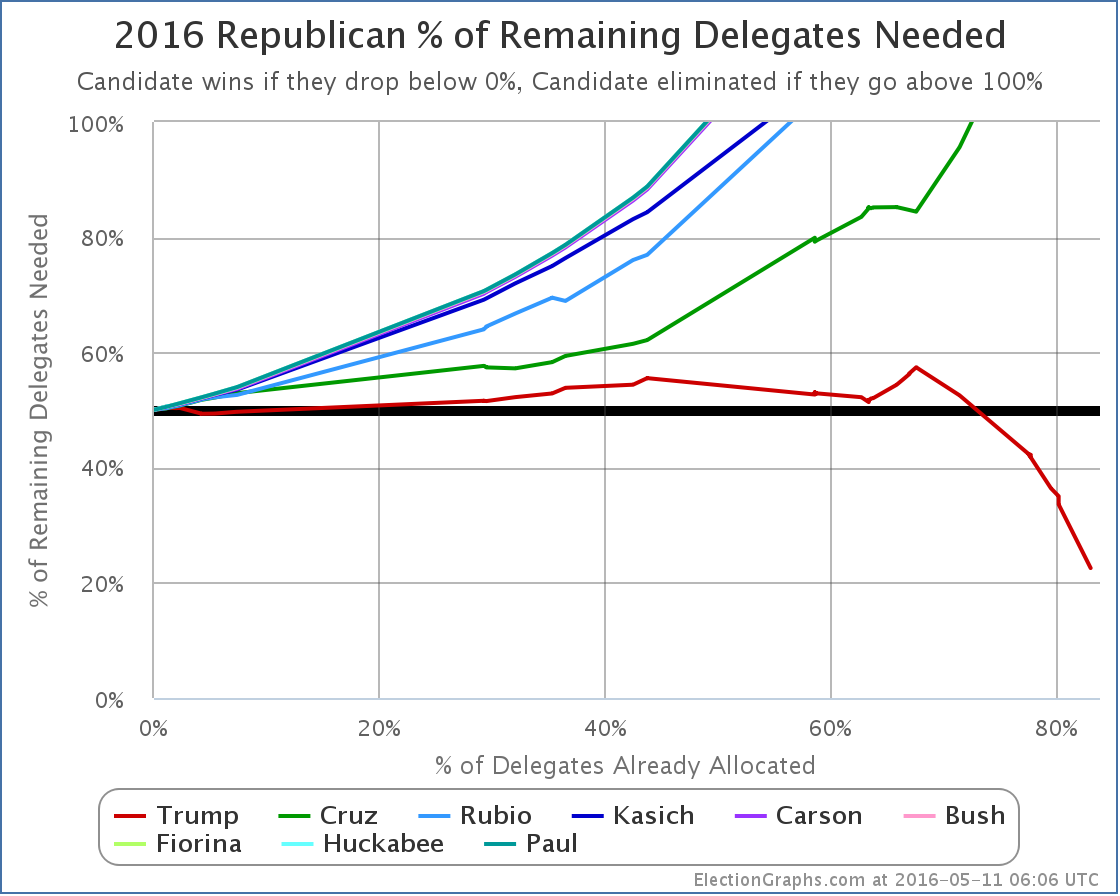
Trump now needs 22.57% of the remaining delegates to win.
Update 2016-05-14 14:31 UTC: Once the geographic restrictions on delegates was finalized and factored in, the final results in West Virginia were officially Trump 30, Kasich 1, Uncommitted 3. Two of the three uncommitted delegates have stated they are for Trump though, so we count this as Trump 32, Kasich 1, TBD 1. Net change from before: Trump -2, Kasich +1.
Update 2016-05-17 17:03 UTC: Update from New York. Net change: Trump -1, Kasich +1.
Update 2016-05-18 17:26 UTC: Update from Guam uncommitted delegates. Net Change Trump +9, Cruz -1.
Note: This post is an update based on the data on ElectionGraphs.com. Election Graphs tracks both a poll based estimate of the Electoral College and a numbers based look at the Delegate Races. All of the charts and graphs seen in this post are from that site. Additional graphs, charts and raw data can be found there. All charts above are clickable to go to the current version of the detail page the chart is from, which may contain more up to date information than the snapshots on this page, which were current as of the time of this post. Follow @ElectionGraphs on Twitter or like Election Graphs on Facebook to see announcements of updates or to join the conversation. For those interested in individual general election poll updates, follow @ElecCollPolls on Twitter for all the polls as they are added.
Absent something really surprising happening… which you never know… could happen… the posts on the Democratic side at this point are essentially just going to be documenting Clinton’s slow but sure march to the Democratic nomination.
On March 5th if you go by states, you would see Sanders winning Kansas and Nebraska, while Clinton only won Louisiana.
Of course, states don’t matter. Delegates do. For the night, Clinton got 59 delegates and Sanders got 50.
In addition, since the post about Super Tuesday there were adjustments for finalized Super Tuesday results and new superdelegate counts. The net result was that Clinton gained an additional 22 delegates while Sanders added 13.
So total since then… Clinton +81, Sanders +63.
At the time of that last post, Clinton needed 40.52% of the remaining delegates to be on track to win. Sanders needed 59.54%.
Actual percentages since then? Clinton 56.25%, Sanders 43.75%. Clearly Clinton easily exceeded her targets, while Sanders… did not.
Actual delegate counts right now: Clinton 1127, Sanders 482, O’Malley 1.
You need 2382 delegates to win. 1610 have already been counted. There are 3153 left to be determined.
Where does that put things now?
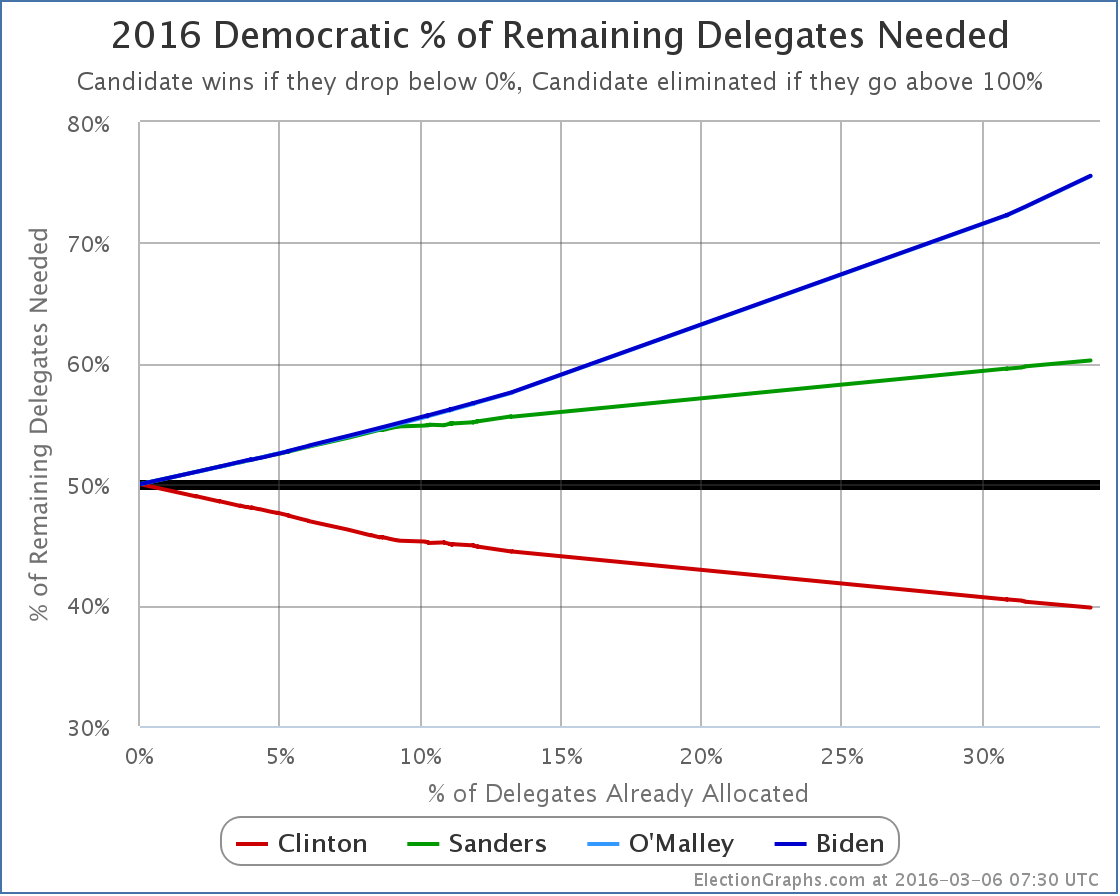
Clinton now needs only 39.80% of the remaining delegates to win.
To catch up and win, Sanders would need 60.26% of the remaining delegates.
Next up is Maine. I haven’t found any polling on Maine. It seems like it might be a good state for Sanders. But is it 60.26% good? In delegate terms that would be 16 of the 25 pledged delegates. Guess we’ll find out.
[Update 15:56 UTC: Overnight updates gave Sanders 1 additional delegate in Louisiana and Clinton 1 less. So if I’d waited until morning to post this the title would have said Clinton won 58 to 51 rather than 59 to 50. But the substance of the post remains the same.]
[Update 2016-03-07 03:07 UTC: Another update gives Sanders yet another delegate in Louisiana and Clinton yet another less. So Louisiana now Clinton 37 to Sanders 14, and March 5th contests overall Clinton 57 to Sanders 52.]
Note: This post is an update based on the data on ElectionGraphs.com. Election Graphs tracks both a poll based estimate of the Electoral College and a numbers based look at the Delegate Races. All of the charts and graphs seen in this post are from that site. Additional graphs, charts and raw data can be found there. All charts above are clickable to go to the current version of the detail page the chart is from, which may contain more up to date information than the snapshots on this page, which were current as of the time of this post. Follow @ElectionGraphs on Twitter or like Election Graphs on Facebook to see announcements of updates or to join the conversation. For those interested in individual general election poll updates, follow @ElecCollPolls on Twitter for all the polls as they are added.
Update 08:40 to add actual delegate counts, how many are left, etc.


|
Romney |
Obama |
| Romney Best Case |
235 |
303 |
| Current Status |
206 |
332 |
| Obama Best Case |
206 |
332 |
The two remaining Nebraska congressional districts were called for Romney shortly before 06:00 UTC.
As of then, that left Alaska and Florida outstanding, but only Florida was ever really in question.
And this wraps up the live coverage of Election 2012 from Abulsme.com. I have to take my wife to the airport now.
Alaska was actually called for Romney already, and I’ll include that in a 6:15 update when I get back.
And then we wait for Florida to tell us if we do indeed end up at the magical 332-206, or if we end up at 303 to 235 instead.
I’ll make a final update once the results in Florida are known.
And then a really final update once the electoral college votes in December, just in case there are any faithless electors.
But for now, thanks for joining Abulsme.com for the election coverage all year long.
Sam out.


|
Romney |
Obama |
| Romney Best Case |
294 |
244 |
| Current Status |
206 |
332 |
| Obama Best Case |
190 |
348 |
No states were called between 01:45 UTC and 02:00 UTC, but a ton were called between 02:00 UTC and 02:15 UTC:
- Romney: KS, LA, NE-All, NE-1, ND, SD, TX, WY, MS
- Obama: MI, NY, NJ
All of these were no brainer expected states, except for Michigan. Michigan is the first state of the night to be called where the margin was less than 5% in the polls, so winning this state made a difference between the “best cases” that I present. Obama was ahead here by 4.5%, so a win here was predicted, but it was a close state and one that Romney really needed.
As of the final update I made on election day, Michigan was the tipping point state. That means Romney had to win all the states he was doing better in than Michigan PLUS Michigan in order to win. He just lost Michigan, which means he now needs a state he was further behind in that Michigan in order to win.
This is very bad news to Romney. His path to victory is now not quite impossible, but very close. Let’s look:
With all the states he has already won, plus the uncalled states where Romney was ahead by more than 5%, he had 190 electoral votes. Then the areas he was ahead in:
- Nebraska 2nd (1): 3.8% Romney lead
- North Carolina (15): 1.4% Romney lead
That gets Romney to 206. He needs 63 more electoral votes. Looking at the remaining states that haven’t yet been called:
- Iowa (6): 2.0% Obama lead
- Florida (29): 2.3% Obama lead
- Colorado (9): 2.4% Obama lead
- New Hampshire (4): 2.8% Obama lead
- Maine 2nd (1): 2.8% Obama lead
- Virginia (13): 3.6% Obama lead
- Pennsylvania (20): 4.8% Obama lead
- Nevada (6): 4.8% Obama lead
If Romney wins all of those through Pennsylvania, it gets him to 288 electoral votes, which wins him the Presidency. If he doesn’t win Pennsylvania to win, he needs every other one of those states, including Nevada, which would get him to 274. If he does win Pennsylvania, then he could afford to lose Virginia, New Hampshire and Maine’s 2nd (and Nevada).
But that is a very tall order! And there will be another update coming soon…

One change today, and as the headline implied, it is Nebraska’s 2nd congressional district. Nebraska is one of two states (the other is Maine) that does not award electoral votes with a winner take all formula. Instead, you get two electoral votes for winning the state as a whole, and then one electoral vote for winning each congressional district. In 2008, McCain won the state, but Obama got one electoral vote for winning Nebraska’s 2nd district, which is the district containing the city of Omaha. Nebraska as a whole, and Nebraska’s 1st and 3rd congressional districts are all very safely Romney. But the 2nd?
Polling in Nebraska’s 2nd has been extremely sparse. I have only five data points in my spreadsheet since the 2008 election… and that is only because I include both values when a poll includes results for both registered and likely voters. (Yeah, yeah, that is probably methodologically unsound, I’ll reconsider in 2016.) So really, only 4 polls since 2008. And only three of them were in the last 12 months. So we don’t have a great picture. But lets look at what we do have:

I’m showing the whole last year rather than just the last three months due to the paucity of polling.
Until today, the five poll average still included the “seeds” from the 2004 and 2008 elections. In 2004 Kerry lost Nebraska to Bush by a full 22%, so that significantly depressed the average. If you did my five poll average only counting the results of the new poll for likely voters, the average would now be a Romney lead of 2.6%. Using my normal rules for the five poll average, you get a 3.8% Romney lead. There are other ways you could compute an average for NE-2 depending on how you want to weight current polls vs older polls, etc. But given that the polls we have seen this year show a 1% Romney lead (in March), a tie (in September), and a 5% lead (now, looking at either Registered or Likely voters) it seems fair to lump NE-2 in with the states where Romney is ahead, but by less than 5%.
So Romney is ahead in NE-2, but it is close. With my five poll average officially at a 3.8% Romney lead, that does mean though that while close, Florida and North Carolina are both considerably closer. Any situation that includes NE-2 going for Obama is likely to actually be an Obama blowout. Well, with how sparse the polling is, maybe it really isn’t fair to say that. There just isn’t enough data to really place NE-2 well on the spectrum. We have only the vaguest idea what is really going on there. So absent more polls here in the final days, we’ll list NE-2 as the “most likely surprise” in this election. It represents the “closest” electoral vote that hasn’t been polled heavily this year.
Anyway, this gives us a slightly different map and summary:

|
Romney |
Obama |
| Romney Best Case |
321 |
217 |
| Current Status |
235 |
303 |
| Obama Best Case |
190 |
348 |
So Obama’s best case improves by 1 electoral vote to a 348 to 190 win. That is a nice win, although still substantially short of his 365 to 173 in 2008.
Obama’s best case IS possible, just like Romney’s best case is. It seems like either of those though would require something actually happening in the remaining days of the campaign to move things in that direction, rather than just a continuation of normal campaigning.
Maybe Hurricane Sandy? Dunno. We’ll see.
Anyway, looking at the close areas again, just to see where we are:
- Nebraska 2nd (1): 3.8% Romney lead
- North Carolina (15): 2.4% Romney lead
- Florida (29): 0.8% Romney lead
- Virginia (13): 0.4% Obama lead
- New Hampshire (4): 1.0% Obama lead
- Iowa (6): 1.2% Obama lead
- Ohio (18): 2.0% Obama lead
- Colorado (9): 2.8% Obama lead
- Nevada (6): 2.8% Obama lead
- Wisconsin (10): 3.8% Obama lead
- Pennsylvania (20): 4.6% Obama lead
Romney gains a little bit in Ohio, so that state once again is the “tipping point state”. So the percentage Romney has to move every state in order to win is down to 2.0% (from 2.8% yesterday).
I mentioned yesterday that I might produce a “spiffy graph” showing the trend in this number… specifically the margin in the tipping point state over time… which can otherwise be thought of as the amount of “uniform movement” across all the close states that would have to happen to flip the winner. Well… I’ve been working on it… it requires pulling some historical data I didn’t explicitly keep track of at the time… but it isn’t quite done yet, and I am rapidly approaching the 00:00 UTC deadline I give myself for the daily updates. So maybe I’ll have that in the NEXT update. Sorry about that kids.
In the mean time, suffice it to say that the state of the race remains that Obama has a small but consistent lead in the critical states. If nothing changes, he will most likely win. But Romney remains within striking distance if something happens to move things his direction, or to a degree just if he has a really lucky day with turnout factors on election day.
But it is still looking like an Obama win in the electoral college.
(With the possibility of a split between that and the popular vote seemingly growing daily.)
Note: Chart and map from the Abulsme.com 2012 Electoral College Prediction page. Both assume Obama vs Romney with no strong third party candidate and show polling as it currently exists. Things will change before election day. On the map red is Romney, blue is Obama, gold states are too close to call. Lines on the chart represent how many more electoral votes a candidate would have than is needed to tie under several different scenarios. Up is good for Obama, Down is good for Romney.


Charts from the Abulsme.com 2012 Republican Delegate Count Graphs page. The first chart is the % of delegates the candidate has collected, the second is the number of delegates. These numbers include estimates of the eventual results of multi-stage caucus processes which will be refined as the later stages occur.
And so, yesterday, on July 14th, Nebraska had their state convention. Nebraska ends up 32 Romney, 2 Paul, 1 TBD.
And with that, the last major scheduled event on the 2012 Primary calendar comes to a close.
We end up with: 1531 Romney, 257 Santorum, 156 Paul, 142 Gingrich, 1 Bachmann… and 199 TBD.
Of course at some point those 199 TBD’s have to make up their minds and vote for somebody at the convention (or abstain). And in all likelihood many of the non-Romney’s will end up voting for Romney after all. Or the convention may just have a motion to declare Romney the winner by acclimation and we may never get a full vote count. In previous years though, in the final roll call vote, the winner has gotten much more than their totals at the end of the primary season would indicate, and everybody else has gotten less.
Not to mention, to be officially nominated at the convention, you need to have won at least five state contests. So a quick look at that total:
- Romney – 41 contests (Most Places) plus 2 ties (Alaska, Mississipi)
- Santorum – 3 contests (Alabama, Kansas, Oklahoma) plus 2 ties (Alaska, Mississipi)
- Paul – 3 contests (Iowa, Maine, Minnesota)
- Gingrich – 2 contests (Georgia, South Carolina)
In Montana and Pennsylvania uncommitted delegates are in the plurality.
There is also Louisiana, where there is a lawsuit between the Romney and Paul people that leaves the final delegate winner still undetermined.
(These add up to more than 50 due to DC, Puerto Rico, Guam, American Samoa, etc.)
In any case, unless there are defections in those two tied states that let Santorum claim them, it looks like Romney is the only one eligible to even be nominated.
There may be additional delegate changes on the margin, but I believe this is the last “event” prior to the convention.
So there we are. I’ll update after the convention if an official final delegate vote count is released.
Edit 2012 Jul 16 16:52: It has been pointed out in several places that technically speaking that unlike the actual vote for the presidential nominee, the votes for the “plurality” needed to nominate are not bound in any state. So therefore even in states where Paul does not have a plurality of the delegates, if a plurality of the delegation wishes to put Paul in nomination they could. This is perhaps most relevant in the cases where the delegate count is bound by primary results, but Paul managed to get his supporters elected to the actual delegate slots. In these cases, those delegates might give their state a plurality in favor of nominating Paul, but then those delegates would still be required to vote for Romney when the actual vote for the nominee came up. This seems like it is unlikely to actually happen unless the Romney folks decide it is in their best interest to let it happen. Also mentioned frequently, is that there is no binding at all on the nominations or voting for Vice President. So, if Paul’s folks wanted to make a show of it and cause trouble, they could nominate Paul for VP, regardless of Romney’s stated preference for that spot, then force a vote on it. Romney’s choice would then win of course, but we’d have a little drama first.


Map and chart from the Abulsme.com 2012 Electoral College Prediction page. Both assume Obama vs Romney with no third party strong enough to win states. Lines on the chart represent how many more electoral votes a candidate has than is needed to tie under several different scenarios. Up is good for Obama, Down is good for Romney.
So my update today included a new PPP poll in Nebraska. This poll included a breakdown by congressional district, which is useful because Nebraska is one of two states (the other is Maine) which currently have the potential of splitting their electoral college vote. Both states do this with 2 electoral votes going to the statewide winner, then 1 electoral vote for the winner of each congressional district. Thanks PPP for actually doing the CD split!!
Anyway, as I was adding the new data points for Nebraska at large and each of the three congressional districts, I noticed the previous data for the 1st and 2nd congressional districts included some errors. (Specifically the 2008 Republican and Democratic results were reversed… I use the 2004 and 2008 elections to seed the numbers for states that have had less than five actual Obama vs Romney polls.) The end result of this was that the 1st district had been classified as Weak Romney when it should have been Strong Romney, and the 2nd district was classified as Strong Romney when it should have been Weak Romney. I corrected this and the new poll results didn’t change the classifications again.
The net result of this is just that on the map I had the wrong one of the three boxes in Nebraska light red. It should have been the 2nd box instead of the 1st. This has now been corrected. Since both districts are one electoral vote and the changes balanced each other, the lines on the graph do not change at all.
The summary remains:
|
Romney |
Obama |
| Romney Best Case |
278 |
260 |
| Current Status |
210 |
328 |
| Obama Best Case |
170 |
368 |
Note 2012 May 23 10:43 UTC: Due to an error in my spreadsheet, a change in status for Wisconsin from Weak Obama to Strong Obama that should have been noted on this update on March 30th, was prematurely made on March 2nd. The corrected time series chart can be seen starting with the May 23rd update. Thanks to Darryl at HorsesAss for finding the mistake.
Note 2012 Jun 16 21:22 UTC: Actually, with more information, the Wisconsin transition should have happened on March 31st. See the correction on the June 19th update.
|
|


