This is the website of Abulsme Noibatno Itramne (also known as Sam Minter). Posts here are rare these days. For current stuff, follow me on Mastodon

Categories

Calendar

Electoral College: Georgia a swing state?

Since the last update on the Electoral College picture there have been polls in Wisconsin, California (x2), Mississippi, Virginia, Pennsylvania (x2), Maryland (x2), New York (x5), Connecticut, Massachusetts, New Jersey, Utah, and Georgia. The only one of these that resulted in a change in the overall 2016 electoral college summary was the poll in Georgia.

That poll was bad news for both Trump and Cruz. It showed both of them losing to Clinton. We don’t pay attention to individual polls of course, we look at the averages. But in both cases adding in this new poll drops the Republican lead in Georgia to less than 5%, which means that Georgia may be in play for Clinton this year. Georgia hasn’t been blue since 24 years ago when it voted for another Clinton in 1992.

Lets look specifically at the two match-ups here:

Clinton vs Trump

chart-105

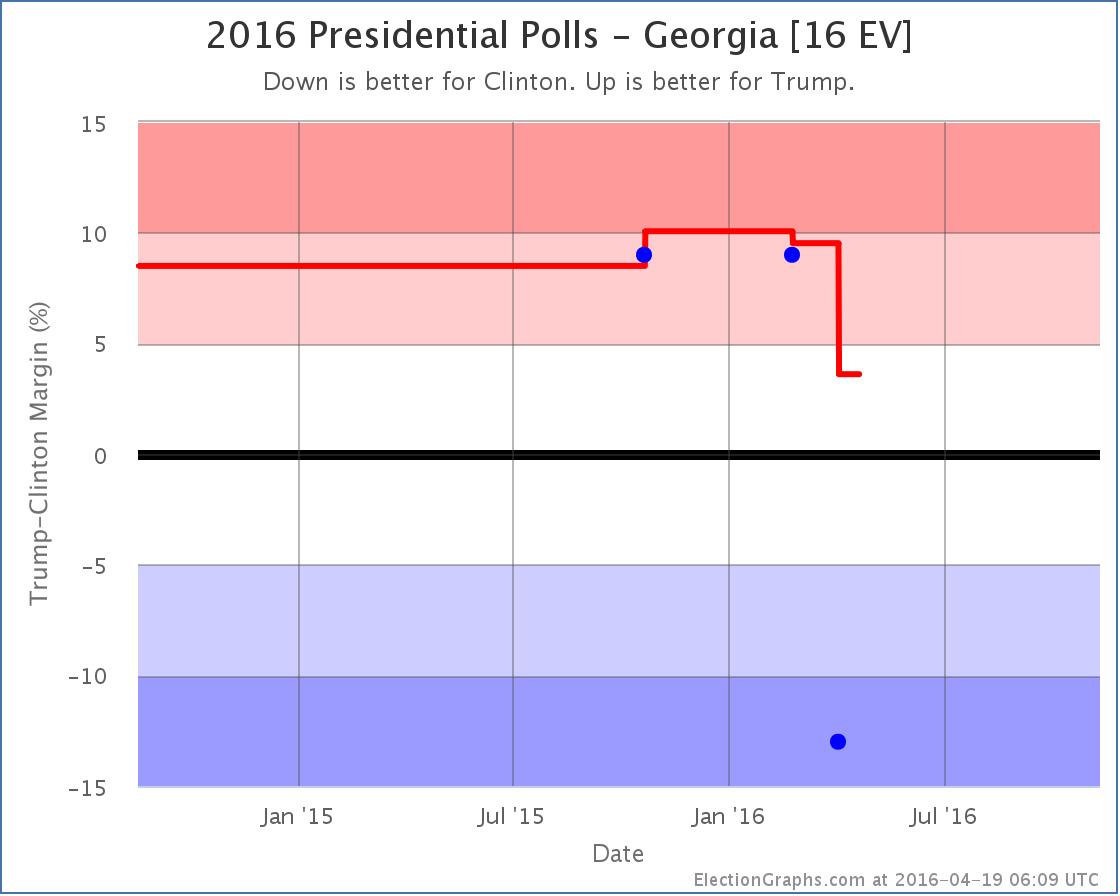
Georgia has been sparsely polled. It was not particularly expected to be a swing state. For Clinton vs Trump we only have three polls and so are still using the 2012 and 2008 election results to fill in the poll average. This new poll represents a really large move from the others as well, so there is a potential that future polls will show it to be an outlier.

But with those caveats, we now only have a 3.6% lead for Trump, which is close enough that we include picking up Georgia in Clinton’s “best case”.

chart-106

Screen Shot 2016-04-19 at 13.50.16284

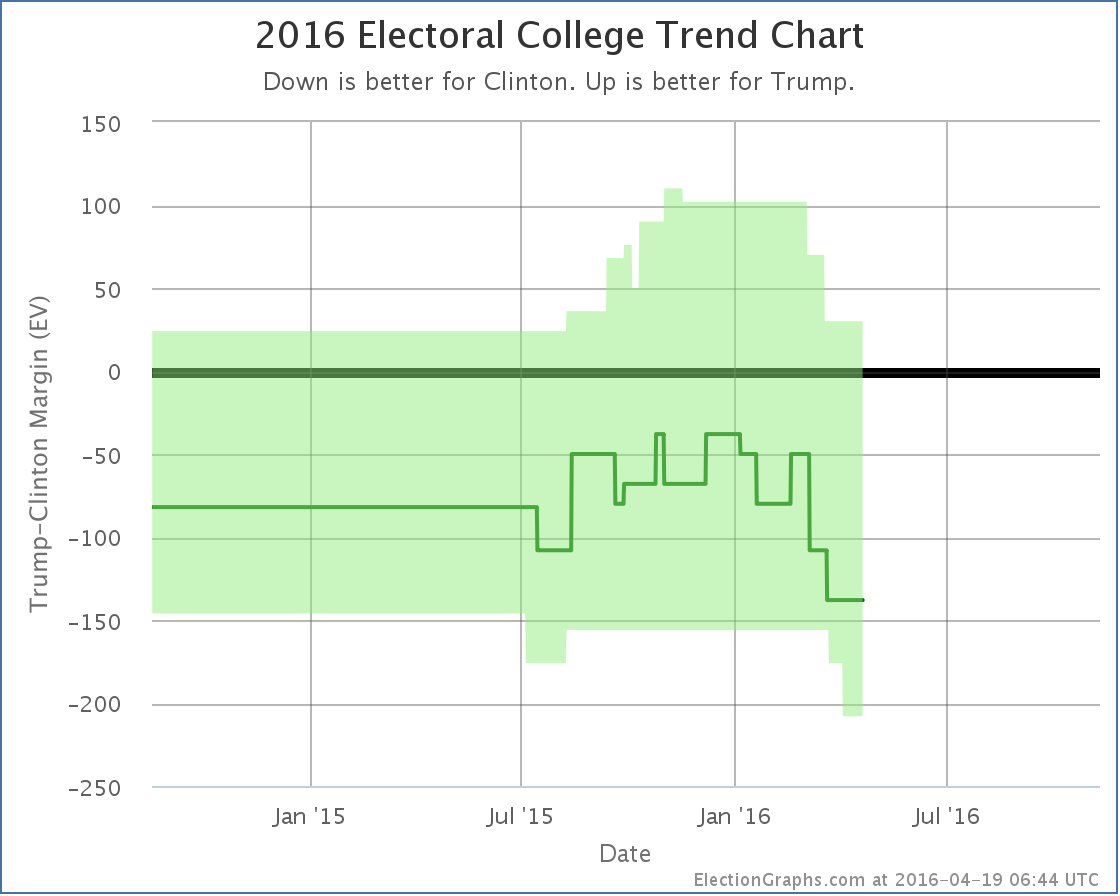
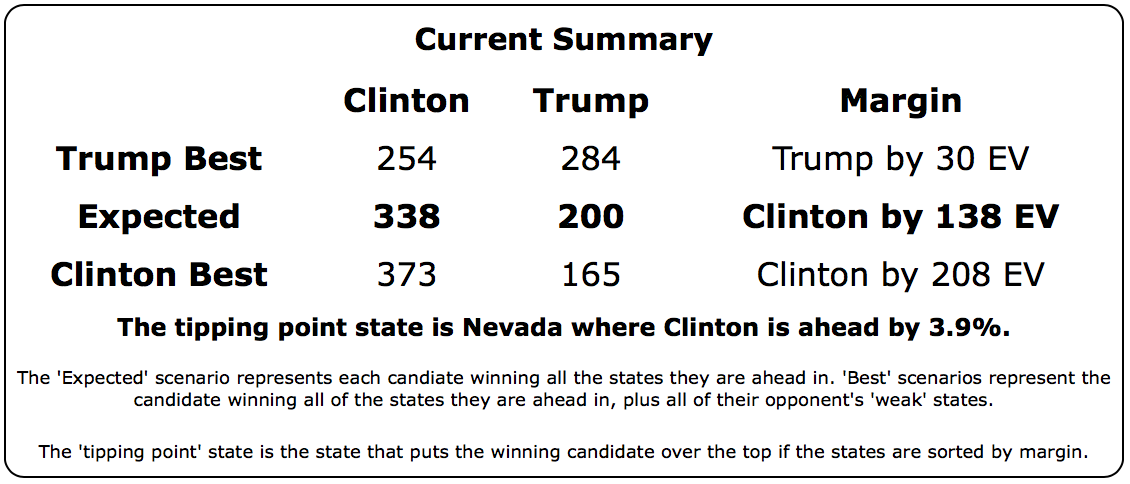
Clinton’s best case, where she wins not only the states she is ahead in, but also picks up the states where she is currently less than 5% behind… that would currently be Colorado (1.9% Trump lead), Georgia (3.6% Trump lead), and Missouri (4.7% Trump lead)… is now a 208 electoral vote win. The last time the margin was that large was when Bill Clinton beat Bob Dole with a 220 electoral vote margin in 1996.

Keep in mind however that this is Clinton’s best case. The “expected” result is a narrower 138 electoral vote win. That is in between Obama’s win in 2012 (126 electoral votes) and his win in 2008 (192 electoral votes).

Trump’s best case, where he picks up all six of the weak Clinton states (North Carolina, Iowa, Florida, Ohio, Nevada, and Minnesota) is still to pull out a 30 electoral vote win.

The downward trend in Trump’s general election polling that started in January continues. The questions are “How far does he fall before he bottoms?” and “Can Trump rebound after that?”.

Assuming he is the nominee of course.

Time to look at the other contender:

Clinton vs Cruz

chart-107

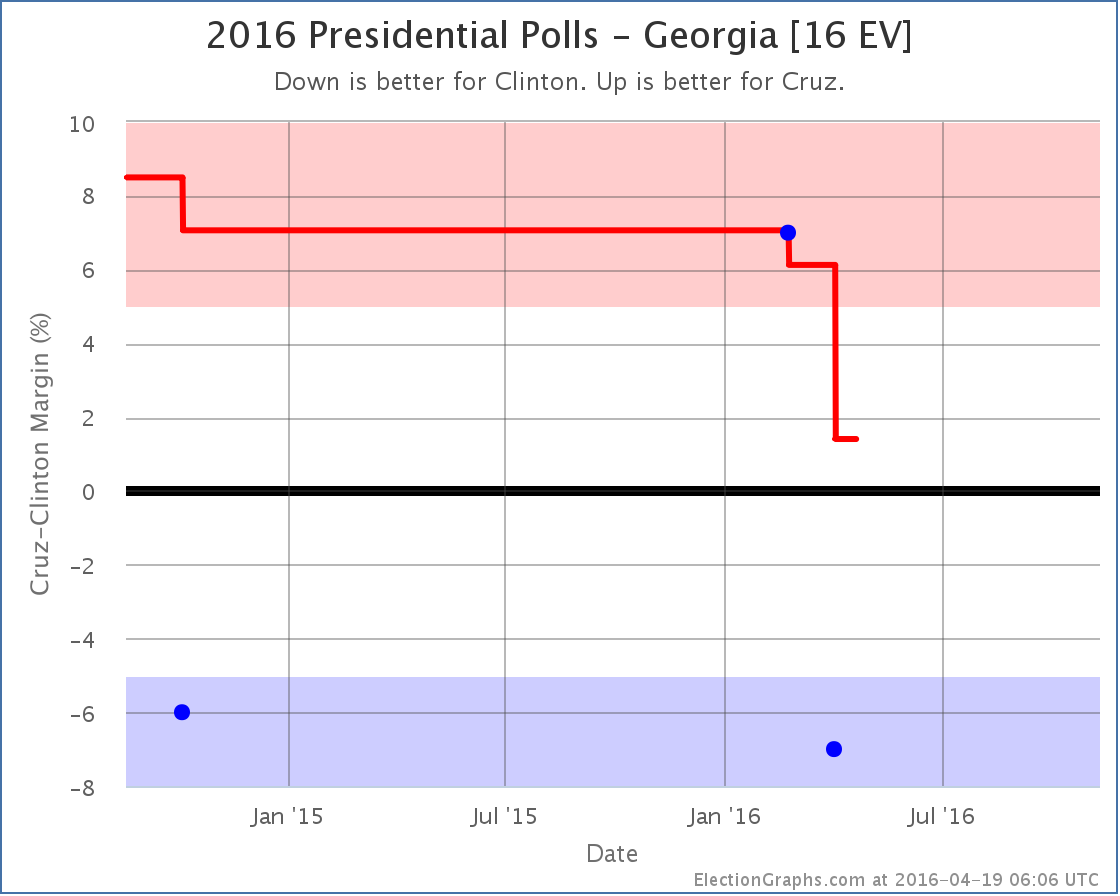
Like Clinton vs Trump, there have only been three polls of Clinton vs Cruz, but in this case one of the three is much older. We’re still filling the average with the 2012 and 2008 election results as well.

With the new poll, Cruz’s lead in Georgia is down to only 1.4%. Unlike the Clinton vs Cruz case we actually have two polls showing a similar result, so the case that this is just an outlier is a little weaker.

In any case, the average now shows Georgia as a close state.

chart-108

Screen Shot 2016-04-19 at 14.18.36020

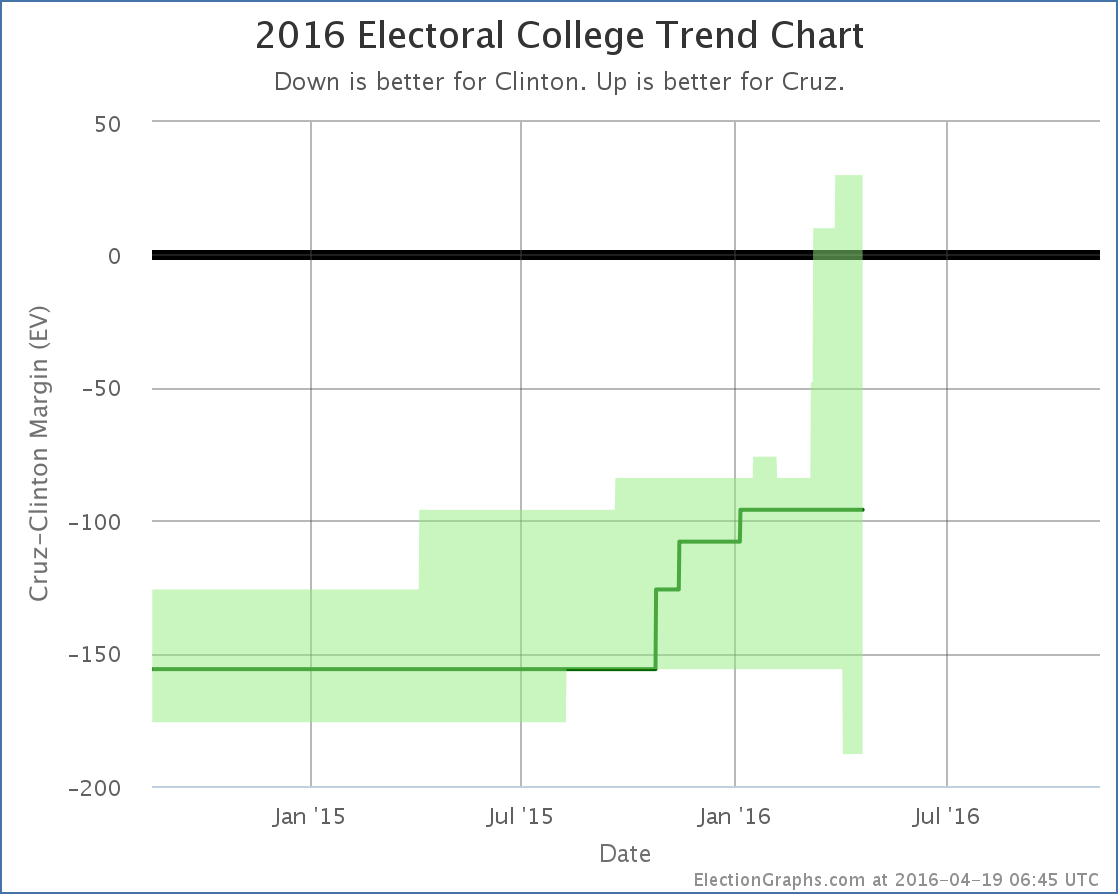
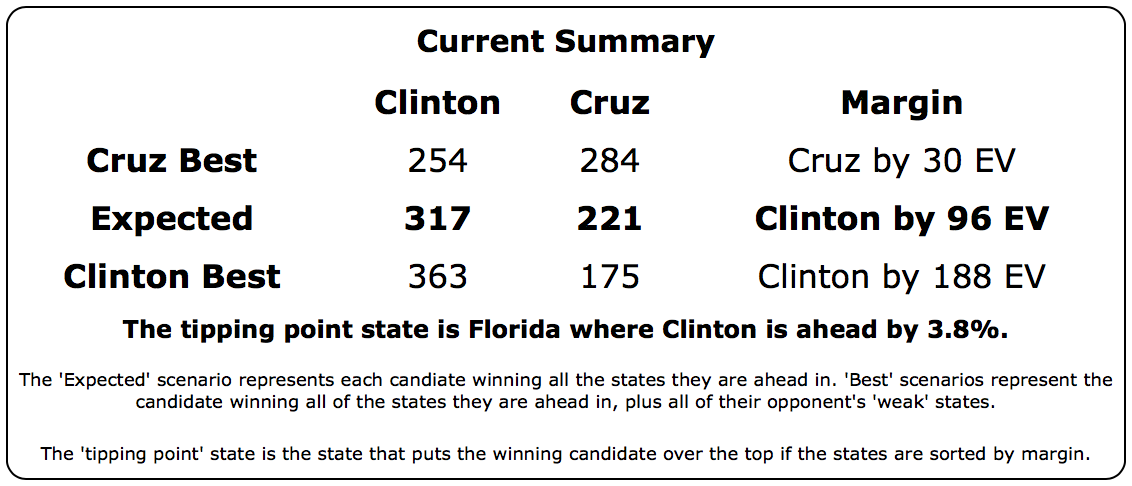
Clinton’s best case here improves to winning by 188 electoral votes.

Comparing Cruz and Trump, Cruz is doing better in the tipping point metric, in his worst case, and his expected case. He and Trump tie in their best case, with the narrow 30 electoral vote win.

Cruz’s trend has also generally been an improving trend. Today’s change is actually notable for being only the third decline for Cruz in my summary in the last year.

This decline then brings up the opposite question than the one we asked about Trump. Rather than asking when we will reach a bottom, with Cruz the question is when he will peak.

203.4 days until the general election polls start to close.

Note: This post is an update based on the data on ElectionGraphs.com. Election Graphs tracks both a poll based estimate of the Electoral College and a numbers based look at the Delegate Races. All of the charts and graphs seen in this post are from that site. Additional graphs, charts and raw data can be found there. All charts above are clickable to go to the current version of the detail page the chart is from, which may contain more up to date information than the snapshots on this page, which were current as of the time of this post. Follow @ElectionGraphs on Twitter or like Election Graphs on Facebook to see announcements of updates or to join the conversation. For those interested in individual general election poll updates, follow @ElecCollPolls on Twitter for all the polls as they are added.

@abulsme tweets from 2016-04-18 (UTC)

@ElectionGraphs tweets from 2016-04-17 (UTC)

@ElecCollPolls tweets from 2016-04-17 (UTC)

  • 15:54:10 Blog post about Republican delegate results in Wyoming up at @ElectionGraphs. Also includes comparison to 2008 and 2012.

@abulsme tweets from 2016-04-17 (UTC)

Republicans: Trump whiffs in Wyoming too, but New York is coming

Wyoming allocated delegates in a two stage process. 12 were determined back on March 12th. At that point the count was Cruz 9, Rubio 1, Trump 1. One uncommitted delegate was elected as well. He appears to still be uncommitted.

On April 16th Wyoming completed their process, allocating their remaining 14 “normal” delegates at their state convention. All 14 delegates went to Cruz. There are three more delegate slots for party leaders. They have not yet expressed their preferences.

This once again appears to be a case of the Trump team not even bothering to “play” in Wyoming and just letting Cruz clean up essentially unopposed. This in a race where Trump needs every delegate.

In addition, since my last post there was an update in North Carolina that resulted in moving one delegate from the Trump column to the Carson column of all places. So the net change in the last week is Cruz +14, Carson +1, Trump -1.

This obviously represents less than the 57.07% of delegates Trump needed to be on pace for a win.

Time to look at some charts:

chart-104

Looking at the raw delegate count, Cruz looks like he is catching up quickly. And he has been doing extremely well recently. But there is a problem. It is very late in the process.

chart-103

Cruz’s win streak has succeeded in lowering his % of remaining delegates needed to win, but not by a lot. It has dropped from 83.68% to 82.80%. This is still a number that Cruz can not realistically reach.

So Trump. His 57.07% increased to 58.17%.

New York is next. Trump is expected to do very well in New York. But the specific line to watch is the 58.17% line. Translated into delegates, this means to be on track to get to a delegate majority, he needs at least 56 of the 95 delegates. The expectation seems to be that he will exceed this bar, probably by a significant margin.

Even if Trump got all 95 delegates though, it still wouldn’t completely undo the damage of Cruz’s winning streak. In that case Trump would need 52.69% of the remaining delegates. Trump had been down to 52.22% before his string of losses. So shutting everybody out in New York wouldn’t quite get him back there. Close though.

After New York, there are quite a few more states where Trump is expected to do very well and some of them are winner take all. We’re still right on the edge between an outright Trump win and a contested convention. Anybody who says either of those two outcomes is certain at this point is premature.

We’ll see what happens in New York shortly, and the “narrative” of the race will almost certainly turn again. In the meantime, let me update the comparisons to 2008 and 2012 that I did back on March 13th.

First of all just the % of delegates won:

Screen Shot 2016-04-17 at 15.39.13068

Then the more important “% of remaining delegates needed to win”:

Screen Shot 2016-04-17 at 15.40.27028

It is still possible for Trump to win outright. Barely. But it is very very clear that his path is dramatically different than the McCain or Romney patterns. In both of those cases, by this point the frontrunners were clearly the presumptive nominees, even though they hadn’t quite wrapped it up mathematically yet.

This year Trump still has a minority of the delegates, and he hadn’t even been trending in the right direction. We’re not in the “wrapping things up” stage, instead, we clearly still have a fight going on.

Which of course makes this all much more fun to watch than 2008 or 2012 were. :-)

[Update 2016-04-20 01:27 UTC: New delegate estimate from Georgia nets Cruz +1, Trump -1. This does not change the analysis above.]

Note: This post is an update based on the data on ElectionGraphs.com. Election Graphs tracks both a poll based estimate of the Electoral College and a numbers based look at the Delegate Races. All of the charts and graphs seen in this post are from that site. Additional graphs, charts and raw data can be found there. All charts above are clickable to go to the current version of the detail page the chart is from, which may contain more up to date information than the snapshots on this page, which were current as of the time of this post. Follow @ElectionGraphs on Twitter or like Election Graphs on Facebook to see announcements of updates or to join the conversation. For those interested in individual general election poll updates, follow @ElecCollPolls on Twitter for all the polls as they are added.

@ElectionGraphs tweets from 2016-04-16 (UTC)

@abulsme tweets from 2016-04-16 (UTC)

Curmudgeon’s Corner: Weird Things Happening

This week on Curmudgeon’s Corner Sam and Ivan talk about Election 2016 of course. But first some bits about Mike the headless chicken, the comments on Sam’s Election Graphs site, stamp prices, Hey Siri, and a movie Sam watched. When they do get to the election they cover Trump’s shutout in Colorado, Trump’s general malpractice in delegate wrangling, the odds of a contested convention, the accusations of cheating in both parties, and much more!

Click below to listen or subscribe… then let us know your own thoughts!

CCCover20151125bw
Recorded 2016-04-14

Length this week – 1:20:15

1-Click Subscribe in iTunes
View Podcast in iTunes
View Raw Podcast Feed
Download MP3 File
Follow the podcast on Facebook

Show Details:

  • (0:00:41-0:22:29) But First
    • Ivan in his Car
    • Mike the Headless Chicken
    • Election Graphs Comments
    • Stamp Prices
    • Facebook Bots
    • Hey Siri
    • Movie: Mississippi Burning (1988)
  • (0:23:08-1:00:14) Election 2016
    • Trump shutout in Colorado
    • Delegate wrangling malpractice
    • Contested Convention Scenarios
    • Ryan saying no… Again
    • Odds of Trump getting majority
    • Trump Trends
    • Cruz wooing delegates
  • (1:00:53-1:19:55) Election 2016 Continued
    • Cheating? Stealing? Unfair? Rigged?
    • Sanders “contesting” the convention
    • Sanders attempts to woo superdelegates
    • Edit wars on Wikipedia Superdelegate list
    • Denial from Trump and Sanders people
    • What Sanders and Trump didn’t do
    • When is New York again?
    • Thoughtful Trump people wanted

@abulsme tweets from 2016-04-15 (UTC)