Since the New Hampshire primary, I have seen a flurry of Facebook posts and numerous articles all over the place, first by people suddenly shocked to learn of the existence of superdelegates, then folks complaining about the DNC “screwing over” Sanders, and then folks claiming superdelegates should be ignored because they don’t matter. All this in response to places, like my site electiongraphs.com, that point out Clinton’s huge lead due to superdelegate counts.
My current chart of raw delegate totals looks like this:
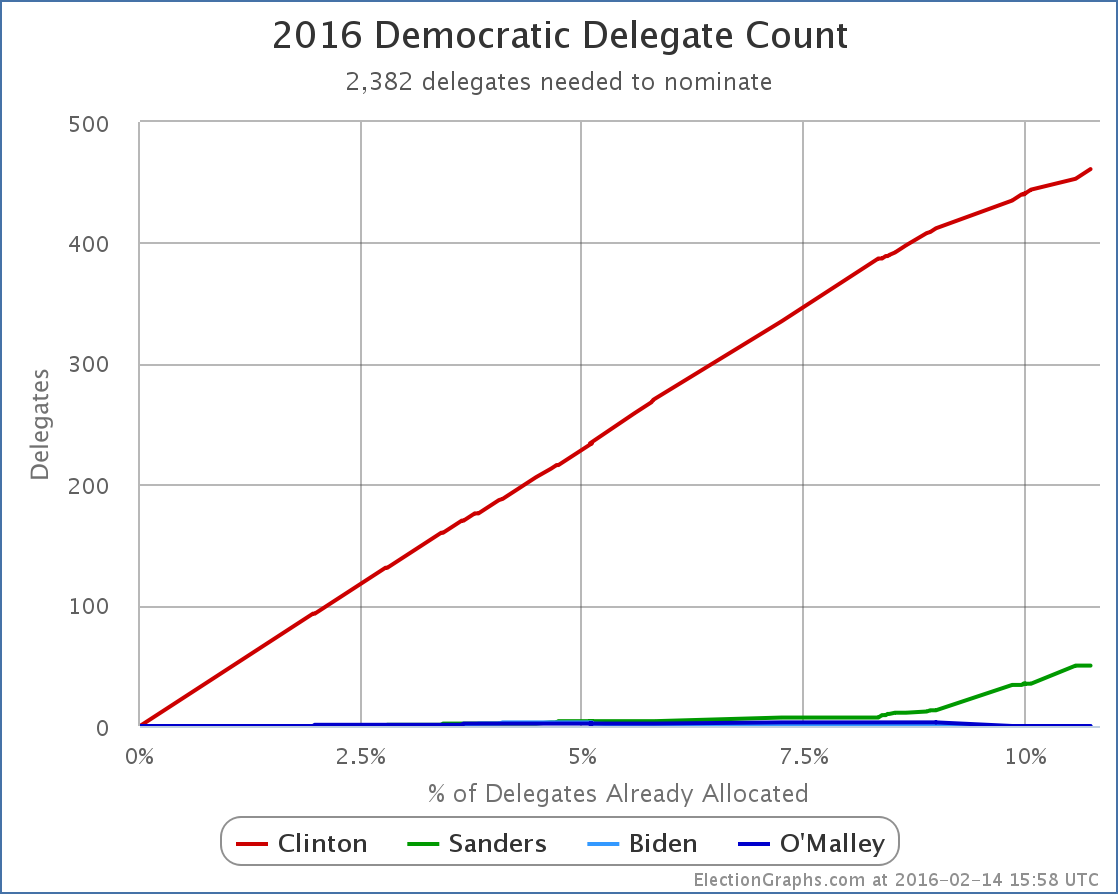
That is Clinton 461 to Sanders 50 including the latest updates that prompt this post.
The claim is that the Clinton lead here is a complete illusion. That counts that look like this are simply anti-Sanders propaganda meant to discourage Sanders voters, that looking at numbers like this is meaningless, and one should only look at “pledged” delegates, where the total right now would be Sanders 36, Clinton 32. That would indeed show a very different picture of the race. Sanders would actually be winning!
But really? Would that tell us where the race really is?
First of all, there isn’t any secret or underhanded manipulation. There are 32 delegates in New Hampshire. 24 of them were to be determined by the primary. Of these Sanders won 15 and Clinton won 9. Some of those are determined proportionately in each congressional district, some proportionately by the statewide results. Those numbers come straight from the votes. Just math.
Then there were also 8 “super delegates”. That is one Senator, one Representative, one Governor, and five members of the DNC. These are eight people who have names and have been known for ages. Six of those eight had declared they supported Clinton long before the primary. The other two haven’t publicly stated a preference yet. That means the delegate total in New Hampshire is now 15 to 15 with 2 not yet determined.
The Sanders folks might not like that, or like the existence of super delegates at all, but none of this is new or an unexpected manipulation or anything, it is simply how the race is structured. A lot of people are expressing shock because they are just now realizing this, but it is no surprise to anyone familiar with the Democratic primary process, and certainly Sanders’ campaign staff is quite familiar with it.
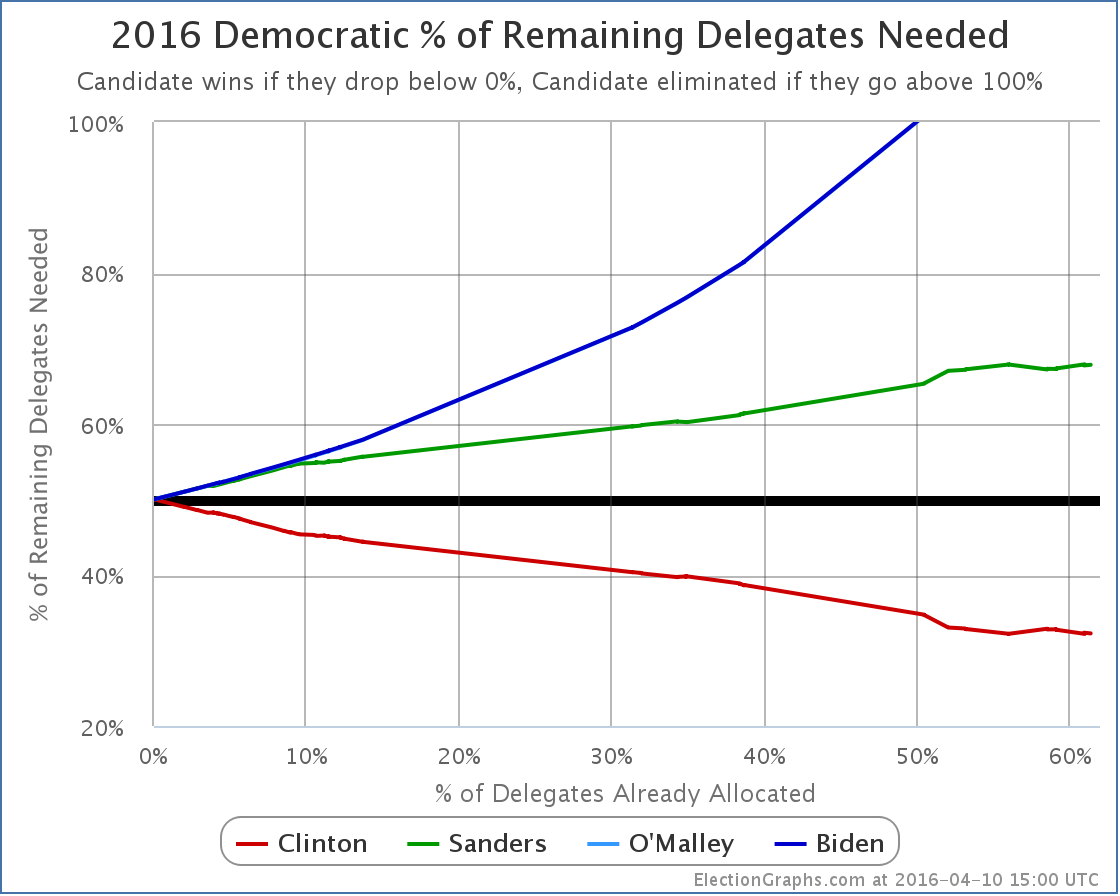
As we’ve chronicled here, Clinton started out with nearly 8% of the national convention delegates already in her column before the first votes were even cast in Iowa and New Hampshire. She has been working on cultivating those people since at least 2013, probably earlier. Sanders managed to get a handful of these folks, but not many. So he started out way behind, and had to get over 54% of the remaining delegates to be on a pace to catch up and win. A majority wasn’t good enough.
It isn’t a good spot to be in for him, and you might argue that super delegates shouldn’t exist. Yes, superdelegates were originally created and exist to give the party apparatus some buffer against a popularly supported insurgency, and that sounds like Sanders. But the superdelegates have existed for decades and they are a known part of the process.
So complaining about them at this point is along the same lines as complaining about the electoral college. The person complaining might be right that in some ways a straight popular vote would be more “fair”, but these were the rules of the game and anybody running knew the rules when they chose to play.
It wasn’t superdelegates specifically that made the difference, but remember that in 2008, Hillary Clinton won the popular vote in the Democratic primary process.* It was only the structure of the delegate race that won Obama the nomination. Because those were the rules of the game. That is still the case today. And that includes superdelegates.
OK, fine, but what about the fact that super-delegates can change their minds? Their votes aren’t locked in stone, and they certainly wouldn’t want to overturn the results if a candidate was winning all the contests and had a majority of the non-super delegates, right? So since they can change their minds and will probably support “the winner” we should ignore them, right?
Indeed, it is important to note that the super-delegates are real people and complete free agents. They can and do change their minds. And yes, superdelegates may be reluctant to be the deciding factor in a close race, but you can’t really say “the super delegates would do X”. It is 712 individual humans, who will each decide on their own what they want to do.
Many superdelegates have yet to express a preference at all and can probably be fairly easily swayed. They have not expressed an opinion for a reason, and may well go either way. Others have publicly supported Clinton, but it could be weak support and maybe they could be flipped if they were actually courted. Many others are actually actively working on the Clinton campaign in prominent state level roles. People in this last category are unlikely to change their votes unless or until Clinton herself drops out and asks them to. At the very extreme, Bill Clinton is a superdelegate. Is he going to vote for Sanders?
You really do have 712 different people, with 712 different reasons for their preferences, and 712 different degrees of how strongly they support their candidate.
If Sanders was serious about the superdelegates, he and his surrogates wouldn’t be pushing talking points about how superdelegates don’t matter and will vote for the popular winner so they should be ignored. Instead he would be heavily lobbying the currently uncommitted superdelegates to start backing him. They are a constituency to be courted. They are an IMPORTANT constituency to be courted.
If you were to see such movement, the first place you would detect it would probably be a higher percentage of currently uncommitted superdelegates raising their hands for Sanders when they do come out and reveal a preference.
Superdelegates who have already publicly stated they are supporting Clinton will probably not start actually flipping back to uncommitted or to Sanders until or unless things are actually looking very dire for Clinton.
If you do end up seeing Sanders winning more contests than he loses and building up a big lead in the regular non-super delegates, you may start to see both kinds of movement. After all, people like backing a winner. But if it happens, you will actually see that change happening in the delegate counts if you watch this site or one of the other places that include superdelegates in the totals. It will not be invisible.
There is no sign of any such movement yet.
Can Sanders win without flipping any Clinton superdelegates over to his side? Yes, of course he can. It is a high bar, but it is within the realm of possibility. He just needs to get about 55% of the remaining delegates.
Can Sanders win with even a smaller portion of the remaining delegates? Why yes, of course he can, if he starts convincing Clinton delegates to change their minds. But if that is going to happen, they have to actually be convinced to do so. Here is a list. Go start lobbying them. Try to change their minds. But nobody should be assuming that is automatic.
Yes, if Sanders ends up leading the non-superdelegate count at the end of the primary season and superdelegates are the only thing putting Clinton over the edge, there will be extreme pressure on the superdelegates to flip. But they still have to actually do so. And most likely, when they start waffling on their positions, they will actually say so, and we will know.
The delegate counts including superdelegates are NOT misleading. You just have to interpret them correctly… meaning that you know superdelegates are actual human beings that can change their minds, and you think about what situations might lead that to happen. But ignoring that they exist and just assuming that of course they will change their minds is extreme folly. It is sticking your head in the sand and ignoring reality. It is willfully blinding yourself in order to believe in an illusion instead. If and when the superdelegates start changing their minds, we will see it. Until or unless that happens, Clinton really does have a huge delegate lead that Sanders would have to overcome in order to win.
Meanwhile, as the Sanders camp has been complaining about superdelegates and how they don’t matter, superdelegate movement to Clinton has continued. Since the New Hampshire Primary results, I’ve added 44 additional superdelegates to Clinton’s column. Not all of these actually announced their support this last week, some did so months ago, but I just found the references more recently. Their support gets backdated in the charts and graphs to the date of the public source documenting their support. I also removed 2 Clinton superdelegates that had been accidentlly double counted. Net gain, Clinton +42.
There were no new Sanders superdelegates.
So where does that put us on “% of remaining delegates needed to win”?
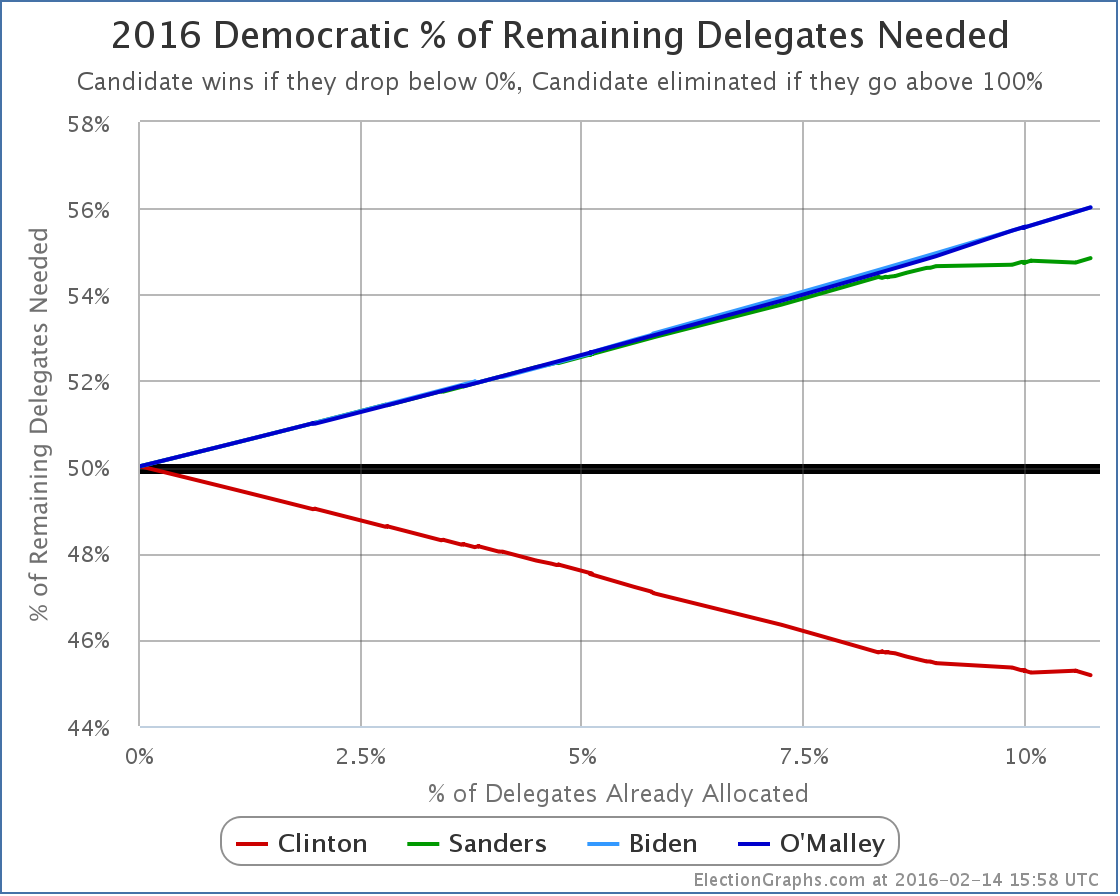
Clinton now needs only 45.18% of the remaining delegates to win.
Sanders needs 54.84%. Right before the Iowa caucuses, my best estimates were that sanders needed 54.22%. (Including pre-Iowa superdelegate preferences I know about now that weren’t included at the time, it would have been 54.65%.) So despite his close second in Iowa, and his win in New Hampshire, Sanders is worse off in the delegate race than he was before Iowa. But not by much… he has ALMOST been holding things steady. He needs to do better to catch up and win, but Iowa and New Hampshire are only a small portion of the overall delegates, so there is still a lot of room to maneuver.
The next delegate race is Nevada.
There are 35 delegates up for grabs in Nevada that will be determined by the caucuses there. Plus 8 superdelegates. Of these, 3 have already said they are for Clinton, and 1 has said they are for Sanders. So don’t be surprised when you see those added in at places showing the state delegate count. They aren’t part of the 35 determined by the caucus though.
Of the 35, Sanders needs to get 20 in order to be on a pace to catch up with Clinton. (Again, assuming no superdelegates change their minds, if a lot do, this number becomes lower.) The RCP average has Nevada at Clinton 47.5%, Sanders 36.0%. That certainly wouldn’t get Sanders the 20 delegates he needs, but that average only includes one post-New Hampshire poll, and that new poll shows the race tied. The Pollster average discounts the pre-New Hampshire results entirely and shows the race at 45% to 45%… a tie.
Delegate rules are tricky. In Nevada some delegates are determined at the congressional district level, others at the state level, there is rounding involved, etc, etc. It is also a multi-stage caucus process, not a primary, so the “real” delegate totals won’t be known until May. But we will have estimates.
Remember though that it is not that Sanders needs 54.84% of the popular vote. It is that he needs 20 of the 35 delegates. That is the number to watch.
And superdelegates of course. :-)
A final thought: It is very possible to catch up from a deficit. But catching up is much harder if you pretend you aren’t actually behind.
* It has been pointed out to me that this would likely not have been the case if Obama had, like Clinton, chosen to compete in Michigan despite DNC sanctions… Clinton essentially ran unopposed in Michigan and this margin was enough to put her in the lead in the national popular vote. If you do not include Michigan, Obama lead the popular vote in 2008. This does not however change the point, which was that there are many ways that the delegate rules can lead to results that differ from the popular vote, of which the superdelegates are only one.
Note: This post is an update based on the data on ElectionGraphs.com. Election Graphs tracks both a poll based estimate of the Electoral College and a numbers based look at the Delegate Races. All of the charts and graphs seen in this post are from that site. Additional graphs, charts and raw data can be found there. All charts above are clickable to go to the current version of the detail page the chart is from, which may contain more up to date information than the snapshots on this page, which were current as of the time of this post. Follow @ElectionGraphs on Twitter or like Election Graphs on Facebook to see announcements of updates or to join the conversation. For those interested in individual general election poll updates, follow @ElecCollPolls on Twitter for all the polls as they are added.
[Edit 18:06 to add link to Wikipedia superdelegate list.]
[Edit 18:48 to add final thought.]
[Edit 2016-02-16 06:50 UTC to add asterisk note about Michigan.]