This is the website of Abulsme Noibatno Itramne (also known as Sam Minter). Posts here are rare these days. For current stuff, follow me on Mastodon

Categories

Calendar

April 2024
S M T W T F S
 123456
78910111213
14151617181920
21222324252627
282930  

Democrats: With win in Puerto Rico, Clinton on the edge of clinching

After the Virgin Islands, Clinton only needed 9.26% of the remaining delegates to win. Sanders needed 90.96% of the remaining delegates.

In Puerto Rico, Clinton got 36 delegates, Sanders got 24.

Since the Virgin Islands, 6 more superdelegates were added to Clinton’s count as well.

So total change since the Virgin Islands: Clinton +42, Sanders +24.

That is Clinton 63.64%, Sanders 36.26%.

So Clinton met her target, Sanders did not.

Updated graphs:

chart (115)

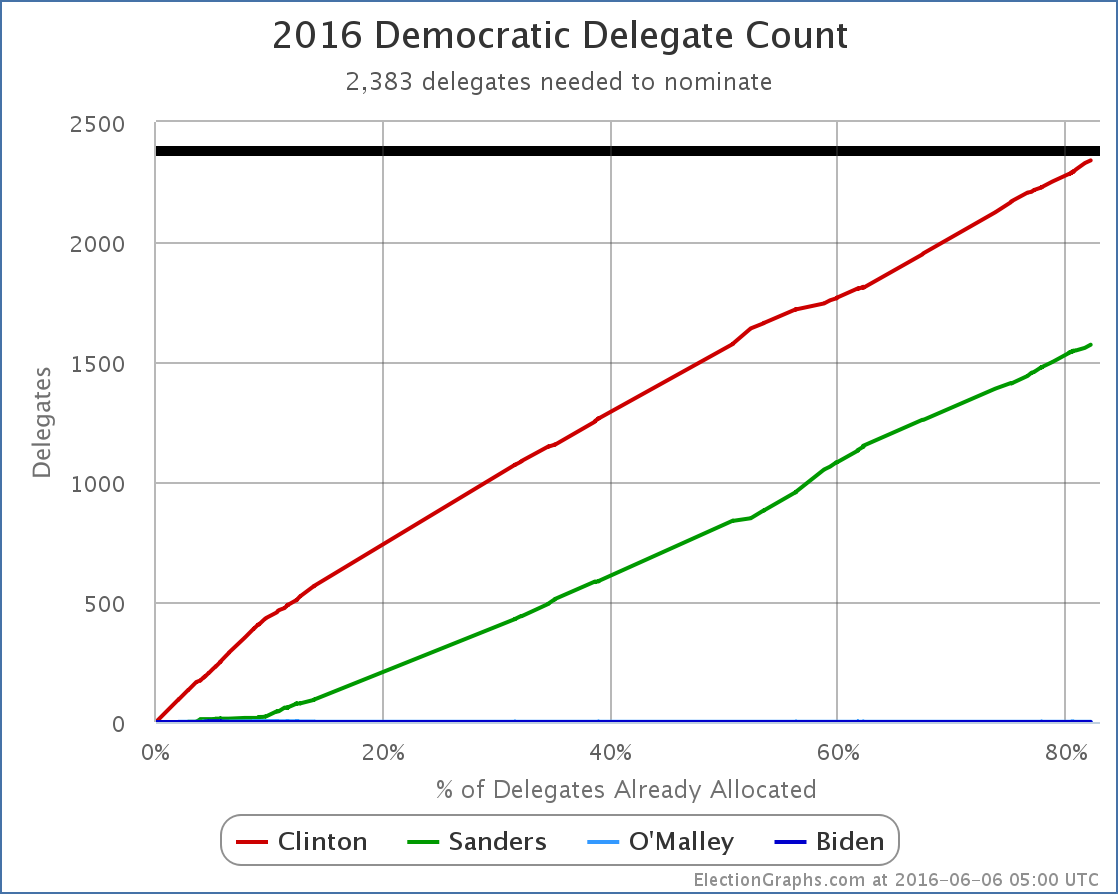
New delegate totals: Clinton 2340, Sanders 1572, O’Malley 1.

There are 852 delegates left. Clinton needs 43 of them. Sanders needs 811 of them.

chart (116)

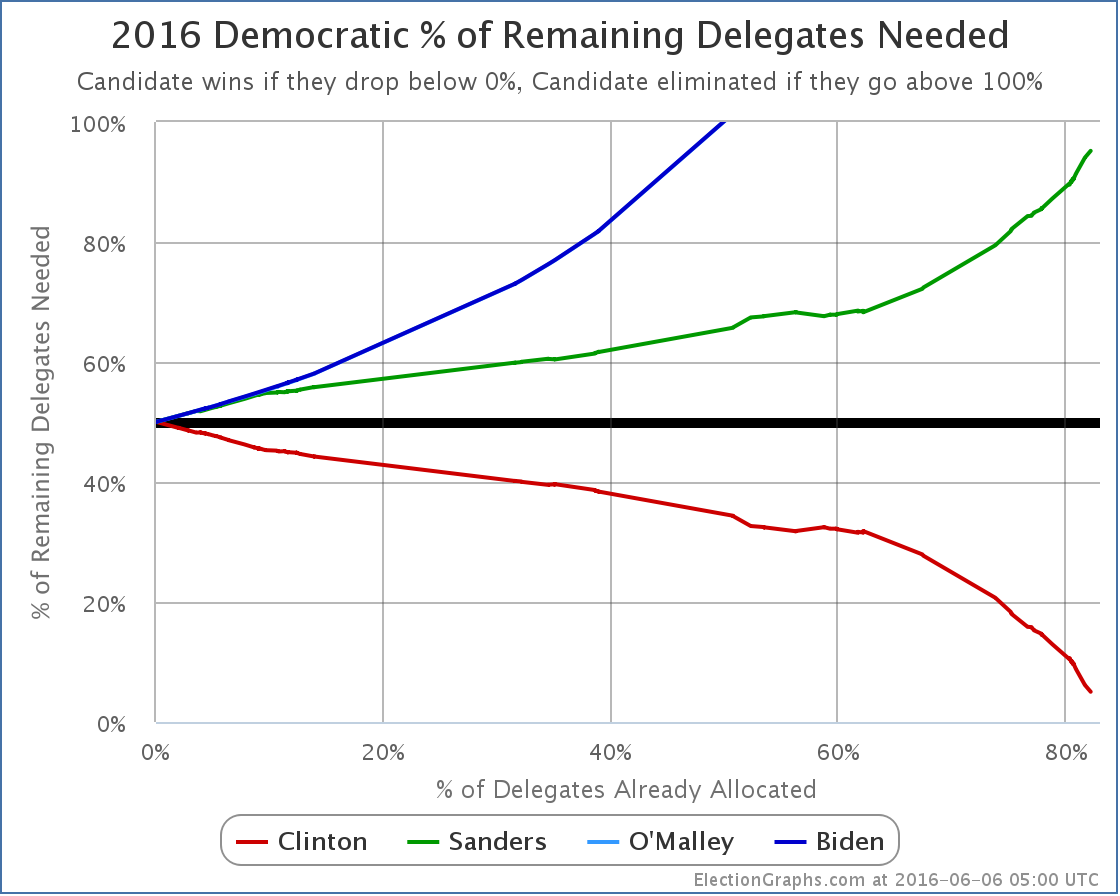
Clinton now needs 5.05% of the remaining delegates to win. Sanders needs 95.19%.

This of course includes superdelegates. Please see any number of previous posts here on Election Graphs as to why it is appropriate to include them, even though they can change their minds until they vote at the convention. If any superdelegates change their minds publicly before then, it will be tracked here.

Right now Clinton only needs 43 more delegates to clinch the nomination. There are still about 139 who have not stated a preference. There have been media reports that Clinton has 40+ superdelegates who have privately committed to her that they are waiting to roll out after the New Jersey results almost certainly push her over 2383 anyway. NBC, AP and some others also have a higher current delegate count than I do for Clinton by about 20 delegates due to information they have collected privately from superdelegates.

Put all of that together, and it is actually very possible, indeed probably very likely, that Clinton ALREADY has more than 2383 delegates that she is sure of. In terms of public confirmation, she is just a few handfuls of delegates away, the number of handfuls depending on whose delegate count you go by.

Superdelegates could give Clinton the nomination at any moment now. But since Clinton would prefer to win after the votes of regular citizens are counted, her campaign is almost certainly asking any currently uncommitted superdelegates leaning toward her to wait. So with as much certainty as you can ever get in these sorts of things, expect Clinton to be declared the presumptive nominee by everybody who does such things shortly after the polls start closing on June 7th.

For this site, the blog post about the June 7th results probably won’t go out until the next morning, but watch @ElectionGraphs on Twitter for hourly updates of the delegate totals, including of course noting when she wins the nomination by our own count.

Update 2016-06-07 00:52 UTC: I almost put “…at the latest.” on the end of the paragraph about the networks calling the result soon after polls start closing on the 7th. But alas, I didn’t. A few minutes ago AP reported that by their count Clinton is over 2383 and is therefore the presumptive nominee. They are including superdelegates who have not yet publicly expressed a preference, but have done so when asked privately. The count here will take a little bit to catch up, since it is dependent on public statements by superdelegates and/or actual election results. But the result will be the same…

Update 2016-06-07 22:31 UTC: My source trying to catch up with superdelegate info resulting from AP’s updated counts. Net Change: Clinton +15, Sanders +1, O’Malley -1. Yes, that one O’Malley superdelegate finally flipped… to Clinton.

Update 2016-06-07 23:55 UTC: Updated the number of superdelegates in a bunch of states as per Green Papers. Most changes were uncommitted slots anyway, but there was a net change of Clinton -1. There was no net change to the total number of delegates.

Note: This post is an update based on the data on ElectionGraphs.com. Election Graphs tracks both a poll based estimate of the Electoral College and a numbers based look at the Delegate Races. All of the charts and graphs seen in this post are from that site. Additional graphs, charts and raw data can be found there. Follow @ElectionGraphs on Twitter or like Election Graphs on Facebook to see announcements of updates or to join the conversation. For those interested in individual general election poll updates, follow @ElecCollPolls on Twitter for all the polls as they are added. If you find the information in these posts interesting or useful, please consider visiting the tip jar.

Edit 17:40 to fix a typo where I said Clinton needed 42 delegates instead of 43 in one of the places it is mentioned.

Republicans: Rubio wins Puerto Rico, still on track for contested convention

Rubio walked away with 71% of the vote in Puerto Rico. Anything more than 50% meant that he got 100% of Puerto Rico’s 23 delegates.

In addition, some of the TBD delegates in Louisiana were determined since the post about the March 5th results. Rubio picked up 5 delegates while Cruz picked up 1. There are still 5 more delegates TBD from Louisiana. It looks like Louisiana’s rules state these should be officially uncommitted delegates, but the national rules don’t allow that this year, so… we’ll see what happens.

Anyway, that means since the last update, Rubio got 28 of 29 delegates… 96.55%! He had needed only 69.50% to be on track to catch up and win outright!

Uh, of course, nobody expects Rubio to continue at this pace in the next few states.

So lets look at where this puts the “% of remaining delegates needed to win” for the whole field:

chart-66

You see that dip downward for Rubio? He does actually improve this time around. Now he only needs 68.94% of the remaining delegates to catch up and win! That still seems unlikely given he only has 17.09% of the delegates so far, but at least he went in the right direction for once.

In the mean time, everybody else’s position got worse.

Specifically, Trump moved from needing 52.88% of the remaining delegates to needing 53.85%. For each contest where he fails to reach his needed percentage, the bar for the remaining contests gets higher.

The current delegate totals are: Trump 391, Cruz 304, Rubio 154, Kasich 37… and 15 for people who have dropped out.

Next up on Tuesday for the Republicans are Hawaii, Idaho, Michigan and Mississippi. Lets take a quick look at how they look if we assume today’s RCP poll averages

Michigan (59 delegates):

  • RCP Poll average: 37.3% Trump, 19.8% Cruz, 16.8% Kasich, 15.2% Rubio
  • Estimated delegates: 25 Trump, 13 Cruz, 11 Kasich, 10 Rubio

Mississippi (40 delegates):

  • Only recent poll: 41% Trump, 17% Cruz, 16% Rubio, 8% Kasich, 5% Carson
  • Estimated delegates: 24 Trump, 10 Cruz, 6 Rubio

Idaho (32 delegates):

  • No polls, using national average: 35.6% Trump, 19.8% Cruz, 17.4% Rubio, 9.0% Carson, 8.8% Kasich
  • Estimated delegates: 32 Trump

Hawaii (19 delegates):

  • No polls, using national average: 35.6% Trump, 19.8% Cruz, 17.4% Rubio, 9.0% Carson, 8.8% Kasich
  • Estimated delegates: 10 Trump, 5 Cruz, 2 Rubio, 1 Carson, 1 Kasich

Now, Michigan has a bunch of recent polls. Mississippi’s only recent poll is from the last week of February, which isn’t that long ago, but a lot has happened in that week. And I don’t trust using national numbers for Idaho and Hawaii at all really, but that is the best I can do with no polling at all. So where does this get us:

Projected total for March 8th: Trump +91, Cruz +28, Rubio +18, Kasich +12, Carson +1

With these projections, Trump would get 60.67% of the delegates on March 8th. That would be more than the 53.85% of the delegates he would need to improve his position.

The new totals would be: Trump 482, Cruz 332, Rubio 172, Kasich 49… and 16 for people who have dropped out.

Doing the rest of the math, that is a total of 1051 delegates. 1421 delegates would still be available. Trump would need 755 more delegates to win outright, which would be 53.13% of the remaining delegates.

So Trump would have improved his position, but not by very much.

The above assumes that the current polls hold of course. The results this weekend may indicate that Trump has been weakened by the events of the last week. If so, he may significantly underperform these estimates, putting him in a worse position. So these may be estimates that are optimistic for Trump.

And that still keeps us in the contested convention zone. For now.

Trump’s big chance to break out of that won’t come until March 15th with Florida and Ohio’s 165 winner take all delegates.

Until then, watch to see if Trump is able to match his 53.85% target line on Tuesday.

Update 2016-03-09 03:32 UTC – Update to get ready for tonight’s results. New Oklahoma estimates add one delegate for Cruz, subtract one from Trump. This does not significantly change the analysis above.

Note: This post is an update based on the data on ElectionGraphs.com. Election Graphs tracks both a poll based estimate of the Electoral College and a numbers based look at the Delegate Races. All of the charts and graphs seen in this post are from that site. Additional graphs, charts and raw data can be found there. All charts above are clickable to go to the current version of the detail page the chart is from, which may contain more up to date information than the snapshots on this page, which were current as of the time of this post. Follow @ElectionGraphs on Twitter or like Election Graphs on Facebook to see announcements of updates or to join the conversation. For those interested in individual general election poll updates, follow @ElecCollPolls on Twitter for all the polls as they are added.

Curmudgeon’s Corner: Indexing 90’s Spam!

In the latest Curmudgeon’s Corner Sam and Ivan talk about:
* Follow Bots / Ivan Races
* Puerto Rico / Greece / China
* Election 2016
* Tech Dependency
* Lightning Round

CCCover20141121-bigheads-2
Recorded 2015-07-10

Length this week – 1:48:49

1-Click Subscribe in iTunes
View Podcast in iTunes
View Raw Podcast Feed
Download MP3 File
Follow the podcast on Facebook

Curmudgeon’s Corner: We’re talking about 1996!

In the latest Curmudgeon’s Corner Sam and Ivan talk about:

  • Surprised by the Election? / Demographics / Divided Country
  • How the Republicans Evolve (or don’t)
  • Democrats in 2016 / Bob Dole
  • More 2016 Dems / Feedback / Puerto Rico / Petraeus / Referendums

Recorded on 12 Nov 2012

Length this week – 1:22:17

1-Click Subscribe in iTunes Download MP3 File
View Podcast in iTunes View Raw XML Feed

2012 Republican Delegate Count: Puerto Rico

Chart from the Abulsme.com 2012 Republican Delegate Count Graphs page. When a candidate gets down to 0%, they have cinched the nomination. If they get up past 100%, they have been mathematically eliminated. Rather than the date on the x-axis, we show the “% of Delegates Already Allocated” as this better represents the progress through the race. Note that these numbers include estimates of the eventual results of multi-stage caucus processes which will be refined as the later stages occur.

So. Puerto Rico. Romney wins by a huge margin. He got more than 80% of the vote. In second place Santorum got less than 10% of the vote. 50% was the magic number though. The rules for Puerto Rico said that if the winner gets more than 50%, then the delegates are allocated winner take all. So Romney gets all 20 regular delegates from Puerto Rico. (Romney already had 2 of the 3 super delegates from Puerto Rico before tonight, with Gingrich having the remaining super delegate.)

Obviously getting 100% of today’s delegates is good for Romney, and bad for everybody else. Duh. Romney’s best position so far was still on March 10th, right after Guam and the Northern Marianas results, but before Kansas and the Virgin Islands. But he moves back toward the nomination, and away from the possibility of not getting to 1144 with this result. The others continue on their rapid path toward mathematical elimination. In terms of the magical “% of remaining delegates needed to win” number:

  • Romney: 49.4% -> 48.7%
  • Santorum: 68.7% -> 69.8%
  • Gingrich: 74.8% -> 75.9%
  • Paul: 80.9% -> 82.2%

Next up is Illinois. Romney is ahead in the polls in Illinois, but isn’t over 48.7% in those polls, and of course nobody else is close to the numbers above either. The contest there is a “Loophole Primary” which is a bit odd, but if the delegate results are even close to being proportional to the popular vote result, then we can expect Illinois to be another of the “everybody loses” states where nobody actually gets closer to the nomination in terms of being on pace to win.

Add that to Louisiana, which will almost certainly also be an “everybody loses” state and we should wrap up the March contests with basically the same situation we have right now… the 3-non Romney’s with no chance of winning, but Romney still in the zone where being blocked from 1144 is very much still within the realm of possibility.

And then we’ll have April.

One thing to watch… does Romney remain in the zone where his “% of remaining needed to win” is less than the “% of delegates so far” number. If so, then continuing at the same pace will eventually get him to 1144, just really slowly. If not, then he’ll actually not be on a winning pace, and will have to actually improve his delegate collection rate to win. (Right now Romney has 51.9% of the delegates so far, compared to needing only 48.7% of the remaining delegates to win.)

Curmudgeon’s Corner: Oops a Daisey

In the latest Curmudgeon’s Corner…

Sam and Ivan talk about:

  • Election 2012
  • New iPad Launch
  • Iran / Syria
  • TAL Retraction

Just click to listen now:

[wpaudio url=”http://www.abulsme.com/CurmudgeonsCorner/cc20120318.mp3″ text=”Recorded 18 Mar 2012″]

or

1-Click Subscribe in iTunes

View Podcast in iTunes

View XML Feed